I. INTRODUCTION
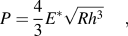
Nanoscale instrumented indentation provides the ability to accurately measure indentation load and penetration depth and thus extract properties such as elastic modulus, hardness, and onset of plasticity, thereby allowing characterization of small-scale mechanical behavior.Reference Doerner and Nix1, Reference Oliver and Pharr2 The onset of plasticity in load-controlled nanoindentation experiments of relatively defect-free solids is often associated with a sudden displacement burst or “pop-in,” i.e., a sudden increase in penetration depth with no corresponding increase in indentation load. Pop-ins have been associated with fracture of a surface oxide,Reference Venkataraman, Kohlstedt and Gerberich3 but in a material relatively free of dislocations, pop-ins are often believed to be associated with dislocation nucleation under the indenter, either in a homogenous state or from point defects.Reference Kelchner, Plimpton and Hamilton4–Reference Zhu and Li6 The correspondence of pop-in behavior with the onset of plasticity is derived from observations that deformation before pop-in is purely elastic. The load–displacement curve before pop-in is fully reversible and can be generally described by the Hertzian contact theory:
 $$P = {4 \over 3}E^* \sqrt {Rh^3 } ,$$
where R is the indenter radius, E * is the reduced modulus, and h is the indentation contact depth. This is only an approximation, and the real tip geometry alters the actual stress distribution under the contact surface; to first order, a Hertzian approximation will generally underestimate the true maximum shear stress by approximately 30%.Reference Ma, Morris, Jennerjohn, Bahr and Levine7 Additionally, if the indenter is unloaded before pop-in, atomic force microscopy reveals no residual indent; conversely, if unloading occurs after pop-in, a residual impression of the indent is observed.Reference Schuh and Lund5 There are reports from in situ indentations using transmission electron microscopy that identified pop-in events after dislocation nucleation,Reference Minor, Ayed Asif, Shan, Stach, Cyrankowski, Wyrobek and Warren8 which matches experimental ex situ indentation observations of pop-ins occurring after elastic loading. While these events can be fit with a Hertzian-type power load, they are not purely elastic.Reference Bahr, Jennerjohn and Morris9
There remain significant challenges in directly correlating loading discontinuities during the indentation process with homogenous dislocation nucleation. One particular difficulty arises from preexisting dislocations. Even in well-annealed metallic single crystals, the initial dislocation density may be on the order of 1011 m−2, and with even slight deformation due to processing, the surface dislocation density can increase to a value beyond 1012 m−2.Reference Zbib and Bahr10 Thus, there is a significant probability that the stress field beneath the indenter tip will interact with a preexisting dislocation after only a small amount of elastic loading. Other investigators have also suggested that incipient plasticity is rate limited by a low-energy process on the scale of a single point defect.Reference Schuh, Mason and Lund11 This could even be true in a sample with existing dislocations; if a process such as double kink nucleation (assuming that the critical double kink width was on the order of the Burgers’ vector) was the rate-limiting step in generating plastic deformation, it would be possible to determine an activation volume on the order of an atomistic volume even in the presence of dislocations.
For the current study, a polycrystalline sample of commercially pure nickel was annealed to produce large grains for orientation-specific indentation, and multiple tip geometries were used for indentation to investigate the effect of tip radius on deformation. Nickel is known to be elastically anisotropic: the elastic modulus ranges from 138 GPa in the <001> direction to 215 GPa in the <110> direction and to 262 GPa in the <111> direction,Reference Betteridge12 thus it is a good candidate material for investigating anisotropy in deformation. Deformation results are discussed in terms of orientation and size effects, with respect to the presence of defects within the material.
II. EXPERIMENTAL PROCEDURES
A sample of nickel 200 (hereafter, Ni200), approximately 13 mm in diameter and 2 mm thick, was prepared by cutting, rolling to 20% deformation, and annealing to generate large (0.5-mm-scale) grains. The maximum allowable impurities for this alloy by weight are 0.25% Cu, 0.4% Fe, 0.35% Mn, 0.15% C, 0.35% Si, 0.01% S. The Ni200 was annealed in air at 1150 °C for 24 h and then air cooled. It was ground through 1200 grit SiC, mechanically polished with 3- and 0.5-μm diamond compound, and finally polished with 0.02-μm colloidal silica on a vibro polisher until a clean, flat, mirror finish surface suitable for electron back scatter diffraction (EBSD) was achieved. Fiduciary marks were then made using Vickers microindentations, so as to be able to locate grains identified with EBSD when nanoindentation was performed.
EBSD data were obtained using orientation image microscopy from TSL (TSL/EDAX, Draper, UT), attached to a FEI FEG/SFEG scanning electron microscope (FEI Company, Hillsboro, OR). Inverse pole figure (IPF) maps were generated for grains around fiduciary marks, and grain orientations were identified. Grains to be indented were selected based on the IPFs. A grain oriented at each vertex of the stereographic triangle was selected; two additional grains with orientations between the vertices were also selected.
The sample was electropolished using a solution of 37% H3PO4, 56% glycerol, and 7% H2O, etching the top few micrometers of material, thereby effectively removing any residual damage layer from mechanical polishing. EBSD was repeated to verify grain orientations. Specifically oriented grains were then indented using a Hysitron Triboindenter (Hysitron, Inc., Minneapolis, MN) with three tips of varying geometry: Berkovich, conical, and cube corner. A series of 25 indents were performed in each grain. A five-segment partial unloading load function was used with peak loads ranging from 250 to 7000 μN. All indentations were separated by 15 μm to ensure that no previous indentation influenced a subsequent indentation. The load–depth curves generated were analyzed to determine reduced modulus, hardness, and “pop-in” load and depth as a function of orientation and indenter size.
III. RESULTS
Indentation of uniquely oriented grains reveals a pronounced orientation effect of yielding. The orientation effect, however, is somewhat overshadowed by the effect of indenter tip radius. We will address each effect separately.
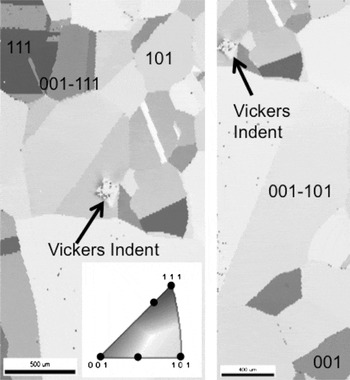
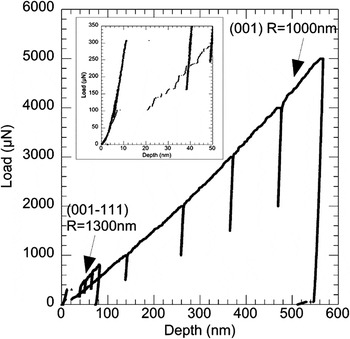
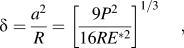
The effect of orientation on yield point data is obtained by indenting grains with specifically oriented planes, which are identified using EBSD. The IPF map obtained from EBSD is shown in Fig. 1. Indented grains are labeled and approximate locations of the specific indents are indicated. For those indents, which exhibit a yield point (pop-in) at the onset of plastic deformation, the load and depth of yield point initiation are recorded; Fig. 2 presents examples of two pop-in events. To first order, the Hertzian contact mechanicsReference Johnson13 was used to calculate maximum pressure (p 0) at yield knowing that:
 $${\rm{\delta }} = {{a^2 } \over R} = \left[ {{{9P^2 } \over {16RE^{*2} }}} \right]^{1/3} ,$$
IPF maps generated from EBSD. Indented grains are labeled with their orientations. Fiduciary Vickers indents are also labeled. Black circles on the stereographic triangle indicate approximate orientation positions.

Examples of load–depth curves showing “pop-ins.” The inset shows an expanded view of the region. The curve with a yield point of ∼300 μN exhibits an elastic unload/reload prior to yield.

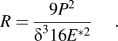
where δ is the contact depth at the yield point, P is the load at the yield point, a is the contact radius, R is the indenter radius, and E* is the reduced modulus. Hertzian approximations are only valid for small strain criterion and can underestimate the stress field beneath typical nanoindentation testsReference Ma, Morris, Jennerjohn, Bahr and Levine7, Reference Ma, Morris, Jennerjohn, Bahr and Levine14; however, since the contact depths at pop-in for these experiments are less than R/3, the low strain approximation is reasonable for the following discussion. For this analysis, the average measured indentation modulus for each grain (using a classical Oliver–Pharr approachReference Oliver and Pharr2) was used to account for anisotropic elastic properties. From Eq. (1), R is given by:
 $$R = {{9P^2 } \over {{\rm{\delta }}^3 16E^{*2} }}.$$
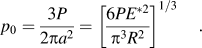
Since the load and depth at the yield point are used in this calculation, the R obtained is the “instantaneous radius,” i.e., the radius of the indenter contact at the moment of pop-in (this is a first order attempt to address the fact that the tips are indeed not perfect spheres). With the instantaneous radius, the yield load, and the orientation-dependent averaged reduced modulus, the maximum pressure is calculated using:
 $$p_{\rm{0}} = {{3P} \over {2{\rm{\pi }}a^2 }} = \left[ {{{6PE^{*2} } \over {{\rm{\pi }}^3 R^2 }}} \right]^{1/3} .$$
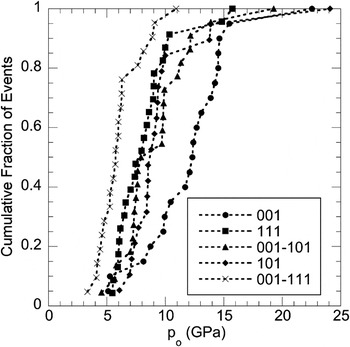
A cumulative fraction plot of the maximum pressure at pop-in was used to compare the distribution of p 0 at yield as a function of orientation. Figure 3 shows typical results for indents performed with a Berkovich indenter on electropolished Ni200. The (001) oriented grain clearly exhibits a higher p 0at yield than the (111) grain.
Maximum pressure at pop-in as a function of orientation. Indentation performed with a blunt Berkovich indenter. (001) orientedgrain exhibits p 0values higher than those of (110) or (111) orientations.

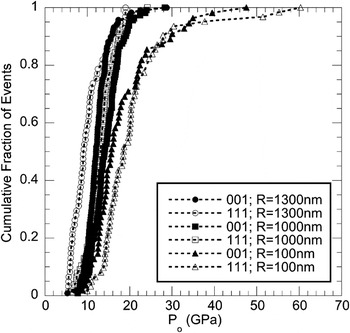
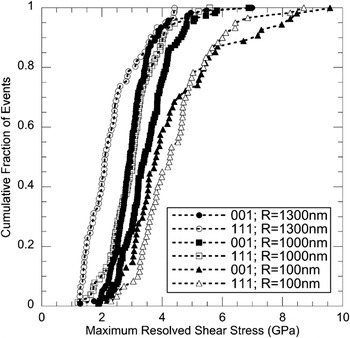
Indentation with tips of varying effective tip radii was performed to determine if a size effect was present and if this effect was impacted by orientation. Figure 4 shows a cumulative fraction plot of maximum pressure for two specific grain orientations for each of the three indenter tip geometries. The Berkovich tip has an approximate tip radius (R) of 1300 nm and an included angle θ of 142.3°, the conical tip has R ≈ 1000 nm and θ = 90°, and the cube corner tip has R ≈ 100 nm and θ = 90°. The data indicate that tip radius does impact the onset of plasticity during nanoindentation. In this case, radius is likely more important than included angle since all pop-in behavior occur in the pseudospherical region, well below the depth at which the tip becomes self similar. In determining the mean pressure during any nanoindentation test, there are three likely sources of uncertainty: changing the effective tip radius as a result of variation in indentation depth, i.e., the tips are not actually spheres,Reference Ma, Morris, Jennerjohn, Bahr and Levine7 apparent radii differences due to indenting on a nonflat sample surface (contact with flat, concave, or convex roughness), and instrument accuracy. The method for determining pressure at yield, using the tip radius measured at the initiation of plasticity, detailed above accounts for radius uncertainty due to both indentation to different depths as well as due to indenting a nonflat surface. The only remaining uncertainty deals with instrument resolution. Since mean pressure varies as depth squared, it is the most sensitive to depth ranges and instrument resolution; we thus expect a maximum uncertainty in pressure of 10%. For clarity, error bars were not included in Figs. 4 or 5.
Interaction of orientation and indenter radius effects on maximum pressure. For clarity, data presented are compiled from two sets of two indented grains with the same nominal orientation. The blunt Berkovich tip is sensitive to orientation, while the sharp cube corner tip is relatively insensitive to orientation but shows a pronounced radius effect, postulated to be the result of defects. A maximum 10% uncertainty is expected due to instrument resolution; for clearness, error bars have not been added to the data points.

Correlation of orientation and radius effect on maximum resolved shear stress. For clarity, data presented are compiled from two sets of two indented grains with the same nominal orientation. A maximum 10% uncertainty in the calculation is expected due to instrument resolution; error bars have not been added to the data points.

IV. DISCUSSION
A. Sampled volume effects
Figure 3 indicates that the yield point is orientation dependent for Ni200 when probed with a large radius indenter. Figure 4 implies that orientation dependence is a function of indenter radius. Blunt or large radius tips are more sensitive to orientation, while the effect is less prevalent for tips with a smaller radius. Other experiments on gold have shown similar orientation effectsReference Corcoran, Colton, Lilleodden and Gerberich15, Reference Kiely and Houston16 as well as similar trends with the effect of radius on pop-in loads observed in Ni3AlReference Wang, Jiang and Lu17 and NiAl,Reference Li, Gao, Bei and George18 while other research in our group indicates that as experimental tip radius decreases, the orientation effect begins to align with that seen via atomistic modeling.Reference Salehinia, Lawrence and Bahr19 As tip radius decreases, the relative invariance in yield pressures for different crystallographic orientations is likely due to a higher probability of indenting a relatively defect-free volume under the indenter.Reference Salehinia, Perez and Bahr20 The effect of defects on the initiation of plasticity for small radius tips is lower, thus pop-in pressures are likely controlled by shear stresses and orientation. These trends have been enumerated in literature as well.Reference Kiely and Houston16 Assuming that the maximum pressure is near a “perfect” crystal location, then the lowest yield pressures are likely tied to the “worst-case” position of a defect.Reference Salehinia and Bahr21 The experimental range of yield pressures is largest for the (111) indentation and lower for the (001) and (101). The lack of significant variation in the lowest observed yield pressure would indicate either a relatively constant defect density, i.e., many indentations will sample a defect but not one in the “worst-case” position, or a defect density, which is on average so small that it is unlikely that the critical stressed volume under the indenter tip contains a heterogeneous dislocation source.
Structural defects have a greater effect for the larger radius tip than that for the smaller radius tip. The larger radius tip creates a larger volume under stress at a given pressure, which is more likely to sample either multiple or larger defects. In this case, the effect of structural defects on the onset of plasticity may be more complex than in simulations. The question then arises: is dominance of tip radius (size) over orientation a result of existing defects or a result of a fundamental size effect?
B. Defect within sampled volumes
If the effect is a result of structural defects, then a plausible mechanism must be identified. Vacancies and stacking fault tetrahedra are unlikely to be present in significant concentrations in these samples due to the long annealing and slow cooling cycle. Impurities may play a role, but likely a small one, because the sample is a commercially pure Ni alloy and the composition should be independent of orientation. The interaction of dislocations with impurities in commercially pure nickel would lead to local strain hardening, as observed by nanohardness testing. Surface asperities are unlikely contributors as the surface roughness (Ra) of the electropolished surface was measured, using atomic force microscopy, to be only 1.71 ± 0.4 nm for all samples. The most likely subsurface defects, then, are dislocations. It has been shown that even in materials with substantial dislocation densities, it is possible to generate a sudden transition from elastic to plastic deformation.Reference Zbib and Bahr10 Using conical indentation, Li et al. have shown an orientation effect, which corresponds with the Berkovich indentation orientation effect observed in this work. The authors suggested that the large pop-in loads measured for orientations close to <001> correspond with a large contact area at pop-in, thus there is a higher probability of activating preexisting dislocations.Reference Li, Gao, Bei and George18 Our group has proposed that the orientations near (001) are less sensitive to defects but more sensitive to crystallography, while the (111) planes are more sensitive to the impact of defects. Based on the Taylor relation, an upper bound for total dislocation density can be estimated from:
 $${\rm{\tau }} = {\rm{\alpha }}Gb\sqrt {{\rm{\rho }}_{\rm{T}} } ,$$
where τ is the shear stress calculated at the yield point from:
 $${\rm{\tau }} = {H \over 6}.$$
H is the approximate Vickers hardness of the bulk, 738 MPa, G is the bulk modulus determined from the relationship G = E/2(1 + v), b is the Burgers’ vector, α is a constant 0.3,Reference Wiedershich22 and ρT is the total dislocation density, including both statistically stored dislocations as well as geometrically necessary dislocations. Using these equations, an upper bound ρT calculated from indents in electropolished Ni200 is on the order of 1014 m−2. This value is clearly an extremum, as it was obtained after the sample was annealed, mechanically polished, and then electropolished. It is, however, likely that the dominance of tip radius is due in part to interactions with dislocations; the volume of the largest tips under significant shear stress will be on the order of the spacing between dislocations. As tip radius decreases, thereby decreasing sampling volume, fewer defects are probed, and thus, their impact on properties becomes less important. Additionally, as tip radius and thus sampling volume decreases, the likelihood of activating a dislocation source of strength similar to those activated by a blunt tip decreases, and thus, a higher pressure is needed to initiate the process. This reasoning has also been suggested by Wang et al.Reference Wang, Zhong, Lu, McDowell and Zhu23
As dislocation nucleation beneath an indenter tip should be a shear-biased event,Reference Lorenz, Zeckzer, Hilpert, Grau, Johansen and Leipner24–Reference Bahr, Kramer and Gerberich26 it follows that source activation can also be examined in terms of shear stresses. Calculating the resolved maximum shear stress for each orientation and tip geometry combination provides a means of comparing orientation and radius effects. Maximum resolved shear stress,  ${\rm{\tau }}_{{\rm{rss}}}^{\max }$, is calculated with the formula used by Li et al.:
 $${\rm{\tau }}_{{\rm{rss}}}^{\max } = Sp_{\rm{0}} ,$$
where p 0 is the maximum pressure determined with Eq. (4) and S is the indentation Schmid factor.Reference Li, Gao, Bei and George18 A linear interpolation based on their Schmid factor map was used to determine the values of S for indented orientations on the (001–111) and (001–101) boundaries.
Figure 5 is a cumulative fraction plot of  ${\rm{\tau }}_{{\rm{rss}}}^{\max }$ for the (001) and (111) orientations indented with all three tip geometries. In agreement with the maximum contact pressure data, the highest
 ${\rm{\tau }}_{{\rm{rss}}}^{\max }$ values are achieved with the sharpest tip, while the most prominent orientation effect is observed for the blunt tip. This examination matches with the postulation that activating a source with a sharp tip requires a higher pressure, or for this analysis, shear stress.
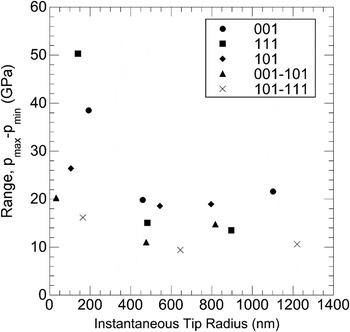
We have shown that despite careful sample preparation, the surface of indented grains of Ni200 can have a relatively high existing dislocation density. If this is the case, it should be possible to use a statistical analysis to separate the effect of available sites and the energy required to activate a site at the yield point. To verify that the sample sets are statistically unique, Wilcoxon–Mann–Whitney rank sum tests were applied to the data. P values between data sets for the different orientations generated by different tips were generally below 0.01, indicating that the data are likely unique (greater than 99% probability). By examining Fig. 3, there is a distribution in maximum pressure required to initiate plastic deformation, a trend consistent with other worksReference Bahr, Kramer and Gerberich26–Reference Tymiak, Kramer, Bahr, Wyrobek and Gerberich28; Fig. 6 plots the pressure range (p max–p min) as a function of the measured average instantaneous tip radius for each grain orientation. As noted by Li et al.,Reference Li, Gao, Bei and George18 the cumulative fraction of events curve will maintain a smooth sigmoidal shape when only a single type of defect is sampled. Using this definition, the data presented in Fig. 4 appear to indicate that only a single defect type is responsible for these measured events. In that case, the variation in pressure or stress at a yield event is most likely controlled by the spatial distribution of defects under the indenter tip. This variation could be examined in a variety of ways, ranging from standard deviation to total range of measured data, to a fraction of the range of measured data (i.e., 20–80%), to a value such as the coefficient of variance. For the purposes of this study, we have selected the total range of event data, but the trends indicated by this would be supported by any of the aforementioned measures of variation in measured data. The greatest effect of pressure range is evidenced in the (111) oriented grain, where the increase in tip radius shows a marked decrease in the pressure range. Michalske and HoustonReference Michalske and Houston25 saw a similar decrease in shear stress with increasing tip radius. Conversely, the (001) grain shows a minimally increasing trend with tip radius. It is important to note in this analysis that p minis relatively unresponsive to orientation within a specific tip geometry but highly responsive to changing tip radius. These trends support the proposition that the (111) oriented plane is more sensitive to defects than the (001) oriented planes. As tip radius increases, sampling volume increases, and the likelihood of probing a single defect decreases, thereby decreasing the range of pressures, which initiate plasticity, and defining the minimum pressure required for yield.Reference Ngan, Zuo and Wo29
Range of pressures required to initiate plastic deformation as a function of instantaneous tip radius. The pressure range (p max–p min) is used as a measure of the variation in spatial distribution of defects beneath the indenter tip. This measure is used since the shape of the cumulative fraction curves indicate that the same type of defect is sampled in each case.

C. Activation volume analysis
The energy required to activate a defect site during nanoindentation can be determined by evaluating the cumulative distribution of maximum pressures associated with the initial yield point. The rate of dislocation source activation in a unit volume of material subjected to a pressure p 0has an Arrhenius-type relationship and can be written:
 $$\dot N = \dot N_{\rm{o}} \exp \left[ { - {{{\rm{\varepsilon }} - 0.31p_{\rm{0}} v^* } \over {kT}}} \right],$$
where  $\dot N_{\rm{o}} $ is the preexponential constant “attempt frequency,” v* is the activation volume, ε is the intrinsic nucleation energy barrier, and kT is the thermal energy. Since the nucleation of dislocations is a stress-induced process, Eq. (8) is generally presented in terms of the maximum shear stress, τ. However, τ = 0.31p 0, thus Eq. (8) can be written as shown above. The cumulative distribution of pressures at yield for indentations in two representative grain orientations for all three tips is shown in Fig. 4. This plot illustrates the strong radius dependence, with a noticeable increase in pressures between the blunt tip (Berkovich) and the sharpest tip (cube corner) and indicates an orientation dependence, as evidenced in Fig. 3. As described by Schuh and Lund,Reference Schuh and Lund5 if we recognize that there is only one initial yield point allowed per indentation, the population of indentations available to yield is equal to 1−f. Then, a differential equation describing the population in terms of activation rate can be expressed as:
 $$\dot f = (1 - f)\dot N.$$
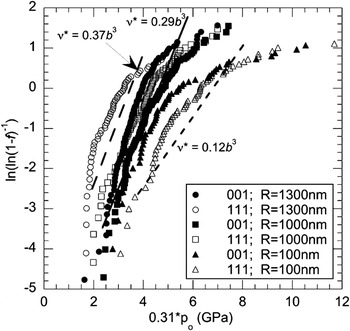
To obtain the unknown parameters of Eq. (8), a linear least squares fitting technique is applied. Figure 7 is a plot of ln(ln(1−f)−1) as a function of 0.31p 0 and the data are curve fit using a linear regression; therefore, the slope of the line is v*/kT, and the intercept is the ln(η), where  ${\rm{\eta }} = \dot N_{\rm{o}} \exp ( - {\rm{\varepsilon }}/kT)$, or the rate at which defects would nucleate due to thermal activation alone. The values of v* for each orientation for all three tips are tabulated in Table I; activation volume decreases with decreasing tip radius. Additionally, the maximum shear stress tends to increase as the tip radius decreases for all orientations except the (001)–(111) grain. If homogeneous dislocation nucleation was the active mechanism in this case, one would expect that a smaller volume under a higher stress was needed to create a new dislocation. However, the volume determined is significantly smaller than one would expect for a dislocation loop, so it is the magnitude, not the trend, which implies that the mechanism in this case is not homogeneous dislocation nucleation. For propagation, rather than nucleation, in a pure shear condition, one would not expect a yield point. However, since the dislocations sampled by the stress field are likely not perfectly located symmetrically under the indenter tip, the most likely way to cause a loop to expand is to require an activation event to occur once the entire loop is at a stress high enough to move the dislocation. For instance, a kink or double kink (on the order of fractions of a Burgers’ vector) on the portion of the loop furthest from the indenter could be the critical activation event needed to start the loop growing, assuming that the double kink separation distance is on the order of the Burgers’ vector. Since the region of the dislocation loop closest to the indenter would be overdriven, the activation of a double kink could then lead to the rapid expansion of the dislocation loop, rather than a smooth propagation that one might expect for a uniformly applied shear stress. It should be noted that the activation volume is not related the volume under the tip, which is undergoing shear stress; however, in these cases, they indeed are both smaller for the smaller radius tips.
Data used for linear least squares fitting to determine activation volume. Data presented are compiled from two sets of two indented grains with the same nominal orientation. Heavy straight lines are examples of fits and the accompanying activation volume value, which is normalized by the Burgers’ vector.

Activation volumes (in nm3) normalized by Burgers’ vector (b Ni = 0.248 nm) calculated from least squares fitting of Eq. (8) for each sampled orientation and tip geometry and maximum applied shear stresses in (GPa) for each case. The (001) and (111) data were collected from two grains with the same nominal orientations, while the other three orientations included data from only one indented grain.

a Only two yield points were observed.
V. SUMMARY AND CONCLUSIONS
The effects of crystallographic orientation and indenter tip radius were investigated through EBSD and nanoindentation of commercially pure Ni200.
(i) An orientation effect is observed in yield pressure for the onset of plasticity in Ni. Yield occurs at generally higher loads in the (001) oriented grain than in the (110) or (111) grains when indentation is performed with a relatively blunt (1300 nm) radius indenter tip.
(ii) The effect of tip radius can overshadow the orientation effect, as the 1300-nm radius tip is more sensitive to orientation than either the 1000- or 100-nm radius tips. However, the sharpest tip appears to be most sensitive to individual defects.
(iii) The observed indenter radius effect on the onset of plasticity is likely due to the presence of defects rather than a fundamental size effect. The initial dislocation density is sufficiently high to result in an interaction between the stress field beneath the indenter tip and a dislocation even at very low loads and shallow indentation depths.
(iv) The activation volume for incipient plasticity, using a cumulative event fraction analysis, suggests that larger tips require activating a larger volume of material. However, since this occurs at a lower stress than the smaller tips, the logical feature being activated is a dislocation loop and not only defects on the atomistic level in this case. This does not preclude an atomistic event being the critical feature in expanding a dislocation loop but instead suggests that the activation volume analysis alone cannot distinguish between nucleating a new dislocation and an atomistic process expanding an existing loop.
In summary, we have shown an orientation dependence of the onset of plastic deformation processes as well as a pronounced tip radius effect, likely the result of an interaction between an existing dislocation and the stress field produced beneath the indenter tip.
Supplementary Material
Supplementary materials can be viewed in this issue of the Journal of Materials Research by visiting http://journals.cambridge.org/jmr.
ACKNOWLEDGMENTS
The authors would like to thank I. Salehinia for valuable discussion regarding computational studies of incipient plasticity and Dr. M.J. Cordill of the Erich Schmid Institute of Materials Science, Leoben, Austria, for AFM roughness measurements. This work was supported by NSF Grant Nos. NSF/DMR-0946337 (D.F.B.) and NSF/CMMI 1030843 (S.K.L. and H.M.Z.).