I. INTRODUCTION
Quantum dot sensitized solar cells (QDSSCs) have gained great interest in recent years, due to their special features like tunability of band gap, high absorption coefficient, intrinsic dipole moment, multi exciton generation, extraction of hot electrons and quantum confinement. Reference Pan, Zhao, Wang, Zhang, Feng and Zhong1–Reference Gonzalez-Pedro, Shen, Jovanovski, Gimenez, Zaera, Toyoda and Sera6 TiO2 has been an efficient photoanode in the development of dye sensitized and QDSSCs. The properties of TiO2 can be improved by doping metal or nonmetal atoms so as to obtain desirable optical absorption, band edge energies, and electrical conductivity, contributing to high performance in photovoltaic (PV) devices. Reference Duan, Fu, Liu, Fang, Zhou and Zhang7,Reference Archana, Gupta, Yusoff and Jose8 It has been proved that doping of TiO2 has shown significant improvement in photocatalysis. Reference Nam, Trang and Cong9–Reference Xu, Chen, Yang, Li and Wang12 But there have been very few reports on the use of such materials for energy harvesting in quantum dot (QD) solar cells. López-Luke et al. Reference López-Luke, Wolcott, Xu, Chen, Wen, Li, Rosa and Zhang13 examined the photoresponse of N doped TiO2 thin films, sensitized with CdSe QDs via a linker molecule, thioglycolic acid (TGA) and they have claimed dopant nitrogen to be responsible for the enhanced photocurrent. CdSe QDs linked to N doped TiO2 nanoparticles via TGA has been observed to have significantly increased the photocurrent and power conversion. The present work reports the doping of lanthanide ion into commercial TiO2 (C-TiO2) to produce neodymium (Nd) substituted TiO2, which inturn is observed to facilitate the improvement of electronic properties of C-TiO2, resulting in an enhanced photoresponse. Reference Minchitha and Balakrishna14
Counter electrode plays an essential role in collecting electrons from an external circuit thus causing the reduction of electrolyte. Reference Paul, Kim, Kim, Do, Ko and Yu15,Reference Ye, Chen, Zhang, Wen, Guo and Lin16 The platinum counter electrode which is excellent for dye sensitized solar cells has shown to be problematic with QDSSCs. The sulfur compounds in polysulphide electrolyte used in QDSSC, is known to chemisorb on platinum surface and induce poisoning effect toward electrode performance. Reference Radich, Dwyer and Kamat17 Alternatively Cu2S, CuS, CoS, PbS exhibits high electrocatalytic activity for polysulphide reduction, but each of them have their own issues over longer periods of time, when used in conjunction with photoanodes. For instance continual corrosion occurs when Cu2S counter electrode is exposed to polysulphide electrolyte, leading to mechanical instability. Reference Radich, Dwyer and Kamat17–Reference Mathesh, Liu, Nam, Lam, Zheng, Barrow and Yang19 A wide range of carbon materials has gained attention as potential electrode materials in energy storage, solar cells and electrochemical devices etc. In particular, graphene based materials like graphene oxide (GO) and its composites have attracted interest as counter electrode material in solar cells due to their tremendous features like high electron conductivity, large surface area, high thermal conductivity, and good mechanical stability. Reference Roy-Mayhew, Bozym, Punckt and Aksay20–Reference Bai and Jiang24 Radich et al. Reference Radich, Dwyer and Kamat17 designed reduced GO–Cu2S composite and succeeded in shuttling electrons through the RGO sheets and polysulphide active Cu2S more efficiently than platinum electrode.
Based on these analyses it has been attempted to prepare (by a facile sonication technique) a composite of graphene material [GO and copper sulfide (CuS)] as counter electrode to obtain the advantages of both the native materials. Compared to other counter electrodes, GO provides large surface area, good mechanical stability, huge intrinsic electron mobility, and combination of GO with CuS provides better stability and quick movement of electrons for the completion of cell in a GO–CuS electrode. The present work aims to construct Nd doped TiO2–CdSe QDSSC using presynthesized CdSe QDs for sensitization (via TGA molecular linker) and GO–CuS composite as counter electrode (Scheme 1) to exploit the synergistic effects for better energy conversion.
A schematic representation of Nd–TiO2 quantum dot solar cell depicting the charge transfer from CdSe to Nd–TiO2.

II. EXPERIMENTAL
A. Materials and methods
Nd2O3·5H2O (99.9%; Loba Chemicals LTD., Lviv, Ukraine) was used as a precursor to dope Nd into commercial TiO2 (SDFCL, Mumbai, India). The others include Copper sulfide (Rolex Chemicals, Mumbai, India), Cadmium oxide (99%; Aldrich, St. Louis, Missouri), Selenium (99%; Fluka, St. Louis, Missouri), Octadecyl amine (90%; Aldrich), Trioctyl phosphine (TOP, 90%; Fluka), Oleic acid (90%; Merck KGaA, Darmstadt, Germany), n-Octadecane (99.9%; Aldrich), Graphite powder (<20 µm diameter) (Aldrich), Potassium permanganate (99%; SD Fine chemicals), Sodium nitrate (≥98%; SD Fine chemicals), Na2S xH2O (≥60%; Aldrich), Sulfur (≥99.5%; Aldrich), Acetic acid (Aldrich), Poly vinylidene fluoride (PVDF) (Aldrich), Nafian (Aldrich; 5% in a mixture of lower aliphatic alcohols and water) and TGA (≥98%; Aldrich). Hydrochloric acid (≥35%), Sulfuric acid (95–98%), Hydrogen peroxide (≥30%), and solvents like N-Methyl pyrrolidinone, Ethanol and Toluene were of Merck brand. Fluorine doped tin oxide (FTO) glass was procured from Sigma Aldrich (St. Louis, Missouri) and Triton X-100 from Solaronix (Aubonne, Switzerland).
B. Preparation of Nd doped TiO2
The Nd induced TiO2 was synthesized by a solid state technique using an appropriate precursor, Nd2O3·5H2O. Reference Shwetharani, Jyothi, Laveena and Balakrishna25 The pulverizing mixture for 1% doped Nd–TiO2 contained C-TiO2 and Nd2O3·5H2O in the ratio of 0.96:0.06 by weight. Pulverization in a tungsten carbide vial using SPEX 8000M mixer mill (SPEX Sample Prep, Metuchen, New Jersey) was carried out for a time period of 1.5 h. The obtained sample was annealed at 600 °C for 6 h without maintaining any extra conditions, to cause an effective doping.
C. Synthesis of GO
GO was synthesized using modified Hummers and Offmann method. Reference Hummers and Offman26 Graphite powder (3.0 g) was oxidized by NaNO3 (1.5 g) and conc. H2SO4 (69 mL) under constant stirring followed by cooling in an ice bath. KMnO4 (9.0 g) was added gradually under vigorous stirring, with the temperature being maintained below 10 °C. The reaction mixture was stirred for 30 min at room temperature, followed by the addition of deionized water (138 mL). Then the temperature of the reaction mixture was raised gradually again to 98 °C and maintained at this temperature for 15 min. Finally, the reaction was terminated by adding H2O2 (3 mL) followed by stirring for another 30 min at room temperature. The resultant precipitate was washed with HCl (5 vol%) and deionized water, till the supernatant of the solution becomes neutral. The obtained graphite oxide was sonicated in deionized water (0.1 mg/mL) for 30 min to get GO, followed by centrifugation and drying.
D. Synthesis of GO–CuS composite
The complexation of GO was done by mixing an equal amount of GO (10 mL, 0.1 mg/mL) with commercially obtained CuS in ethanol. The mixture was sonicated for an hour; sonication provides highly intensive mixing and necessary exfoliation of GO sheets. Reference Radich, Dwyer and Kamat17 The resulting composite was washed with ethanol and dried. A drop of 1% of binder, PVDF in N-Methyl pyrrolidinone (solvent) was added for the support. This composite was casted on a clean FTO glass substrate of 0.16 cm2 area.
E. Preparation of CdSe QDs
The method of preparation of CdSe QDs is as reported in our earlier paper. Reference Chandan, Saravanan, Pai and Balakrishna27 To brief, 4.0 g of n-octadecane and 0.34 g of octadecyl amine were heated, for dissolution. On dissolution 0.013 g of CdO was added, followed by the addition of 0.5 mL oleic acid. The solution was further heated to 200 °C and at this stage 0.076 g of Se precursor (prepared by mixing 0.5 mL of trioctyl phosphine and 4.0 g of n-octadecane) was swiftly injected into the above solution. The temperature was allowed to rise back to a growth temperature (GT) of 190 °C. An aliquot collected after 100 s of attaining GT resulted in red colored QDs. The crude nano crystal growth was quenched by dispersing it in toluene and was extracted with ethanol, vortexed, followed by centrifugation at 5000 rpm for 10 min. The nano crystals were purified and resuspended in toluene for use.
F. Fabrication of QD solar cells
FTO substrate was cleaned by sonicating sequentially in a surfactant, deionized water, acetone, and ethanol. A paste of C-TiO2 was prepared by mixing 0.25 g of C-TiO2 with 0.5 mL of acetic acid and ground mechanically. Then a mixture of 1:1 (10 mL) deionized water and ethanol was added drop wise and ground for 20 min. Finally Triton-X (0.5 mL) was added and the resultant mixture was ground to get a homogeneous paste. Similar method was adopted for the preparation of Nd–TiO2 paste. The obtained paste was coated on the FTO glass substrate by doctor blade technique. Reference Amoli and Sinha28 The average thickness of the film was maintained at ≈5 µm. The coated films were sintered at 450 °C for 30 min without maintaining any extra conditions. On cooling to room temperature the films were scratched into 0.16 cm2 area and immersed in TGA (a molecular linker), for 10 h. After immersion the electrode (films) was washed with toluene to remove excess TGA. Finally the electrode was immersed in CdSe–toluene suspension for 12 h for sensitization. The counter electrode GO–CuS composite was then clipped onto the top of working electrode to form a complete solar cell using polysulphide electrolyte (1 M Na2S and 1 M sulfur in deionised water).
G. Characterization techniques
Phase identification of the nano particles were studied by Shimadzu XRD 7000 (Shimazdu Corp., Kyoto, Japan) using Cu Kα radiation. The crystallite size was determined by d hkl = kλ/β cos θ. Reference Shwetharani, Jyothi, Laveena and Balakrishna25 Quanta 200 Carl Zeiss (Oberkochen, Germany) field emission scanning electron microscope was used to obtain FESEM images. To measure the surface patterns and particle size of the nano powder, Technai 10 Philips transmission electron microscope (TEM; FEI Company, Hillsboro, Oregon) was used. TEM sampling was done by ultra-sonication of the powder in isopropanol, and then the suspension was placed on copper grid for further measurement. VG Scientific FSCA MK II spectrometer was used to record the x-ray photoelectron spectra (XPS) and was operated in the fixed analyzer transmission mode with C 1s as reference of binding energy, 284.6 eV. The absorption and diffused reflectance spectra were recorded by a Shimadzu 1700 PC UV–Visible spectrophotometer. Kubelka–Munk plots of (1 − R ∞)2/2R ∞ versus wave length were plotted to measure the band gap, where R ∞ is the ratio of relative reflectance to reflectance of nonabsorbing medium (100%). Photoluminescence (PL) of the sample was recorded using Shimadzu RF 5301 PC spectro fluorometer. Electrochemical measurements were performed using a CHI660D potentiostat (CH Instruments, Austin, Texas) using standard three electrode system with a modified glassy carbon (GC) as working electrode, platinum wire as counter electrode and Ag/AgCl (1 M KCl) as the reference electrode. Prior to electrode modification, the GC (3 mm diameter) electrode was polished with alumina slurry of different particle size (1, 0.3, and 0.05 μm) followed by rinsing with copious amount of distilled water. Then the electrodes were sonicated in ethanol–water (1:1) mixture for about 5 min. Finally it was rinsed with distilled water and dried at room temperature. 3.0 mg of CuS was dispersed in 1 mL of water–ethanol mixture (0.7:0.3) and 20 µL of 5% nafion and sonicated for 30 min. 10 µL of that solution was drop casted on the surface of GC electrode and dried under room temperature. PV performance of the assembled solar cell was measured by completely integrated I–V Test station (PVIV-211 V) with Kiethley 2420 source meter (Keithley Instruments, Cleveland, Ohio) and 94023A Oriel Sol3A, class AAA solar simulator (power output: 100 mW/cm2, lamp power: 450 W), equipped with an air mass (AM) 1.5 filter (Oriel Instruments, Bozeman, Montana).
III. RESULT AND DISCUSSIONS
A. Structural, morphological, and optical characterization
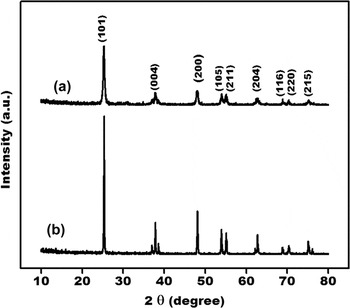
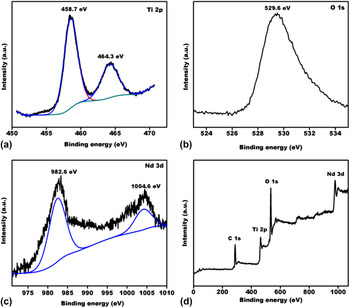
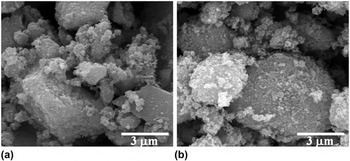
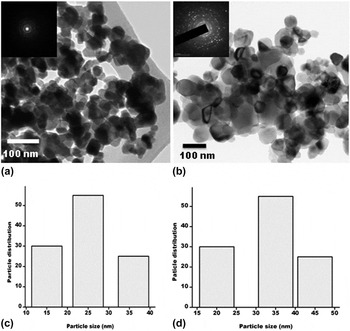
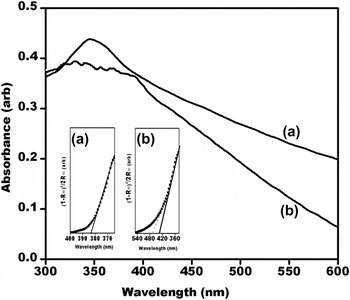
Phase identification of C-TiO2 and Nd–TiO2 were analyzed by x-ray diffraction (XRD) patterns, as shown in Fig. 1. The patterns could be assigned to the tetragonal structure of anatase TiO2 in agreement with JCPDS card No. 21:1272. No observable peak shift was detected in the doped sample, may be due to the low dopant concentration. Doping sometimes causes a change of phase from anatase to rutile which is thermodynamically more stable. Reference Chen and Mao29 However no such phase transition or peaks for rutile phase were observed. The crystallite size calculated as per Scherrer’s equation increases from 22.9 to 31.8 nm, suggesting the incorporation of dopant into the crystal lattice. Reference Shwetharani, Jyothi, Laveena and Balakrishna25 Milling causes the crystal lattice of C-TiO2 to undergo severe plastic deformation producing stresses and strain. This creates a lattice distortion causing many defects inside the C-TiO2 nanoparticles, creating high surface and lattice distortion energy. This decreases the activation energy for the diffusion of elements and allows atomic and ionic diffusion among elements at room temperature, when the activity of powder system is high enough. The collision between the balls and grains of powder also increases the interface temperature, facilitating easy incorporation of dopants. Reference Minchitha and Balakrishna14 The chemical composition of the doped sample (Nd–TiO2) was analyzed by x-ray photoelectron spectroscopy. Figure 2 displays the binding energy status for Ti 2p, O 1s, and Nd 3d in Nd–TiO2 sample. The Ti 2p [Fig. 2(a)] shows two peaks at binding energies of 458.7 and 464.3 eV corresponding to Ti 2p 3/2 and Ti 2p 1/2 states. The O 1s [Fig. 2(b)] exhibits a major peak at 529.6 eV. The presence of Nd in the form of Nd3+ is confirmed in Fig. 2(c). Major peaks obtained at 982.6 and 1004.6 eV are attributed to Nd 3d 5/2 and Nd 3d 3/2 states which confirm the presence of Nd3+ ion in the lattice of the doped sample. Figure 2(d) shows the wide scan spectra of Nd–TiO2, which indicates the presence of Ti, O, and Nd at various binding energy levels. Figure 3 represents the SEM image of C-TiO2 and Nd–TiO2 sample. SEM image of C-TiO2 shows irregular shaped micro structures where as Nd–TiO2 shows slightly sphericular micro structures with an increase in grain size, averaging around 1–4 μm. The average particle size and the morphology of the sample were analyzed by TEM as shown in Fig. 4. The nano scale graph of C-TiO2 [Fig. 4(a)] shows more uniform spherullites, where as the Nd doped sample [Fig. 4(b)] indicates few irregular shaped, distinct size nanoparticles, attributed to substitution and some larger than the C-TiO2. Inset of Figs. 4(a) and 4(b), shows selected-area electron diffraction (SAED) patterns, depicting diffraction rings for polycrystallinity of the doped sample. The size distribution histograms are as shown in Figs. 4(c) and 4(d). Random selections of around 100 particles were chosen for the distribution study. The mean particle size estimated for C-TiO2 was found to be 20–28 and 30–37 nm for Nd–TiO2 and this indicates the enhancement of particle size on doping. The increased particle size of such nano structures in the doped sample are predicted to have reduced band gap, thus being beneficial for better light harvesting. Reference Klimov30 Figure 5 represents the absorption spectra of C-TiO2 and Nd–TiO2 nano particles. The band edge (E g) absorption of Nd–TiO2 red shifts to 420 nm upon doping (as measured from Kubelka–Munk plot, the inset of Fig. 5), indicating the extension of light absorption to visible range. In addition to decrease of the band gap energy from 3.1 to 2.9 eV, there appears to be a mid band at 2.6 eV as shown by the dotted line in the Kubelka–Munk plot. The prediction that, size dependent contribution to the energy gap is being simply proportional to 1/r 2 (r being the particle radius) is strongly supported by the observed red shift Reference Klimov30 and an increase in the particle size as evident from TEM. Further the arise of midbands/defect states and their function as electron traps to suppress recombination is substantiated by PL studies. The cause of main PL emission in any semiconductor (SC) is shown in Fig. 1 of S. I, is mainly due to radiative recombination of electrons and holes. When photons of equivalent or more energy than the band gap energy of SC strikes the SC, the photogenerated electrons reach the conduction band and return back to the valence band, with the emission of energy as PL radiation. This process is identified as direct band–band transition PL. Other PL processes that can occur, includes, the transfer of excited electrons from the conduction band to different sub-bands, e.g. surface oxygen vacancies or defects, via nonradiative transition, and subsequently from the sub-bands to the valence band via radiative transition with the release of PL signals. Reference Shwetharani, Fernando and Balakrishana31 As observed in the figure, doping causes a significant decrease in the PL intensity, suggesting the occurrence of the latter process. Decrease in recombination rate evidently supports the increased availability of electrons for charge transfer. The shoulder peak at around 462 nm corresponds to emission of mid band or deep level traps in C-TiO2. The small emissions below 450 nm are attributed to the recombination of trapped electrons–holes in surface defects. Reference Yan, Wu, Guan, Li, Li and Cao32 When Nd3+ is doped on the surface of C-TiO2, it will plunder oxygen into C-TiO2 due to feasible redox couple of Ln n+/Ln(n−1)+. Oxygen vacancies will be much easier to form because the chemical bond strength of Nd–O is stronger than Ti–O. Reference Zhang, Zhao, Wang, Yu, Guan, Yu, Li and Zou33 Thus it can be presumed that induction of Ti3+/Nd3+ introduces oxygen vacancies to maintain spontaneous charge neutrality or equilibrium. Creation of such labile oxygen vacancies favorably induces better adsorption sites for sensitization of QDs leading to better harvesting of sunlight.
XRD patterns of (a) C–TiO2 and (b) Nd–TiO2.

XPS of (a) Ti 2p (b) O 1s (c) Nd 4d and (d) wide scan spectrum of Nd–TiO2.

Scanning electron micrograph of (a) C-TiO2 and (b) Nd-TiO2.

TEM of (a) C-TiO2, (b) Nd–TiO2 (inset: (a) and (b) SAED pattern), (c) and (d) size distribution histogram of C-TiO2 and Nd–TiO2.

UV–Vis spectra of (a) C-TiO2 and (b) Nd–TiO2. Inset: Kubelka–Munk plot of (a) C-TiO2 and (b) Nd–TiO2.

B. Characterization of CdSe QDs
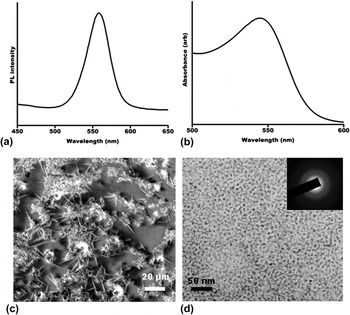
Figures 6(a) and 6(b) shows the emission and absorption spectra of CdSe QDs in toluene. The particles exhibit transitions in the visible region with sharp band edge absorption at 565 nm and emission at 590 nm. The narrow full width half maximum (FWHM) of 35–40 nm in the emission spectra depicts QDs to be monodispersed. In Fig. 6(c) the FESEM images depict a needle like structure for the ligand passivated QDs. Figure 6(d) depicts the high resolution transmission electron microscope (HRTEM) image of the QDs wherein the QDs depict particle sizes of ∼3 nm being monodispersed and having narrow size distribution. The SAED pattern of QDs in the inset of Fig. 6(d) shows the polycrystallinity of the sample. The detailed characterizations of QDs have been previously published. Reference Chandan, Saravanan, Pai and Balakrishna27
(a) PL (b) UV–Vis (c) FESEM and (d) HRTEM images of red CdSe QDs (inset SAED pattern of CdSe).

C. Structural, morphological, and electrochemical characterization of GO–CuS
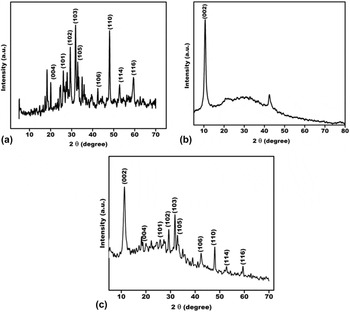
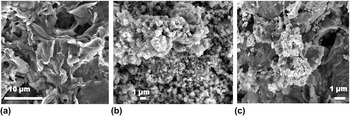
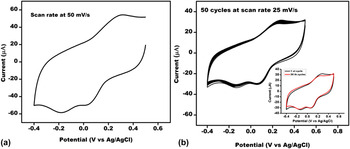
Figure 7(a) represents the XRD pattern of commercially obtained CuS. It was noted that there are some major 2θ peaks at 21.7°, 27.7°, 29.3°, 31.8°, 33.0°, 35.0°, 38.8°, 43.1°, 48.0°, 53.2°, and 59.4° corresponding to (004), (101), (102), (103), (006), (104), (105), (106), (110), (114), (116) faces of a CuS crystal respectively, in agreement with the standard JCPDS card 79-2321. Figure 7(b) shows the XRD patterns of GO prepared by modified Hummers and Offmann method, and has characteristic peak at 11.5° corresponding to the 002 plane. This reflection peak corresponds to the interlayer basal spacing of 7.3 Å due to presence of oxygen functionalities present on the surface of GO and the reflection peak (100) at 2θ = 42.57° suggests that GO exhibits turbostratic disorder. Reference Netravathi, Vishwanath, Michael and Rajamath34,Reference Muralikrishna, Sureshkumar, Varley, Nagaraju and Ramakrishnappa35 Figure 7(c) shows the presence of GO characteristic peak along with the other peaks of CuS confirming the formation of GO–CuS composite. The association of Cu2+ cation with GO, is reported to be driven by electrostatic interaction between the copper cationic species and the electro negative oxygen found dispersed on GO sheet to form a composite. Reference Radich, Dwyer and Kamat17 Figure 8(a) depicts a layered (wrinkled) structure of GO sample. Figure 8(b) displays the morphology of CuS particles which appear to be dispersed in irregular shapes. Figure 8(c) shows GO–CuS composite where there is a clear indication of dispersion of CuS particles on the layered GO sheets. This image evidences the coupling of CuS with GO sheets. The electrochemical behavior necessary to evaluate its capacity as counter electrode material was carried out using cyclic voltammetry. Cyclic voltammogram of GO–CuS modified GC electrode in oxygen free pH 7 phosphate buffer solution between the potential window +0.5 to −0.4 V against Ag/AgCl reference electrode with a scan rate 0.05 V/s is as shown in Fig. 9(a). We observed two distinct cathodic peaks for reduction of Cu(II) to Cu(I) at 0.03 V and Cu(I) to Cu(0) at −0.18 V versus Ag/AgCl respectively. In oxidative direction we observed one anodic peak for total oxidation of Cu(0) to Cu(II) at +0.31 V versus Ag/AgCl. Reference Zen, Chung and Kumar36,Reference Wang, Hu, Yang and Zhang37 We further performed 50 cycles with the same potential window with a scan rate of 0.025 V/s and are shown in Fig. 9(b). A negligible decrease in current from 1st to 50th cycle is observed [inset of Fig. 9(b)]. This indicates the GO–CuS composite material to be electrochemically stable.
XRD pattern (a) CuS (b) GO (c) GO–CuS.

FESEM images of (a) GO (b) CuS (c) GO–CuS.

(a) Cyclic voltammogram of GO–CuS at scan rate of 50 mV/s (b) 50 cycles inset: 1st and 50th cycle.

IV. I–V CHARACTERISTICS
C-TiO2 and Nd–TiO2 electrodes were sensitized with CdSe QDs. The path approached for sensitization was via a molecular linker. Selection of linker molecule for the attachment of CdSe QDs plays a determinant role in the cell performance. Reference López-Luke, Wolcott, Xu, Chen, Wen, Li, Rosa and Zhang13,Reference Kamat38 Length of the linker molecule also affects the performance of the device; the use of longer chain linker molecule reduces the tunneling probability. Reference Xua, Gimenez, Mora-Sera, Abate, Bisquer and Xu39,Reference Mora-Sera, Gimenez, Moehl, Santiago, Lana-Villareal, Gomez and Bisquert40 Possibly due to the least length of carbon chain, TGA was chosen as a molecular linker. Linker assisted attachment enables control over the distance and electronic coupling between the CdSe QDs and the substrate. Nd–TiO2 has great affinity toward the carboxylate group of TGA and the CdSe QDs have affinity toward the thiol group of TGA.
QDSSC in principle adopts a design of DSSC, in which the photoexcited electrons are injected into TiO2 nano crystallites from excited SC QDs. The electrons percolate through the TiO2 network to reach the substrate. The electrons reach the counter electrode by passing through the external load and reduce the redox mediators which donate electrons to fill the holes in the QDs. Reference Jun, Careemm and Arof41 GO sheet has two accessible sides and consists of surface functionalities such as epoxide, hydroxyl, and carboxyl groups. Those oxygen containing groups on the sheets provide multiple binding site for Cu2+ ions that can react with GO and prevent the nanoparticles from agglomeration, thus promoting better surface area. Reference Bai and Jiang24 Doping of Nd into C-TiO2 crystal lattice create midbands, either due to dopants or defects and facilitate better light harvesting and suppressed recombination. Avoiding recombination of electron–hole pairs could increase the interfacial charge transfer improving the efficiency, as good photoanode material in solar cells. Reference Bingham and Daoud42 Also the better stability [as evident from cyclic voltammetry (CV) analysis] of GO–CuS as counter electrode material together with high surface area imparted by the GO to provide more active sites for the reduction of electrolyte, facilitating quick transport of electrons to the polysuphide redox system, can prominently enhance the efficiency of the solar cell. Hence Nd–TiO2 as photoanode and GO–CuS as counter electrode are observed to improve the overall performance of the doped QDSSC.
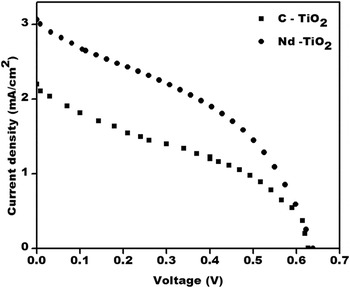
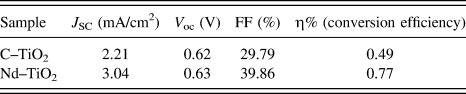
Figure 10 depicts the Current–Voltage curve and Table I illustrates the PV parameters of C-TiO2 and Nd–TiO2 in the prepared PV devices with an active area of 0.16 cm2 under stimulated irradiation. Each of the experiment was conducted more than three times and only the consistent result of each is presented. The C-TiO2 QDSSC shows short circuit current (J sc) = 2.21 mA/cm2, open circuit potential (V oc) = 0.62 V, fill factor (FF) = 29.79%, and conversion efficiency (ƞ) = 0.49%, whereas Nd–TiO2 QDSSC shows J sc = 3.04 mA/cm2, V oc = 0.63 V, FF = 39.86%, and ƞ = 0.77% respectively as observed in Table I. The C-TiO2 is used as reference material to compare the enhanced PV characteristics of Nd doped TiO2. The increased concentration of Nd beyond the optimum content of 1% resulted in reduced efficiency as shown in supporting information which may be due to higher dopant content that acted as recombination center. The plot in Fig. 2 and Table 1 of S.I depicts the decreased efficiency with an increased percentage of doping. Possibility of trapped charge carrier recombination through quantum tunneling would be enhanced with the lack of driving force to separate them. Optimum doping enhances photon absorption, improves charge transport, and suppresses charge recombination which in turn contributes to better performance of the solar device. Comparatively, the obtained open circuit potential of both the devices is better and could be attributed to higher extinction coefficient of QDs which can control recombination. Reference Sudhagar, Song, Lee, Mora-Sera, Bisquert, Laudenslager, Sigmund, Park, Paik and Kang43
Current–voltage curve of C-TiO2 and Nd–TiO2.

PV parameters of C-TiO2 and Nd–TiO2 quantum dot solar cells.

V. CONCLUSION
GO–CuS composite has been successfully synthesized by a simple sonication technique. XRD, AFM (atomic force microscopy), and CV analysis confirmed the coupling of CuS on the GO sheet. The combined properties of both the materials (GO dispersions of CuS) were exploited for its application as counter electrode in QDSSC using Nd doped TiO2 as anode material. The study gains significance in providing a new composite material of GO as counter electrode for an enhanced visible light activated Nd doped titania-photoanode to enhance its light-to power conversion efficiency by ∼1.6 times, in QDSSCs.
Supplementary Material
To view supplementary material for this article, please visit http://dx.doi.org/jmr.2015.314.
ACKNOWLEDGMENT
The authors wish to acknowledge Ministry of New and Renewable Energy, India for funding and Center for Nano Science and Engineering, IISc for providing the facility to carry out the above work.