Introduction
The significance of the "epidemic" of global obesity, the resultant pathologies that develop, and their collective impact on health, well-being, and quality of life cannot be overestimated. Obesity and its related diseases are the leading cause of death in Western society. Barker and others have demonstrated the marked risk for adult metabolic syndrome (e.g., obesity, hypertension, and type II diabetes) in relation to birth weight, Reference Barker, Osmond and Law1-Reference Desai and Hales3 and studies throughout the world have provided evidence that low birth weight (LBW) infants who undergo rapid postnatal catch-up growth are at the highest risk of metabolic syndrome (i.e., “thrifty phenotype hypothesis”). Reference Nobili, Alisi, Panera and Agostoni4
Animal studies from baboons, Reference Parlee and MacDougald5,Reference Tchoukalova, Krishnapuram and White6 sheep, Reference Bispham, Gopalakrishnan and Dandrea7,Reference Ford, Hess and Schwope8 and rodents Reference Desai, Gayle, Babu and Ross9,Reference Ramírez-López, Vázquez and Bindila10 have generally replicated human evidence of programmed obesity, with the finding that LBW infants are at markedly increased risk of childhood and adult obesity. Reference Desai, Gayle, Babu and Ross9,Reference Bieswal, Ahn and Reusens11 Our laboratory has demonstrated that maternal 50% caloric or food restriction (FR) diet during pregnancy results in (LBW) pups which demonstrate significantly increased food intake with rapid catch-up growth and adult obesity. Reference Desai, Gayle, Babu and Ross9 The obese phenotype is a result of dysfunction at several levels of the appetite/satiety pathway, as evidenced by reduced satiety responses to both leptin and sibutramine, Reference Desai, Gayle, Han and Ross12 impaired arcuate nucleus signaling responses, and increased cellular responses to ghrelin. Reference Yousheng, Nguyen, Desai and Ross13 Compounding increased food intake, LBW offspring demonstrate enhanced adipogenic and lipogenic potential Reference Yee, Lee and Ross14,Reference Desai, Guang, Ferelli, Kallichanda and Lane15 and increased de novo synthesis in both subcutaneous fat and visceral fat. Reference Yee, Han, Vega, Lee, Ross and Desai16
Mouse models of maternal FR mimics that of the rat. Reference Sutton, Centanni and Butler17,Reference Yura, Itoh and Sagawa18 Due to the differences in basal metabolic rate (BMR) and the large surface area to mass ratio, the mouse has significantly greater exchange of heat with the environment as compared to the rat or human. Reference Ganeshan and Chawla19,Reference Škop, Guo and Liu20 In the majority of these studies, the housing of mice has commonly utilized a thermal environment well below the mouse thermoneutral temperature. In part, this has resulted from earlier studies in rats, which have a lower thermoneutral temperature, as well as the human comfort zone of temperature for laboratories. Thus, these studies have resulted in animal experiments of cold, stressed mice. Evidence indicates that mice maintained at sub-thermoneutral temperatures are hypermetabolic, hypertensive, sleep-deprived, and obesity resistant as compared with mice housed at thermoneutrality. Reference Ganeshan and Chawla19 Numerous studies have demonstrated effects of elevated or reduced environmental temperature on food/energy intake, energy expenditure, and/or the development of obesity in both animal models and humans. Reference Clayton and McCurdy21-Reference van der Stelt, Hoevenaars and Široká24 Consequently, the importance of studying mouse models at a thermoneutral temperature has been emphasized.
Importantly, most studies of the impact or mechanisms of developmental programming using mouse models have housed pregnant dams, newborns, and offspring at human thermoneutral temperatures (e.g., 22°C). In the present study, we sought to examine the effects of environmental temperature on the developmental programming effects of maternal FR. The results of our study indicate a significant impact of utilizing a species-specific thermoneutral temperature for metabolic mouse experimental designs and developmental programming studies.
Methods
Ethical approval
Studies were approved by the Animal Care and Use Committee of The Lundquist Institute at Harbor–University of California, Los Angeles, and were in accordance with the American Association for Accreditation of Laboratory Care and National Institutes of Health guidelines. Animals were housed in a facility at two different room temperatures (conventional cold exposed; CE 22°C and thermoneutrality; TN 30°C) with regulated humidity and a controlled 12:12-h light/dark cycle.
Maternal diet
A mice maternal undernutrition model was used to produce LBW newborns. First-time pregnant C57BL/6J mice at gestational age e7 d were obtained from Jackson Laboratory. Upon arrival at the animal facility, N = 12 mice were housed at 22°C (CE) and N = 12 were housed at 30°C (TN) room temperature. At e10, one-half of each group (N = 6) were 30% FR and one-half (N = 6) were fed ad libitum (Control) in each room. The respective diet was fed till the end of delivery after which all maternal mice were fed ad libitum diet. Following birth at day 1 (p1) of age, litter size was culled to three males and three females (average litter size of C57BL/6J mice is 6 Reference Hicks, Roche, Wilkerson and Lindstrom25 ), and maternal mice continued to nurse their own pups. The adjustment of litter size was to ensure standardized nursing in each case and to control for differences in maternal care. Reference August, Rodrigues, Klein, Dos Santos and Matté26,Reference Enes-Marques and Giusti-Paiva27 Rodent studies using litter size manipulation have shown the long-term impact on offspring adiposity and metabolism, largely as a result of milk availability during the nursing period. Pups raised in small (3–4) and large (10–12) litter size represent a model of overnutrition and undernutrition, respectively, as compared to normal (6–8) litter size. Reference Marangon, Mecawi, Antunes-Rodrigues and Elias28,Reference Parra-Vargas, Ramon-Krauel, Lerin and Jimenez-Chillaron29
Offspring
The newborns were nursed by the same mother till 3 weeks of age after which males and females from each litter were separated and housed individually Reference Nagy, Krzywanski, Li, Meleth and Desmond30 and weaned to normal ad libitum (Control) diet till 6 months of age. The offspring continued to be housed at similar temperatures as their mothers.
Study groups
Males and females from a total of four groups (Control and FR housed at CE or TN) were studied.
Body weights and food intake
Daily maternal body weight and food intake were recorded throughout pregnancy and lactation. The offspring body weight after birth at 1 d (p1) was recorded according to sex, and subsequent weights were taken at 7, 14, and 21 d of age. Thereafter, the body weight and food intake were monitored weekly on individual basis. Food intake was measured daily by providing a weighed amount every morning and after 24 h, weighing the amount of food remaining, including any on the bottom of the cages. Intake was calculated as the weight (in grams) of food provided less that recovered and average obtained for the week.
Body composition
At 6 months of age, randomly selected six males and six females from six litters in each group underwent a noninvasive dual-energy X-ray absorptiometry (DEXA) scanning using the DXA system with software program for small animal (QDR 4500A, Hologic, Bedford, MA, USA). Offspring were anesthetized using ketamine and xylazine (90 mg/kg and 10 mg/kg ip, respectively) and placed in a microisolator cage with warm water bottles to avoid hypothermia. An in vivo scan of whole body composition was obtained, including fat and lean tissue mass, including quantification of body fat and lean percentage.
Glucose tolerance test
Following 48-h recovery, the same animals (i.e., six males and six females from six litters and dietary regimen) were fasted overnight and underwent a glucose tolerance test (GTT) as follows. After an overnight fast, d-glucose (1 mg/g body weight) was injected intraperitoneally in conscious mice. Blood was taken from tail vein prior to (time 0) and 15, 30, 60, 120, and 180 min after glucose injection. Blood glucose was determined using a B-Glucose Analyzer (HemoCue, Mission Viejo, CA).
Tissue retrieval
Following 48-h recovery, offspring were euthanized by inhalation of isoflurane (5% in chamber and 2% via mask) followed by exsanguination via cardiac puncture and decapitation. Subcutaneous (non-visceral) and retroperitoneal (visceral) adipose tissue and brain were collected.
Adipose tissue analysis
Subcutaneous and retroperitoneal tissues were fixed in 4% buffered paraformaldehyde, stored at 4°C for 24 h and then transferred to 25% sucrose solution. Fixed tissues were placed in histology cassettes (CA95029-822, CA18000-174; VWR International, Radnor, PA) in Paraplast Tissue Embedding Medium (1006, Sigma-Aldrich, St. Louis, MO) and processed (Leica ASP 300 Paraffin Tissue Processor, Leica Microbiosystem, Wetzlar, Germany).
5-µm thickness adipose tissue sections were obtained (microtome; Accu-Edge, Sakura Finetek, Torrance, CA) and stained with hematoxylin and eosin (6765010, Thermo Scientific, MA; 8668-16, Avantor Performance Materials, PA) and mounted using Permount (8310-16, Thermo Scientific, MA). Images were captured (20x; Leica DM RBE microscope with digital camera (Hitachi HVC2OM) and analyzed using Image J software. In case of total cells were counted in a fixed area and for each sample, five separate sections were counted and the average count obtained.
Hypothalamic arcuate nucleus (ARC) analysis
Microdissection ARC was undertaken as previously described. Briefly, the area adjacent to the bottom of the third ventricle was dissected parallel to the border of the ventricle using the fornix and third ventricle as landmarks.
Protein was extracted and expression determined by western blot as previously reported by our group. Reference Desai, Li and Ross31 Antibodies used were AgRP (1:500, 14kd, sc-50299, Santa Cruz, CA) and POMC (1:500, 30kd, sc-20148). All values were normalized to GAPDH (37kd, 1:10,000, MAB374, Millipore, Billerica, MA) and presented as fold change.
Statistics
NCSS statistical software was used for data analysis. Differences between FR and the Controls were compared using repeated ANOVA (body weights and food intake) and multi-ANOVA. The effects of interaction (maternal diet and housing temperature) were assessed using two-way ANOVA. Effects of the significant interaction were further analyzed using Tukey’s HSD post hoc tests. The dam represented the experimental number studied as one offspring of each sex from each litter was used in the analyses.
Results
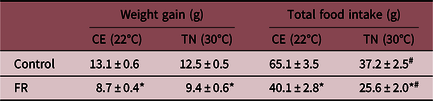
Consistent with FR, the FR dams gained significantly less weight than the Control dams whether housed at TN or CE temperature. Notably, the housing temperature did not impact the weight gain of FR and Control dams despite a significant reduction in food intake when housed at TN as compared to CE temperature (Table 1). The length of gestation (20 ± 1), litter size, and sex distribution were similar between TN and CE groups.
Maternal weight gain and food intake during pregnancy

Weight gain and food intake of Control and FR (food-restricted) dams from gestational age e10 to e20 (term) housed at conventional (CE 22°C) and thermoneutrality (TN 30°C) temperature. Values are mean ±SE; * p < 0.001 FR vs Control; #TN vs CE.
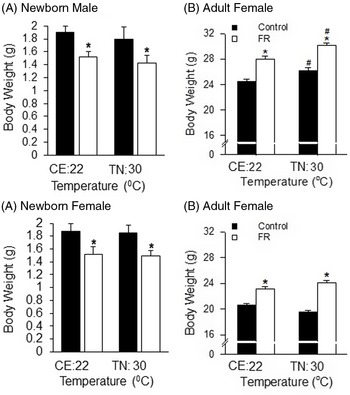
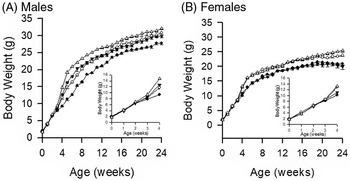
As expected, newborn FR offspring were significantly smaller than those of Control dams (Fig. 1a). Further, body weight of TN-exposed newborns was comparable to that of CE newborns for both Control and FR dams. No sex difference was seen in birth weight between FR and Controls newborns for TN and CE groups. Despite weighing less at birth, FR male and female offspring were significantly heavier than Control males at 24 weeks of age for both CE and TN groups. Among both FR and Controls, TN males were significantly larger than CE males, though there were no differences among TN and CE females (Fig. 1b). Inspection of the body weight increase reveals similar weight gain during nursing among the four groups among males (Fig. 2a inset). With weaning, FR/TN males demonstrated a body weight surge that persisted through 24 weeks, while Control/CE males had the slowest rate of growth. Female offspring similarly demonstrated an increased growth rate among FR offspring beginning at 4 weeks and continuing through adulthood, though there was no significant difference between female TN and CE growth rates (Fig. 2b).
Body weights of offspring: Mean body weight of male and female newborns (A) and adult male and female offspring at 24 weeks of age (B) from Control ( ) and FR (
 ) groups housed at CE:22°C and TN:30°C. Number of offspring studied per group at birth 18 males and 18 females from 6 litters (3 per litter) and 12 males and 12 females from 6 litters (2 per litter) at 24 weeks of age. *P < 0.01: FR vs Control; #P < 0.05: TN:30°C vs CE:22°C temperature.

Growth of offspring: Mean body weights of male (A) and female (B) offspring from birth to 24 weeks of age in Control group housed at temperatures CE:22°C (●) and TN:30°C (▼); FR group housed at CE:22°C (○) and TN:30°C (∆). Number of offspring studied per group 12 males and 12 females from 6 litters (2 per litter). Insets: body weights of male and female offspring from 0 to 4 weeks of age. FR vs Control group: P < 0.001 for males and females at both temperatures from 4 to 24 weeks of age. TN:30°C vs CE:22°C temperature: P < 0.001 for males from 4 to 24 weeks of age.

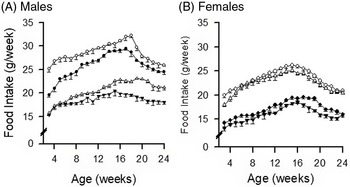
Food intake appeared to contribute significantly to the male and female growth increase among FR offspring. The food intake among FR males (TN and CE) was significantly (25-50%) greater than Control (TN and CE) (Fig. 3a, b) Although TN demonstrated a greater body weight vs CE, there was markedly less food intake among TN (Control and FR) as compared to CE (Control and FR) indicating that the food intake increase was insufficient to account for the increased weight gain associated with CE. Among females, there was increased food intake associated with FR groups, though no effect of temperature.
Food intake of offspring: Post-weaning mean food of male (A) and female (B) offspring from 3 to 24 weeks of age in Control housed at CE:22°C (●) and TN:30°C (▼); FR housed at CE:22°C (○) and TN:30°C (∆). Number of offspring studied per group 12 males and 12 females from 6 litters (2 per litter). FR vs Control group: P < 0.001 for males and females at CE:22°C from 4 to 24 weeks of age; at TN:30°C for males from 8 to 24 weeks and for females from 4 to 24 weeks. TN:30°C vs CE:22°C temperature: # P < 0.001 for males from 4 to 24 weeks of age.

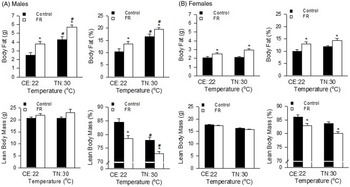
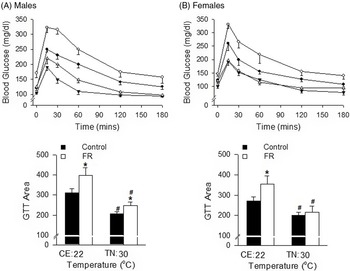
FR adult male offspring had increased body fat weight and percent body fat and reduced percent lean body mass as compared to Controls (Fig. 4a). TN males had a further increase in percent body fat and body fat weight and reduction in lean body mass percent as compared to CE males. Among females, FR offspring also had increased percent body fat and body fat weight and reduced percent lean body mass as compared to Controls (Fig. 4b). Although there was a trend toward slightly increased percent body fat and reduced lean body mass percent in TN females, these did not reach significance. Among FR and Control adults, FR males demonstrated an increased GTT area under the curve at both temperatures with FR females exhibiting the same when housed at CE. TN Control and FR offspring demonstrated reduced GTT area under the curve (Fig. 5 a, b).
Body composition of offspring: Body fat, percentage body fat, lean body mass, and percentage lean body mass of 24 weeks old males (A) and female (B) from Control () and FR () offspring housed at CE:22°C and TN:30°C. Number of offspring studied per group six males from six litters (one per litter) *P < 0.01 FR vs Control; #
P < 0.001 TN:30°C vs CE:22°C temperature.

Glucose tolerance test of offspring: Mean glucose levels and GTT area under the curve of 24 weeks old male and female offspring. Control housed at CE:22°C (●) and TN:30°C (▼); FR housed at CE:22°C (○) and TN:30°C (∆). Number of offspring studied per group six males from six litters (one per litter). *P < 0.01 FR vs Control; # P < 0.01 TN:30°C vs CE:22°C temperature.

There was a statistically significant interaction between the effects of FR and temperature on body weight, food intake, and body fat in males though not in female offspring. Hence, further measurements on adipose tissue and ARC was undertaken only in male FR and Control offspring.
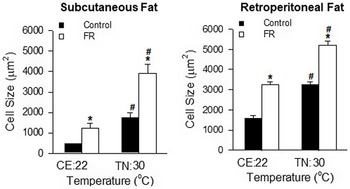
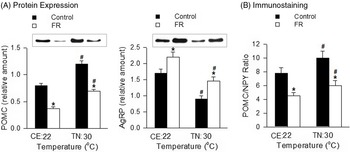
Consistent with increased adiposity, FR male subcutaneous and retroperitoneal fat demonstrated larger adipocyte size as compared to Controls, with TN significantly greater than CE groups (Fig. 6). Within the arcuate nucleus, FR offspring demonstrated reduced satiety POMC and increased appetite AgRP neuropeptide expression as compared to Controls. There was a reduced POMC expression and increased AgRP at CE as compared to TN temperatures. Thus, the appetite to satiety (AgRP/POMC) neuropeptide ratio was greater in FR vs Control offspring and greater in CE vs TN offspring, in parallel with measures of food intake (Fig. 7).
Morphology of male adipocytes: Fat size in subcutaneous and retroperitoneal adipose tissue from 24-week-old male Control () and FR () offspring housed at CE:22°C and TN:30°C. Number of offspring studied per group six males from six litters (one per litter). *P < 0.001 FR vs Control; #
P < 0.001 TN:30°C vs CE:22°C temperature.

Arcuate nucleus protein expression in male offspring: Protein expression of neuropeptides (A) and ARC sections (5 µm) immunostained for POMC and NPY (B) in 24-week-old male Control () and FR () offspring housed at CE:22°C and TN:30°C. Number of offspring studied per group six males from six litters (one per litter). *P < 0.001 FR vs Control; #
P < 0.001 TN:30°C vs CE:22°C temperature.

Discussion
The results of this study demonstrate marked effects of environmental temperature neutrality on the developmental programming of offspring body habitus and food intake. Whereas laboratory environments and humans are thermoneutral and typically comfortable at 22°C, this temperature evokes thermogenic responses in offspring mice. Reference Bastías-Pérez, Zagmutt, Soler-Vázquez, Serra, Mera and Herrero32 These responses may be further exacerbated in LBW offspring impacting on the conclusions of laboratory studies, and of relevance to humans birthing and living in cold environments.
Maternal diet
Physiological adaptations in food intake, energy expenditure, insulin sensitivity, lipid metabolism, and fat accrual occur during normal pregnancy, and these are impacted by housing temperature which could subsequently impact on growth and development of the offspring. Reference Herrera33,Reference Olivier, Reinders and Clarke34 As expected, the FR dams during pregnancy gained significantly less weight than the Control dams. However, the weight gain of both dams was not influenced by temperature despite a significant reduction in food intake when housed at TN as compared to CE temperature. These findings are consistent with previous study on male mice raised at 22°C (CE) and 30°C (TN) on a chow diet. The paradox is likely due to decreased expression of thermogenic program in both brown and white fat depots in mice at TN. Reference Cui, Nguyen and Zarebidaki22 Studies show reduction in UCP1 and inactive or dormant state of brown adipose tissue due to decreased demand for thermogenesis at thermoneutrality. Reference Abelenda and Puerta35-Reference Ghosh, Park and Lee37 Notably, when pair fed with chow diet or fed a high-fat diet, TE housed mice showed an increase in body weight and adiposity. Reference Cui, Nguyen and Zarebidaki22,Reference Albustanji, Perez and AlHarethi36 However, it is likely that Controls at TN are relatively malnourished which may explain the differences in phenotype between the offspring of the two Control groups as discussed below.
FR vs controls
Among both CE and TN males and females, FR offspring were significantly heavier than Controls as adults, despite being born of lower body weight. The increased growth was most marked immediately following weaning (3 weeks) in both females and males and continued through 8 weeks of age in females and 12 weeks of age in males. A parallel pattern of increased FR food intake was evident with the absolute amount of food intake remaining greater in FR vs controls throughout the 6-month study. Our prior studies demonstrated increased food intake among FR as compared to Controls in association with enhanced orexigenic peptides in the hypothalamic arcuate nucleus.12 The demonstration of increased AgRP peptide and decreased POMC peptide in FR adults suggests that the enhanced food intake, and perhaps weight gain, is a result of programmed hyperphagia. Notably, food intake decreased markedly at ∼16 weeks of age in all groups, though all except for Control females continued to gain body weight. These findings suggest a dramatic decrease in BMR at 16 weeks. Future studies will examine energy utilization and consumption at this transition period.
As previously demonstrated, the increased weight of FR offspring was primarily attributable to an increase in absolute and % body fat as absolute lean body mass remained unchanged in males and females. As confirmed in males, the increase in both subcutaneous and retroperitoneal fat mass was due in part to increased cell size, a result of enhanced adipogenesis. Reference Desai, Guang, Ferelli, Kallichanda and Lane15 Consistent with the increased fat mass Reference Bowe, Franklin, Hauge-Evans, King, Persaud and Jones38,Reference Desai, Gayle, Babu and Ross39 in FR males and females, the GTT area under the curve increased in FR offspring, except for FR/TN females which had comparable GTT area under the curve as Control/TN females.
TN vs CE
Maternal dams CE and TN environment and postnatal temperature conditions increased offspring adult body weight in both FR and Control animals. TN of FR offspring resulted in a markedly accelerated rate of early-life growth. As nesting behavior and activity levels have been shown to be dependent on the housing temperature, Reference Gaskill, Gordon, Pajor, Lucas, Davis and Garner40,Reference Shelton and Alberts41 it is plausible that these factors may have led to CE and TN pups being maintained at similar temperature. The reduced growth rate of CE males from weaning to 12 weeks may be a consequence of the increased caloric requirements of the CE environment in early-life mice with relatively increased surface area to body weight. Increased food intake was evidenced in both CE males and females, though the effect size was significantly greater in males. Thus, despite the relative increase in food intake among CE males, the weight disparity as adults suggests that male energy consumption in the CE environment was markedly enhanced compared to females. The female adult weight difference between Control and FR was reduced at CE as compared to TN. Thus, experimental studies performed under CE conditions may underrepresent the magnitude of developmental programming effects.
Studies show that mice at thermoneutrality have greater metabolic efficiency Reference Feldmann, Golozoubova, Cannon and Nedergaard42 and exhibit ∼50% reduction in energy expenditure Reference Ganeshan and Chawla19,Reference Ravussin, LeDuc, Watanabe and Leibel23 as compared to mice exposed to cold conditions leading to increased adiposity and obesity at thermoneutrality. Effects on adiposity programming was further evidence of the importance of TN. Body fat was markedly increased and lean mass reduced in both FR and Control males at TN. Consistent with this, Ghosh et al showed that housing temperature of pregnant mice can modulate transcriptome of fetal brown adipose tissue toward promoting fetal brown adipogenesis and suppressing the myogenic lineage. Reference Ghosh, Park and Lee37 Sex effects were notable as there was no significant impact of TN vs CE on female offspring body composition. Adipocyte size was dramatically impacted by TN, and the magnitude of the FR effect increased in subcutaneous fat. Although we did not measure the adipose tissue cell size in female offspring, we speculate that these changes did not occur, as there was no change in body fat mass with TN vs CE. The CE environment resulted in increased POMC and reduced AgRP peptide expression in both Control and FR pups suggesting a reduced food intake drive for TN caloric requirements. Lastly, the TN environment reduced the impact of FR on GTT area of males and negated the effect in females. These findings are consistent with reported studies that show, lower fasting glucose, Reference Clayton and McCurdy21 reduced GTT area Reference Raun, Henriquez-Olguín and Karavaeva43 and absence of insulin resistance Reference Tian, Ganeshan and Hong44 in mice housed at TN despite increased adiposity. The sex-specific effects of temperature are consistent with reported higher prevalence, mass and activity of thermogenic adipose tissue infemales, Reference Cypess, Lehman and Williams45 and rodent studies demonstrating sex-specific adipose metabolism which may ultimately contribute to differences in systemic and substrate metabolism. Reference Keuper and Jastroch46 Also sex hormones such as estrogen, which play a role in thermoregulation and fat metabolism, may contribute to the sex-specific effects. Reference Rodríguez-Cuenca, Monjo, Gianotti, Proenza and Roca47 Additionally, thermoneutral zone can be dynamically modulated by age, body composition, locomotor activity, pregnancy, and lactation. Reference Bastías-Pérez, Zagmutt, Soler-Vázquez, Serra, Mera and Herrero32 Although, the housing temperature did not impact the length of gestation, litter size, and sex distribution in the current study, future studies that specifically address their effects on postnatal growth and milk production in mice housed at TN and CE temperatures are needed to clarify their influence on hypothalamic development.
These results confirm the developmental programming effects of maternal FR though with important sex-dependent effects illustrating a greater impact among males. The thermogenic environment resulted in marked changes in outcome measures, blunting some differences between FR and Control among some factors and enhancing differences among others. As illustrated in the present study, adult male offspring had modest differences in body weights at CE vs TN, though there were marked adverse effects on body fat and lean body mass though beneficial effects on the GTT area in the TN environment. A measure of body weight alone may not correlate with body fat mass nor predict GTT results. These findings are of scientific importance. Both nutritional deficiencies and obesity consequences are apparent in habitants of extreme climate regions including cold environments Reference Broderstad, Hansen and Melhus48,Reference Kozlov, Vershubskaya and Lyudinina49 as well as warmer regions such as the Pacific islands. Reference Vogliano, Raneri, Maelaua, Coad, Wham and Burlingame50 Nonetheless, humans modify their behavior to maintain thermoneutrality, reinforcing the need for caution in extrapolating metabolic outcomes in mice model to humans, especially when mice are housed outside of thermoneutral zone conditions.
Acknowledgments
We acknowledge Guang Han for technical assistance.
Financial Support
This work was supported by the National Institutes of Health Grants R01HD099813 (MD, MGR) and NIMHD 5U54MD007598-06 (MGF).
Conflicts of Interest
None.