
I. INTRODUCTION
It has been increasingly urgent to develop clean renewable energies and efficient energy storage devices due to the shortage of conventional fossil fuels and environmental pollution. Electrochemical capacitors (also known as supercapacitors or ultracapacitors), are a kind of important energy-storage devices that exhibit much higher power densities, faster charge/discharge rates, better reversibility, and super-long cycle life, when compared with other energy storage systems such as batteries.Reference Yu, Zhao, Feng, Hu, Zhang, Zeng, Tong and Lu1–Reference Zhai, Lu, Wang, Wang, Mathis, Liu, Li, Tong and Li5 Supercapacitors (SCs) have attracted numerous attentions as a priority candidate of energy storage devices. The performance of SCs is closely related to the properties of the electrode materials. Several kinds of materials have been used as electrodes for SCs, such as carbon-based materials,Reference Yu, Lin, Feng, Zeng, Tong and Lu6–Reference Zhang, Lin, Zhai, Nie, Zhou and Zhuo10 transition metal oxides (MnO2, RuO2, Co3O4, and NiCo2O4),Reference Zhai, Wan, Sun, Chen, Sun, Xia and Xia4,Reference Zhai, Lu, Wang, Wang, Mathis, Liu, Li, Tong and Li5 hydroxides and conducting polymers (polyaniline, polypyrrole, and polythiophene), and their composites.Reference Li, Li, Zhao, Xu and Zhang8 Among these materials, carbon-based materials such as activated carbon, carbon nanotubes, carbon fibers, and graphene et al. have been widely used as active materials or frameworks for SCs, for their notable features of inexpensive, high surface area, good conductivity, and outstanding chemical stability.Reference Yu, Lin, Feng, Zeng, Tong and Lu6–Reference Zhang, Lin, Zhai, Nie, Zhou and Zhuo10 Among various carbon-based materials, three-dimension graphene-based framework (3DGF) materials including aerosol,Reference Kim, Oh and Islam11–Reference Wu, Winter, Chen, Sun, Turchanin, Feng and Müllen14 hydrosol,Reference Xu, Sheng, Li and Shi15–Reference Xu, Lin, Huang, Liu, Huang and Duan17 and foamReference Cao, Shi, Shi, Lu, Huang, Yan, Zhang and Zhang18–Reference Lv, Zhang, Cheng, Zhao, Zhang, Shi and Qu21 have been regarded as emerging materials for SCs due to their unique characteristics such as outstanding electrical properties, ultrahigh theoretical specific surface area, and a well-interconnected microporous structure which allows access and fast diffusion of ions and molecules.Reference Wang, Shi, Fan, Ge, Yin and Hu22–Reference Li, Hu, Yu, Wang, Zhao, Liu, Tong and Lu26 However, the capacity of 3DGFs only generates from the double layer capacitance, which is not yet satisfactory for the requirement of practical applications. The incorporation of heteroatoms, such as nitrogen onto the 3DGFs has been developed as one of the important strategies to boost their specific capacitance.Reference Wu, Winter, Chen, Sun, Turchanin, Feng and Müllen14,Reference Chen, Yang, Li, Wang, Xiao, Qian and Yu16,Reference Wang, Wei, Nie and Zhang24,Reference Song, Lin, Rong, Wang, Xie and Chen27 It is proved that the introduction of nitrogen could significantly improve surface hydrophilicity as well as the electrical conductivity of 3DGFs.Reference Song, Lin, Rong, Wang, Xie and Chen27–Reference Qin, Yuan, Li, Chen, Kong, Chu, Tao and Liu30 Furthermore, the incorporation of nitrogen can increase the number of active sites on the surface of 3DGFs and contribute extra pseudocapacitance through faradaic reactions resulting in a further enhancement of its specific capacitance.Reference Chen, Yang, Li, Wang, Xiao, Qian and Yu16,Reference Wang, Wei, Nie and Zhang24,Reference Zhang, Zhao, Ji, Stoller, Lai, Murali, Mcdonnell, Cleveger, Wallace and Ruoff31,Reference Sui, Meng, Xiao, Zhao, Wei and Han32 To date, various methods have been explored to achieve the N-doping of graphene, such as chemical vapor depositionReference Wei, Liu, Wang, Zhang, Huang and Yu33,Reference Jin, Yao, Kittrell and Tour34 arc-dischargeReference Li, Wang, Zhao, Shi, Gu and Xu35 and nitrogen plasma processReference Jafri, Rajalakshmi and Ramaprabhu36,Reference Jeong, Lee, Shin, Choi, Shin, Kang and Choi37 et al. Recently, the hydrothermal process combined with calcination or freeze-drying technique has been widely used to prepare 3D nitrogen-doped graphene frameworks (3DNGFs).Reference Chen, Yang, Li, Wang, Xiao, Qian and Yu16,Reference Wang, Wei, Nie and Zhang24,Reference Wang, Wang, Wu, Xia, Zhao and Jia29,Reference Qin, Yuan, Li, Chen, Kong, Chu, Tao and Liu30 For instance, Wang et al.Reference Wang, Wei, Nie and Zhang24 reported a graphene hydrogel prepared by the hydrothermal reaction of graphene oxide (GO) and formamide at 180 °C for 12 h. After freeze-drying, these graphene hydrogels with a controlled pore structure showed a remarkable enhancement in its supercapacitor performance.Reference Wang, Wei, Nie and Zhang24 Similarly, 3DNGFs were obtained via GO crosslinks with melamine and formaldehyde at 180 °C for 12 h, followed by calcination at 750 °C for 5 h under N2 atmosphere.Reference Qin, Yuan, Li, Chen, Kong, Chu, Tao and Liu30 Nevertheless, two challenges remain. First, most of the current strategies involve the usage of GO powder, which is of a relatively high cost or is time consuming to be prepared. Secondly, the developed approaches are complicated manipulations and instrumentations, which could hinder their large-scale application.
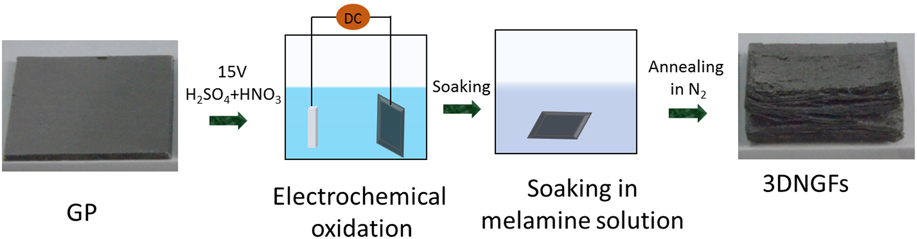
In this work, we report a new, green, simple and cost-effective strategy for the massive preparation of monolithic 3DNGFs from inexpensive graphic paper (GP). The 3DNGFs were prepared by the direct electrochemical exfoliation of GP with a voltage of 15 V for 20 min in the mixed solution which contained 1:1 (V:V) H2SO4 and HNO3, then soaking in melamine solution for 30 min, and finally annealing under a nitrogen atmosphere for 3 h. Compared with the conventional process for hydrogel preparation, our synthetic method has some significant advantages: (i) low cost by directly using abundantly available and inherent inexpensive GP; (ii) environmentally friendly as the mixed acid and the melamine solution is reusable; (iii) the procedure is simple, time saving, and easy for scale-up applications. Significantly, with the well-exfoliated 3D N-doped graphene structure, high specific surface area, high porosity, superior electricity conductivity, and the proper nitrogen content, the 3DNGFs electrode can deliver a high specific capacitance of 2250.3 mF/cm2 at a current density of 4 mA/cm2, which is 6.3 times higher than that of pristine GP. Moreover such a unique 3DNGFs electrode also exhibits an excellent cycling ability of almost no capacitance decay after 10,000 cycles.
II. EXPERIMENTAL SECTION
A. Reagents and materials
All reagents, including H2SO4, HNO3, and melamine were of analytical grade. They were purchased from the Chinese firm (Guangzhou Chemical Reagent Factory, Guangzhou, China) and were used directly without any purification. Ultrapure water was used in all experiments, which was produced by Milli-Q (Merck Millipore Co., Ltd., Guyancourt, France) water purification system. The GP was purchased from the Shanghai carbon factory of China. High purity N2 (99.99%) gas was purchased from Dongguan Special Gas Co., Ltd. of China (Dongguan, China). The Pt wire electrode and saturated calomel electrode (SCE) used in those electrochemical tests were purchased from Tianjin Ada Heng Sheng Technology Development Co., Ltd (Tianjin, China).
B. Preparation of 3DGFs and 3DNGFs
Preparation of 3DNGFs: Firstly, the commercial GP was cleaned by ultrasonication with acetone, absolute alcohol, and ultrapure water in turn to remove impurities. After preliminary treatment, the GP was dried in an air-dry oven at 60 °C and then cut into 3 × 5 cm rectangles. Secondly, the as-cleaned GP was electrochemically oxidized for 20 min in a two-electrode cell (with platinum wire as the counter electrode) in an acid mixture with H2SO4 and HNO3 (V:V = 1:1) and under a constant voltage of 15 V, at room temperature to obtain 3DGOFs, which were then washed with ultrapure water. Thirdly, the as-obtained 3DGOFs were soaked in the saturated melamine solution at 80 °C for 30 min. Finally, the 3DGOFs contained with melamine was dried at 60 °C for 12 h in a drying oven and then annealed in a tubular furnace under a nitrogen atmosphere for 3 h. The annealing temperature was 700, 800, 900, and 1000 °C (rate: 5 °C/min), respectively. For a comparative study, the 3DGFs without nitrogen-doping were obtained by directly annealing the as-obtained dried 3DGOFs in a nitrogen atmosphere at 900 °C for 3 h.
C. Physical characterization
X-ray diffractometry (XRD) was conducted to examine the microcrystal character of the as-prepared GP, 3DGFs, and 3DNGFs samples on a D8 ADVANCE X-ray Diffractometer (Bruker AXS GmbH, Karlsruhe, Germany) under the following operating conditions: 40 kV and 40 mA with Cu Kα radiation at λ 1.54 Å, over a 2θ angle range of 5–80°. The surface-chemistry properties, functional group distribution, and composition of different samples were determined by X-ray photoelectron spectroscopy (XPS) with an ESCALAB 250Xi XPS system (Thermo Fisher Scientific Inc., Waltham, MA). Both the wide survey spectra and core-level spectra of C 1s and N 1s were collected, and the C 1s hydrocarbon peak at a binding energy of 284.8 eV was used to calibrate the binding energies. Raman spectra were collected using a Renishaw InVia Raman microscope (Renishaw plc, Wotton-underEdge, U.K.) at an excitation laser wave length of 514 nm. The microstructure and morphology of the materials were observed by field emission scanning electron microscopy (FESEM) (JSM-6330F, Hitachi Ltd., Tokyo, Japan). The transmission electron microscopy (TEM) and high-resolution TEM (HRTEM) images were recorded with a FEI Tecnai G2 F30 TEM (FEI Co. Ltd, Eindhoven, the Netherlands) using 250 kV electron beam. To obtain the structural properties, such as Brunauer–Emmett–Teller (BET) surface areas, total pore volumes, and pore size distribution of the samples, we collected the nitrogen adsorption/desorption isotherms at 77 K with a Micromeritics ASAP 2020M analyzer (Micromeritics Instrument Corp., Norcross, Georgia).
D. Electrochemical measurements
The electrochemical studies of GP, 3DGFs, and 3DNGFs electrodes were performed in a conventional three-electrode cell with Pt as the counter electrode and SCE as the reference electrode, with a 1 M H2SO4 aqueous solution as the electrolyte at room temperature. Meanwhile, the GP, 3DGFs, and 3DNGFs were cut into a suitable size of 2 × 0.5 cm and directly used as the working electrodes. Cyclic voltammetry (CV), galvanostatic charge/discharge (GCD), and electrochemical impedance spectroscopy (EIS) measurements were carried out in the CHI 760 electrochemical workstation (Shanghai Chenhua Instrument Co., Ltd., Shanghai, China). The CV tests were performed in a potential window between 0 and 1 V, with a scan rate of 5–100 mV/s. The GCD tests were carried out with current densities of 4–12 mA/cm2 (0–1 V). The EIS tests were carried out in the frequency range of 0.01–105 Hz with an amplitude of 5 mV, referring to the open circuit potential.
The specific capacitances of the samples were calculated from the CV curves based on the following equation:
 $${C_{\rm{a}}} = {Q \over {\Delta U \times S}}\quad ,$$
where C a is the areal capacitance (F/cm2), Q (C) is the average charge during the charging and discharging process, ΔU is the potential window (V), and S (cm2) is the area of the working electrode.
Alternatively, areal capacitances of the electrodes were measured by the GCD method according to the following formula:
 $${C_{\rm{a}}} = {{I \times \Delta t} \over {\Delta U \times S}}\;\quad ,$$
where C a is the areal capacitance (F/cm2), I (A) is the constant discharging current, Δt is the discharging time (s), ΔU is the potential window (V), and S (cmReference Wang and Lee2) is the area of the working electrode.
III. RESULTS AND DISCUSSION
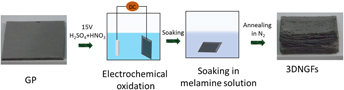
The synthetic procedures of porous 3DNGFs are illustrated in Fig. 1. Firstly, commercial GP was electrochemically oxidized in a mixed HNO3–H2SO4 solution at a potential of 15 V for 20 min to obtain 3D graphene oxide frameworks (3DGOFs). Then the as-prepared 3DGOFs were soaking in melamine solution and dried in an oven. Finally, the as-obtained 3DGOFs were annealed in N2 at 900 °C (See Sec. II) to simultaneously achieve N-doping and reduction (recorded as 3DNGFs-900). For comparison, as-prepared 3DGOFs were directly annealed at 900 °C with N2 as the protective gas to obtain the undoped 3DGFs.
Schematic illustration of the synthetic procedures of 3DNGFs.

The digital image [inset of Figs. 2(a) and 2(b)] displays that mechanically robust, interconnected porous monolithic 3D N-doped graphene frameworks (3DNGF) were obtained, and its volume was 6–7 times larger than that of the pristine GP. The morphology and structure of the as-prepared 3DNGFs-900 was first surveyed by scanning electron microscopy [Figs. 2(a) and 2(b)]. Interestingly, in contrast to the compact and smooth surface of GP, the 3DNGFs-900 shows twisted and transparent nanosheets crimped randomly to form a porous network structure, which results in a high surface area. Additionally, the SEM and digital images of the as-prepared 3DGFs sample without nitrogen doping were also presented in Fig. S1. It is showed in the digital images that there are no obvious differences between the 3DGFs and 3DNGFs-900 samples. Similarly, on the surface of 3DGFs, typical wrinkled graphene composed of layered platelets can be easily observed. These results indicate that the morphology of the 3DGFs has not been changed with the doping of nitrogen. To further investigate the quality and detailed microstructure of the 3DNGFs-900, TEM was carried out. Figure S2(a) indicates that the GP sample was smooth and thick that included many graphite flakes. Similarly, HRTEM [Fig. 2(c)] images reveal that it consists of a dozen of stacked graphite plates, which is also reflected in its overlapping SAED diffraction points [Fig. S2(b)]. In contrast, relatively rough and sheet-like structures on the edge 3DNGFs-900 sample can be observed [Fig. S2(c)]. The HTREM [Fig. 2(d)] image results confirm that the sheets are composed of a few layers of graphene, indicating that the bulk graphite has been well exfoliated into graphene sheets. Additionally, the bright spots [Fig. S2(d)] in a hexagonal pattern can be identified in its SAED patterns suggesting the high quality of the obtained graphene products.
SEM images of (a) GP, (b) 3DNGFs-900, and the insets are the corresponding digital images. High-resolution TEM (HRTEM) images collected at the edge of (c) GP, and (d) 3DNGFs-900.

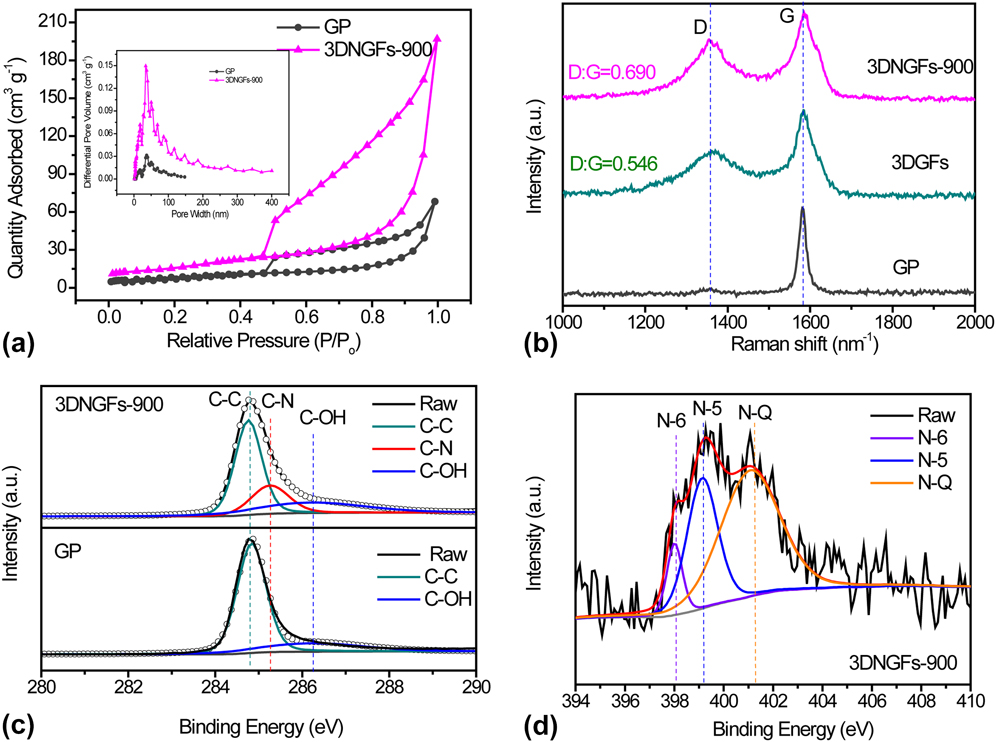
The surface area and the porosity of the material are always related to high specific capacitance. Therefore, the nitrogen adsorption–desorption measurement was performed to evaluate the variation of the surface area and the porous structure of the 3DNGFs-900 sample. As shown in Fig. 3(a), both the nitrogen adsorption–desorption isotherms of GP and 3DNGFs-900 show a typical type IV hysteresis loop, which is characteristic of mesoporous materials.Reference Li, Liang, Li and He38,Reference Wen, Zhang, Yan, Zhang and Shi39 The hysteresis loop appeared at the lower relative pressure of 0.4–0.8 which indicates the presence of mesopores, while at a higher relative pressure of 0.8–1, it is attributed to macropores.Reference Wen, Zhang, Yan, Zhang and Shi39 As observed in Fig. 3(a), there are noticeable differences in the shape of the nitrogen sorption isotherms between the GP and 3DNGFs-900 samples. For the 3DNGFs-900 sample, the isotherms become increasingly steeper than that of the GP in the range of the relative pressure beyond 0.45 and up to 1. These phenomena indicate that numerous mesopores and macropores were created by the electrochemical oxidation process. The calculated BET surface area of 3DNGFs-900 achieved 181.98 m2/g, which is 3 times larger than that of the pristine GP (59.75 m2/g), demonstrating that the electrochemical exfoliation could remarkably increase the specific surface area. Significantly, as shown in the pore volume and pore size distribution diagram [Inset in Fig. 3(a)], a drastic increase of micropores (<2 nm) and mesopores (2–50 nm) can easily be recognized for the 3DGNGFs-900 sample, with the total volume reached 0.102 m−3/g, which is 4.8 times larger than that of GP (0.021 m−3/g). The presence of the micropores (<2 nm) could be helpful for the improvement of double-layer capacitance, while mesopores (2–50 nm) would be benefit for ion transport and electrolyte diffusion. Besides, we also compared the adsorption–desorption isotherms and pore volume/pore width distribution plots (Fig. S3) of the 3DGFs and 3DNGFs-900 samples. As shown in Fig. S3, there is little difference between the adsorption–desorption isotherms of 3DGFs and 3DNGFs-900 samples, in which they both showed a typical type IV hysteresis loop, indicating the presence of micropores and mesopores created in the electrochemical oxidization process. Meanwhile, the pore volume/pore width distribution plots show slight differences between the results of the two samples, with an increase in mesopore (pore width at about 50–60 nm) volume for the nitrogen-doped sample. Furthermore, the calculated BET surface area for 3DGFs was 173.60 m2/g, which is a little lower than that of the nitrogen-doped sample. These may ascribe to the reason that the doping of nitrogen can prevent the stacking of graphene layers by the incorporation of nitrogen functional groups and thus result in higher specific surface area and pore volume, which can ensure more sites for charge storage during the charge/discharge process.Reference Sun, Wang, Tian, Tan, Xie, Shi, Li and Fu40,Reference Xu, Pan, Liu, Lu and Sun41
(a) Nitrogen adsorption–desorption isotherms of GP and 3DNGFs-900 at 77 K. The inset is the pore-volume distribution of GP and 3DNGFs-900. (b) Raman spectra of GP, 3DGFs, and 3DNGFs-900 samples. (c) C 1s core-level XPS spectra of upper: 3DNGFs-900 and bottom: GP. (d) N 1s core-level XPS spectra of the 3DNGFs-900 sample.

The crystal structure of GP, 3DGOFs, and 3DGNFs-900 were analyzed by XRD studies, and the results were presented in Fig. S4. For the GP sample, a sharp diffraction peak can be observed at approximately 26°, which is attributed to the (002) crystal plane of graphite (JCPDS No. 41-1487). Compared with pristine GP, 3DGOFs exhibit an additional peak at about 11° attributing to the (002) crystalline plane of graphene oxide, indicating the successful oxidation of the starting graphite (Fig. S4).Reference Chen, Zeng, Zhao, Yu, Cheng, Lu and Tong42 Meanwhile, the strong diffraction peak at 26° still existed, which means that the graphite is not fully oxidized in the 3DGOFs sample.Reference Chen, Zeng, Zhao, Yu, Cheng, Lu and Tong42 Differently, the exfoliated 3DGOFs and 3DNGFs-900 display a broader diffraction peak at 26° than GP, which implies the presence of the stacked graphene layers.Reference Chen and Xue43 Consequently, XRD results again proved that the 3DNGFs have been successful prepared by the electrochemical oxidation process.
Raman spectroscopy was used to identify the structure and doping levels of GP, 3DGFs, and 3DNGFs-900 samples. As presented in Fig. 3(b), the peak located at around 1597 cm−1 can be easily identified for all the three samples, which is attributed to the G band for the E2g vibration mode of sp2 carbon domains.Reference Wang, Wang, Wu, Xia, Zhao and Jia29 In comparison to the pristine GP, an additional peak located at 1346 cm−1 (D band) can be observed for both 3DGFs and 3DNGFs-900 samples, due to the breathing mode of k-point phonons of A1g symmetry. The appearance of D band is attributed to local defects and/or disorders.Reference Zhang, Zhao, Ji, Stoller, Lai, Murali, Mcdonnell, Cleveger, Wallace and Ruoff31,Reference Zhu, Murali, Cai, Li, Suk, Potts and Ruoff44 The intensity ratio of peak D and G (I D/I G) increases from 0.546 for 3DGFs to 0.690 for 3DGNFs-900, suggesting that more defects are formed in the 3DNGFs-900 sample. These defects are attributed to the doping of the nitrogen atom.Reference Wang, Wang, Wu, Xia, Zhao and Jia29 Besides, there is a slightly positive shift in the position of the G band for 3DNGFs-900 when compared with 3DGFs, which can be ascribed to the formation of doped graphene.Reference Zhang, Zhao, Ji, Stoller, Lai, Murali, Mcdonnell, Cleveger, Wallace and Ruoff31 It is believed that the defects arising from doping in the graphene layer may create additional active sites for charge storage.
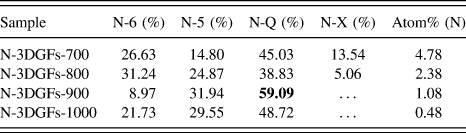
X-ray photoelectron spectroscopy (XPS) survey was further used to measure the nitrogen content and examine chemical changes caused by nitrogen doping. Figure 3(c) compares the high resolution C 1s spectra for GP and 3DNGFs-900. It is obvious that the 3DNGFs-900 sample shows a broader peak than that of GP during the same binding energies. The broad peak can be deconvoluted into three peeks, within which the two peaks at the binding energies of 284.8 and 286.1 eV are attributed to sp2 hybridized C–C and residual C–OH, respectively, which are the same with that of GP.Reference Xiao, Ding, Chen, Wang, Lu and Wang45 Significantly, when compared with GP, an additional peak at 285.2 eV arises for the 3DNGFs-900 sample due to the doping of nitrogen atoms,Reference Xiao, Ding, Chen, Wang, Lu and Wang45 demonstrating the successful doping of nitrogen species. The introduction of nitrogen species in the 3DNGFs-900 sample was further probed by high-resolution N 1s spectra [Fig. 3(d)]. As shown in Fig. 3(d), the N 1s core-level XPS spectra can be fitted with three synthetic peaks, revealing the presence of three types of nitrogen functionalities. The first peak is located at a lower binding energy of 398.2 eV correspond to pyridinic (N-6), which is defined as the nitrogen atom in a six-membered ring and contributes one p-electron to the graphene layers. The peak at 399.3 eV can be assigned to pyrrolic/pyridone (N-5) nitrogen, with two p-electrons contributing to the graphene layers. The last peak at a binding energy of 401.4 eV is attributed to quaternary (N-Q) nitrogen, with a relatively more positively charged nitrogen incorporated in a graphene layer when compared to N-6.Reference Wang, Shi, Fan, Ge, Yin and Hu22,Reference Xu, Pan, Liu, Lu and Sun41,Reference Zhu, Murali, Cai, Li, Suk, Potts and Ruoff44,Reference Gorgulho, Gonçalves, Pereira and Figueiredo46 The detailed relative concentrations of nitrogen species obtained by fitting N 1s core-level XPS spectra of the 3DNGFs-900 sample are shown in Table I. It is suggested that quaternary (N-Q) nitrogen is the dominant component (59.09%) of nitrogen for the 3DNGFs-900 sample. Previous studies have proposed that N-Q species could lead to an improvement in the electronic conductivity of graphene and consequently enhanceme the capacitance activity. Differently, weak N 1s signals were observed in high-resolution N 1s spectra for pristine GP and the 3DGFs samples, indicating that the 3DNGFs-900 sample was indeed N-doped graphene (Fig. S5).
Relative concentrations of nitrogen species obtained by fitting N 1s core-level XPS spectra.

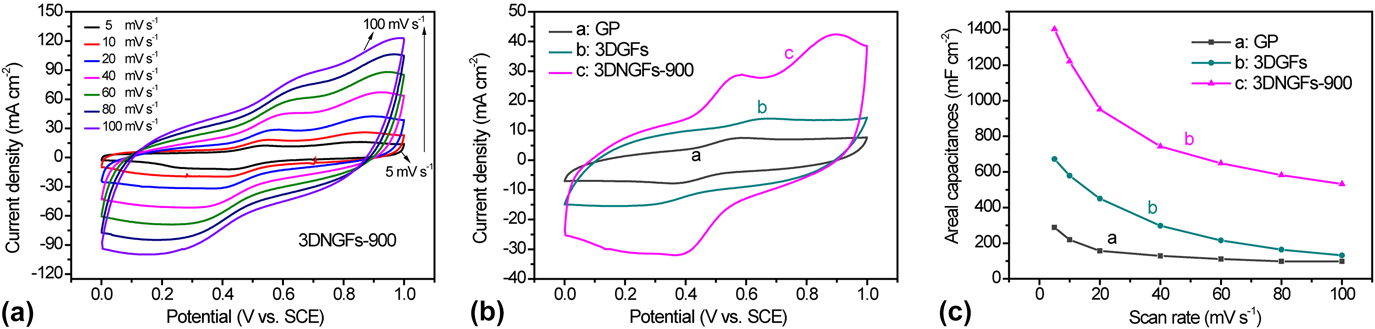
To test its capacitive activities, the 3DNGFs-900 electrode was measured in a 1 M H2SO4 aqueous electrolyte (See Sec. II) in a conventional three-electrode cell with a saturated calomel electrode (SCE) as the reference electrode and a Pt wire as the counter electrode. For comparison, 3DGFs without N-doping and the pristine GP electrode were also measured in the same condition. The cyclic voltammetry (CV) curves of the GP, 3DGFs, and 3DNGFs-900 electrodes at different scan rates with a potential window of 0–1 V were shown in Figs. S6 and 4(a), respectively. All the three electrodes exhibit rectangular shape curves, which are characteristic of the double-layer capacitance. Besides, a pair of redox peeks with good symmetry can be clearly observed, indicating that they have pseudocapacitive characteristics. The redox peaks correspond to the oxidation and reduction of residual oxygen-containing functional groups.Reference Yang, Peng, Shu, Lv, He and Long47–Reference Chen, Zhang, Zhang, Yu and Ma49 This phenomenon is consistent with the XPS analysis results. A representative comparison of the CV curves for the GP, 3DGFs, and 3DNGFs-900 electrodes collected at the scan rate of 20 mV/s are shown in Fig. 4(b). Remarkably, the redox peak current densities of the 3DNGFs-900 sample are substantially higher than those of the 3DGFs and GP, indicating that the presence of nitrogen heteroatoms can considerably contribute to an additional pseudocapacitance. The CV plot area for the 3DGFs sample is larger than that of GP, indicating that the 3D architecture and the nature of graphene layers are benefits for the improvement of the capacitance performance. Moreover, it increases further after the doping of the heteroatom nitrogen. The CV curve of the 3DNGFs-900 sample shows a much larger area than that of the 3DGFs [Fig. 4(b)] electrode, which could probable due to the doping of nitrogen improve the wettability on the 3DNGFs surface thus enhancing the charge-storage capability of the electrode. Furthermore, for the 3DNGFs-900 electrode, when the scan rate increases from 5 to 100 mV/s, the CV curve still retains in a rectangular shape, demonstrating its excellent rate capability. The specific capacitance [Fig. 4(c)] calculated for GP, 3DGFs, and 3DNGFs-900 electrodes based on the CV curves as a function of the scan rate showed that the 3DNGFs-900 electrode reached a maximum specific capacitance of 1402.1 mF/cm2 at a scan rate of 5 mV/s, which is substantially higher than that of GP (359.5 mF/cm2), and 3DGFs (672.8 mF/cm2), confirming that the as-mentioned method can effectively produce 3DNGFs with high capacities properties. Remarkably, the capacitance of the 3DNGFs electrode is substantially higher than or comparable to some recently reported bulk 3D graphene-based materials, such as, graphene-gel/nickel foamReference Zhai, Wang, Yu, Xie, Liang, Li, Xiao, Tang, Wu, Lu and Tong50 (0.070 F/cm2, 10 mV/s), MnO2/graphene-gel/nickel foamReference Zhai, Wang, Yu, Xie, Liang, Li, Xiao, Tang, Wu, Lu and Tong50 (13.6 mg/cm2, 3.18 F/cm2, 1 mV/s), 3D graphene/flexible graphite-paperReference Ramadoss, Yoon, Kwak, Kim, Ryu and Jang51 (15.6 mF/cm2, 5 mV/s), and 3D-rGO/carbonized cotton fabric (87.53 mF/cm2 at 2 mV/s).Reference Zhou, Ye, Wan and Jia52
CV curves of the (a) 3DNGFs-900 electrode at scan rates of 5–100 mV/s. (b) CV curves of the for GP, 3DGFs and 3DNGFs-900 electrodes at scan rates of 20 mV/s. (c) Specific capacitance calculated for GP, 3DGFs, and 3DNGFs-900 electrodes based on the CV curves as a function of the scan rate.

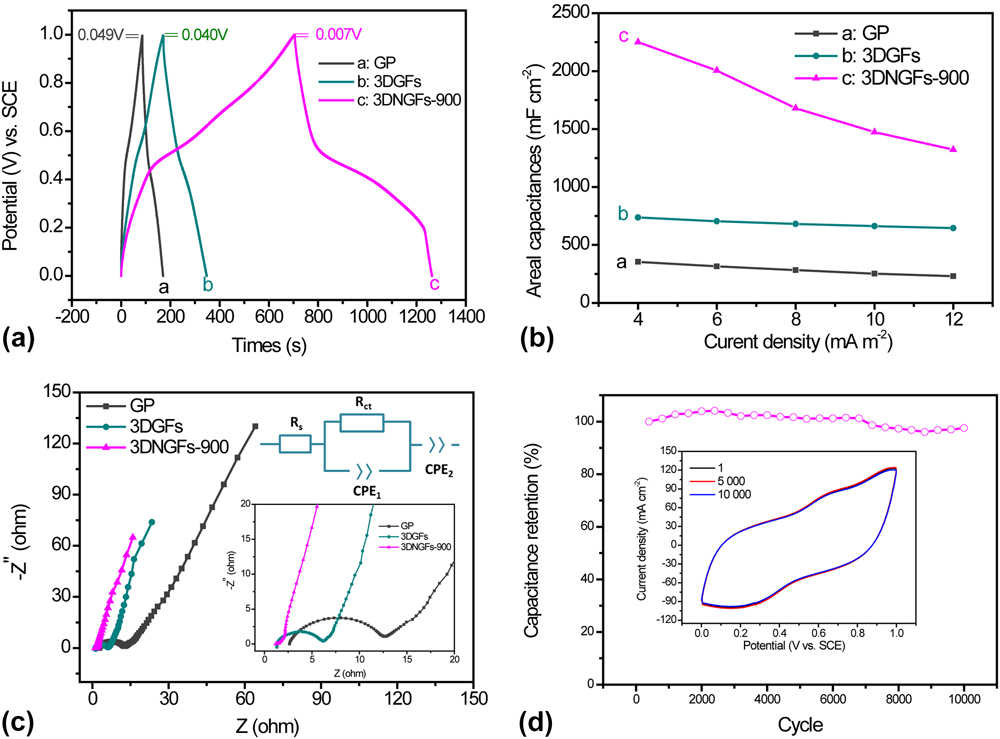
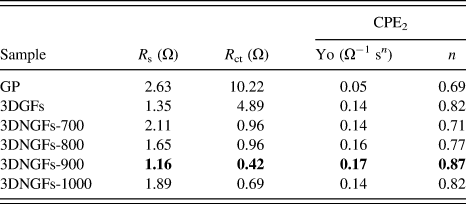
The electrochemical performance of the 3DNGFs-900 electrode was further evaluated by GCD measurements. Figure S7 displays the GCD curves of different electrodes at various current densities, from 4 to 12 mA/cm2. Figure 5(a) shows a representative comparison of the GCD curves for the GP, 3DGFs, and 3DNGFs-900 electrodes collected at the current density of 4 mA/cm2. When compared with that of GP electrodes, a longer discharge time was observed for the 3DGFs electrode, indicating an improvement of capacitance of the 3DGFs electrode due to the superior properties of graphene and the unique structure of the well-connected microporous 3D structure. The results are consistent with that of the CV investigation. Additionally, compared with the undoped 3DGFs, a much longer discharge time can be observed for the 3DNGFs-900 electrode, indicating a substantial enhancement of capacitance of the doped electrode. Moreover, the relatively symmetric GCD profiles for 3DNGFs-900 show their reversible pseudocapacitive behavior as well as rapid charge/discharge properties. Corresponding specific capacitance for different electrodes calculated as a function of current densities are showed in Fig. 5(b). The areal capacitance values of 3DGFs-900 at current densities of 12, 10, 8, 6, and 4 mA/cm2 are 1322.2, 1473.8, 1679.5, 2005.9, and 2250.3 mF/cm2, respectively, which are substantially higher than that of the GP and 3DGFs. Significantly, the 3DNGFs-900 electrode exhibited a highest specific capacitance of 2250.4 mF/cm2 at a current density of 4 mA/cm2, which is 6.3 times higher than that of GP (354.3 mF/cm2) and 3 times higher than the values of the 3DGFs (736.9 mF/cm2). These results convincingly supported the fact that the as-mentioned method can effectively produce 3DNGFs with high capacitance performances. Additionally, as observed in Fig. 5(a), the 3DNGFs-900 electrode displays a minimum iR drop of 0.007 V, revealing its superior electric conductivity. Also, the superior conductivity of the 3DNGFs-900 electrode was verified by the EIS measurements. As shown in Fig. 5(c), the Nyquist plots of all three samples show a small semicircle in the high frequency and a typical straight line in the low frequency region, which indicates that the charge-transfer is a fast process and the rate of the electrochemical process is governed by mass transfer. Notably, the 3DGFs and 3DNGFs-900 electrodes exhibit a more upward line than GP in the low frequency region, demonstrating the high capacitive behavior of the 3D architecture. A corresponding equivalent circuit [Upper inset of Fig. 5(c)] was also used to fit the Nyquist plots, in which R s is the ohmic resistance, which consists of the electrolyte resistance and the resistance of the electrical connections to the electrode. The semicircle is fitted with a parallel equivalent circuit made up of R ct and the constant phase element CPE1, in which R ct is the charge-transfer resistance. The fitting results are shown in Table II. Obviously, the R s and R ct of 3DGFs was 1.35 and 4.89 Ω, which is much smaller than that of GP (2.63 and 10.22 Ω), respectively, indicating that the electrode conductivity can be substantially improved by the electrochemical exfoliation and calcination processes. Significantly, for the 3DNGFs-900 sample with nitrogen doping, the R ct further decrease to 0.42 Ω, which is more than one order of magnitude lower than that of the pristine GP sample, suggesting that the sample’s electrical conductivity was markedly enhanced after nitrogen doping. Furthermore, the straight lines in the low-frequency region are fitted by the equivalence element CPE2 to evaluate the capacitive behavior of different electrodes. The impedance of a CPE is given by the following equation:
 $${Z_{{\rm{CPE}}}} = {1 \over {{Y_0}{{\left( {j\omega } \right)}^n}}}\quad ,$$
where ω is the frequency, j is the imaginary number, and Y 0 and n (0 ≤ n ≤1) are the frequency independent parameters. The meaning of Y 0 is depending on the value of n. When n = 1, Y 0 represents a pure capacitance; when n = 0, Y 0 is a pure resistor, and when n = 0.5, Y 0 is a Warburg impedance.Reference Chen, Zeng, Zhao, Yu, Cheng, Lu and Tong42 As shown in Table II, the 3DNGFs-900 sample shows the largest Y 0 and n, again demonstrating that the 3DNGFs-900 exhibits the best capacitive behavior and the lowest diffusion resistance.
(a) GCD curves of GP, 3DGFs and 3DNGFs-900 electrodes collected at the current density of 4 mA/cm2. (b) Specific capacitance of the GP, 3DGFs and 3DNGFs-900 electrodes calculated from GCD curves as a function of current density. (c) Nyquist plots of the GP, 3DGFs, and 3DNGFs-900 electrodes (upper inset: the corresponding equivalent circuit diagram). (d) Cycling performance of the 3DNGFs-900 electrode collected at 100 mV/s for 10,000 cycles. The inset shows the first, 5000th, and 10,000th CV curves of the 3DNGFs-900 electrode.

Values of the parameters obtained from the Nyquist plots of different electrodes.

We also studied the long-term cycling stability of the 3DNGFs-900 electrode by a CV test at a scan rate of 100 mV/s. As shown in Fig. 5(d), a slow increase of specific capacitance can be observed in the first initial 2500 cycles, which is probably due to the activation of the electrode material during the charge and discharge processes. After that, there is less capacity decay over 10,000 cycles (97.5% capacitance retention at the 10 000th cycle), indicating the remarkable electrochemical stability of the 3DNGFs-900 electrode. These results above convincingly supported that the as-prepared 3DNGFs possesse excellent performances when used as in energy storage applications. The superior electrochemical performance of the 3DNGFs-900 electrode is due to the following reasons: (i) the abundant well-connected micropores and mesopores created in the oxidation process provide a large surface area and guarantee fast ion transport and electrolyte diffusion, resulting in an improvement of double-layer capacitance. (ii) The highly conductive nature of graphene enhances the electrical conductivity of the material. (iii) The doping of nitrogen can enhance the wettability and conductivity of graphene, helping to reduce R s and R ct of the electrode and thus enables rapid charge transport via the network. (iv) Nitrogen doping can produce defects in the graphene layer and create additional active sites for pseudocapacitance.
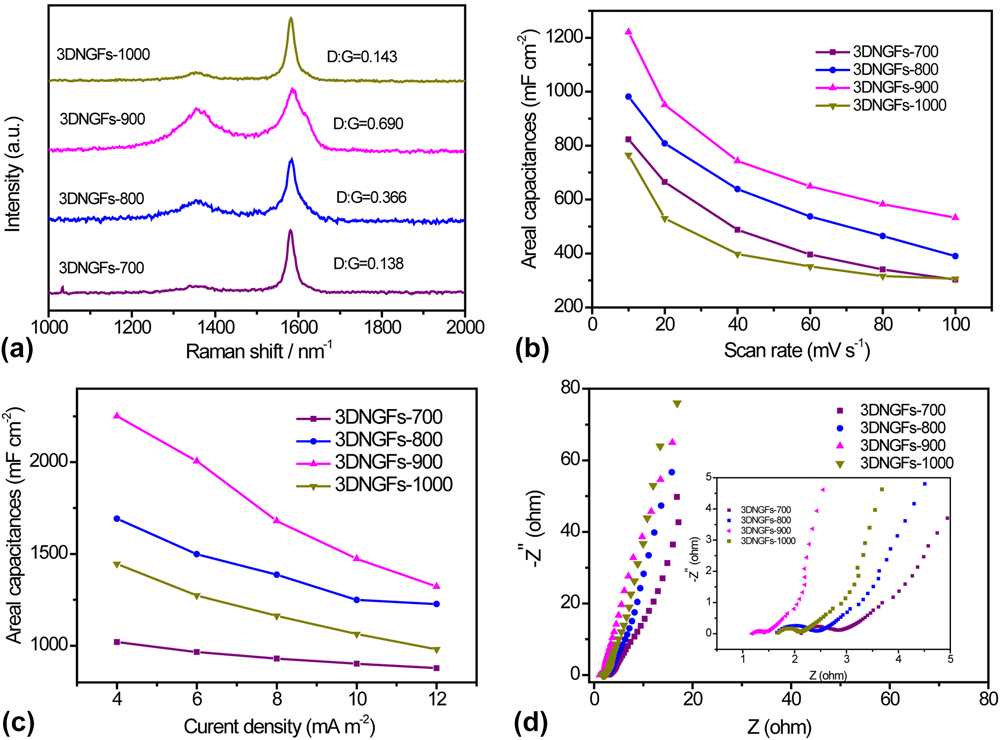
For better understand the relationship between the electrochemical properties of 3DNGFs and the doping levels of nitrogen, we prepared 3DNGFs at different annealing temperatures, respectively, (700 °C, 800 °C, 900 °C, and 1000 °C, denoted as 3DNGFs-700, 3DNGFs-800, 3DNGFs-900, and 3DNGFs-1000, respectively). As shown in Raman spectra [Fig. 6(a)], the 3DNGFs-900 sample displayed the highest ratio of I D:I G, indicating it processes most defects/edges than other samples, meaning much more additional active sites for charge storage. Simultaneously, XPS results showed that the nitrogen atom content in 3DNGFs decreased with the increasing annealing temperatures (Fig. S8 and Table I). The high-resolution N 1s spectrum of 3DNGFs-700, 3DNGFs-800, 3DNGFs-900, and 3DNGFs-1000 are shown in Fig. S8. The N 1s core-level XPS spectrum of 3DNGFs obtained at a relatively low annealing temperature of 700 and 800 °C can be fitted with four synthetic peaks, with the binding energies at 398.2, 399.3, 401.4, and 404.8 eV corresponding to pyridinic (N-6), pyrrolic/pyridone (N-5), quaternary (N-Q), and oxidized pyridinic nitrogen (N-X), respectively. Table II gives the concentrations of nitrogen species for different samples. It can be seen that the contents of the N-X species decrease as the annealing temperature decreases and disappear when the annealing temperature reached 900 °C. Meanwhile, the contents of quaternary nitrogen (N-Q) increase with the annealing temperature increase from 700 to 900 °C and then decrease over 900 °C. Interestingly, in all samples, N-Q accounted for the largest proportion, especially for the 3DNGFs-900 sample. It is reported that among various nitrogen species, the quaternary nitrogen (N-Q) species in the graphene layers could enhance the electronic conductivity of the carbon materials, which is important for the capacitance.Reference Wang, Wei, Nie and Zhang24,Reference Xiao, Ding, Chen, Wang, Lu and Wang45
(a) Raman spectra of different samples. (b) Specific capacitance calculated for different electrodes based on the CV curves as a function of scan rate. (c) Specific capacitance of the different electrodes calculated from GCD curves as a function of current density. (d) Nyquist plots of the different electrodes.

Furthermore, CV and GCD results [Figs. 6(b), 6(c), S9, and S10] also showed that the specific capacitance of the electrode increased with the increase of annealing temperature from 700 to 900 °C and then decreased over 900 °C. In addition, the EIS results [Fig. 6(d) and Table I], confirmed that the 3DNGFs-900 electrode possessed the lowest charge-transfer resistance and the best capacitive behavior than other 3DNGFs electrodes. Therefore, the 3DNGFs electrode obtained at a temperature of 900 °C has the best performance. The probable reasons may be that: (i) the highest value of I D:I G in Raman spectra indicating 3DNGFs-900 sample processes most defect/edge, which enables it exhibiting the best capacitance performance; (ii) the 3DNGFs-900 sample processes the highest proportion of N-Q among all the nitrogen species, indicating that most of the incorporated nitrogen can play an effective role in the electrochemical performance of the material; (iii) the introduction of proper content of nitrogen doping in the 3DNGFs-900 sample can enhance the electrical conductivity and thus enable it to deliver the lowest R s and R ct and guarantee the best capacitance behaviors.Reference Xiao, Ding, Chen, Wang, Lu and Wang45
IV. CONCLUSIONS
In summary, we have developed a facile and cost-effective approach to successfully fabricate high-quality three-dimensional nitrogen-doped graphene frameworks (3DNGFs) directly from the inexpensive GP for the high-performance supercapacitor (SC) electrode. The distinct advantages of this method are low cost, simplicity, high efficiency, and an easily realizing scalable synthesis. The specific surface area and pore volume for the as-prepared 3DNGFs were substantially increased when compared with the pristine GP, which is beneficial for fast ion transport and electrolyte diffusion. Besides, the 3DNGFs also exhibited excellent electrical conductivity due to the synergistic effect 3D graphene architecture and the incorporation of the nitrogen atom. When used as an electrode material for SCs, the 3DNGFs material yielded a remarkable capacitance of 2250.3 mF/cm3 at a current density of 4 mA/cm2, which is much higher than that of pristine GP. Moreover, the 3DNGFs also showed excellent long-term cycle stability for 10,000 cycles without obvious decay of capacitance. This new electrochemical oxidation approach provides a new insight into the designing of high-quality 3D N-doped graphene frameworks with superior electrochemical performance for batteries and supercapacitors.
Supplementary Material
To view supplementary material for this article, please visit https://doi.org/10.1557/jmr.2017.387.
ACKNOWLEDGMENTS
The authors are grateful for financial support of this work by the National Natural Science Foundation of China (Nos. 21375016, 21475022, and 21505019), the Technology Planning Project of Guangdong Province (No. 2015B090927007), the Natural Science Foundations of Guangdong Province (No. 2015A030310272), the Guangdong Provincial Key Platform and Major Scientific Research Projects for Colleges and Universities (2015KCXTD029 and 2016KQNCX221), Social Science and Technology Development Project of Dongguan (No. 2017507151062), Young Teachers Development Foundation of City College of Dongguan University of Technology (2016QJZ002Z), and Special Funds for the Cultivation of Guangdong College Students' Scientific and Technological Innovation (“Climbing Program” Special Funds) (pdjh2017b0947).