I. INTRODUCTION
Wide band gap semiconductors are of interest due to their ability to operate at high temperatures without suffering intrinsic conduction effects.Reference Prelas, Saha and Lee1 These characteristics, as well as hardness and resistance to chemicals, make aluminum nitride (AlN) an attractive material for electronic packaging applications.Reference Strite and Morkoc2 Availability of single crystal AlN has been limited in the past, and its material characteristics have only recently been studied in detail.Reference Harman, Kabulski, Pagan, Famouri, Kasarla, Rodak, Hensel and Korakakis3–Reference Yonenaga, Ohno, Taishi and Tokumoto5 Polyakov et al.Reference Polyakov, Smirnov, Govorkov, Yugova, Scherbatchev, Avdeev, Chemekova, Mokhov, Nagalyuk, Helava and Makarov6 report characteristics on the deep centers of bulk AlN. Dominant electron traps are reported with ionization energies of 0.26 eV and 0.65 eV and concentrations of 1013/cm3 and 1015/cm3, respectively. Soltamov et al.Reference Soltamov, Ilyin, Soltamova, Tolmachev, Mokhov and Baranov7 identified two deep-level defects in AlN single crystals through electron paramagnetic resonance (EPR) and thermoluminescence (TL). These defects were attributed to oxygen located at the N site and carbon or silicon located at the Al site.
Recently, developments in single crystal AlN production have allowed for further study of the material.Reference Chemekova, Avdeev, Barash, Mokhov, Nagalyuk, Roenkov, Segal, Makarov, Ramm, Davis, Huminic and Helava8 In the present work, AlN surface traps were characterized through use of the Charge-based Deep Level Transient Spectroscopy (Q-DLTS) technique and the effects of exposure to hydrogen plasma were studied. Arrhenius data was generated from Q-DLTS spectra taken at a series of temperatures which provided the activation energies and capture cross sections of each observed surface trap. The material was characterized in this manner both before and after exposure to the hydrogen plasma. The addition of a new trap was observed after this exposure.
Novel sensing devices are being developed that utilize the bare semiconductor surface as a sensor in conjunction with a Q-DLTS device. This technology is known as the Quantum FingerprintTM sensor. This patented variety of sensor was first discussed using Diamond-like Carbon (DLC)Reference Polyakov, Rukovishnikov, Khomich, Druz, Kania, Hayes, Prelas, Tompson, Ghosh, Loyalka, Johnson, Lee, Pickering and Sheldon9 and may be adapted for a wide range of substrates.Reference Prelas, Ghosh, Tompson, Viswanath and Loyalka10, Reference Ghosh, Prelas, Viswanath and Loyalka11 Further studies have been carried out on DLC, and nitrogen-doped diamond.Reference Polyakov, Mityagin, Rukovishnikov, Druz, Zaritsky and Yervtukchov12–Reference Polyakov, Rukovishnikov and Ralchenko14 In the course of this research, the initial steps in the fabrication of an AlN-based Quantum FingerprintTM sensor are discussed. The principle for detection using this technique is that vapors and gases are adsorbed onto the surface of the bare semiconductor and these adsorbates form surface defects that acquire the role of surface traps.Reference Wolkenstein15, Reference Volkenstein16 The addition of hydrogen to the surface by exposure to hydrogen-containing plasma creates a new state that is observable through the use of Q-DLTS. Existing surface charge traps and those resulting from termination must be characterized before a prototype Quantum Fingerprint™ sensor may be made. Analysis was undertaken on the nature of the traps at the surface of the single crystal AlN both before and after the hydrogen termination and the results were compared with existing literature using alternate methods to verify our methods. In addition, the effect of hydrogen termination on the Q-DLTS spectrum response to water vapor was also examined to determine whether the post-termination surface is more or less hydrophilic in nature than the pretermination surface.
II. EXPERIMENTAL
A single crystal AlN wafer with a diameter of 15 mm and an approximate thickness of 350 μm was obtained from Nitride Crystals Group. The sample was cleaned in a series of steps upon receipt and was rinsed in deionized water twice after each cleaning step. Initially, the sample was cleaned in a sulfuric acid and hydrogen peroxide mixture (4:1) at a temperature of 80 °C for 15 min to remove organic contaminants that might have been present on the surface.Reference Zant17 This process was followed by a wash in hydrofluoric acid/distilled water (1:50) at approximately 50 °C for 10 min to remove any oxide build up. Following this, the sample was subjected to RCA SC-1 cleaning at approximately 90 °C for 10 min, which is an effective method for the removal of organic surface films and metals. The RCA SC-1 mixture consisted ofdeionized water, hydrogen peroxide, and ammonium hydroxide (50:1:1). Afterwards, the sample was placed in RCA SC-2 for 10 min at 90 °C. The RCA SC-2 components were deionized water, hydrogen peroxide, and hydrochloric acid (6:1:1). This step was used to remove alkali ions, hydroxides, and other metals.Reference King, Barnak, Bremser, Tracy, Ronning and Davis18 Next, a hydrochloric acid/nitric acid (1:3) solution at 80 °C was utilized to remove any potential remaining contaminants such as heavy metals. The sample was then boiled in deionized water two times for 10 min periods and this was followed by a bath in High Performance Liquid Chromatography (HPLC) grade methanol.
With the polished side orientation up, a physical mask leaving a bare gap of 1.0 mm was placed on the AlN surface. The masking was completed such that two identical triangular contact pads were established at the center of the sample with a gap approximately 6 mm long. The sample was then metalized using a thermoresistive evaporator with a base pressure of 4 × 10⁻⁷ mbar. The deposited adhesion layer was 100 nm of titanium, topped with a 100 nm gold capping layer. Titanium deposition on the surface of AlN has been determined to create a TiAl3 aluminide compound leading to enhanced contact quality after high temperature annealing in the range of 700 °C–950 °C.Reference Yasumoto, Yamakawa, Iwase and Shinosawa19 After the physical mask was removed, the sample was subjected to an initial current-voltage (I-V) measurement. Next the sample was annealed at 825 °C in 10 mbar of helium for a period of 5 min to promote adhesion and enhance the conductivity of the electrical contacts. During the annealing step, the helium atmosphere inlet gas was scrubbed free of oxygen by passing the gas through a packed column of copper shavings heated to 400 °C. Following the annealing process, the sample was once again tested for its I-V characteristics to observe any changes in the electrical properties of the metal/semiconductor interface that might be due to the annealing.
The Q-DLTS spectrum of the AlN sample was observed using a software-based Q-DLTS instrument.Reference Montenegro20 The filling voltage (V) is applied to the sample via a voltage divider connected to one of the sample electrodes. The other electrode is connected to the integrating amplifier of the Q-DLTS instrument. This configuration, called the Parallel Mode, was selected to probe the surface states of the AlN between the symmetrical sample electrodes deposited on the sensing surface.Reference Kachwalla and Miller21 The surface states were filled with a 5 V bias pulse and the charge duration was varied between 100 μs and 300 ms, depending upon the emission rates of the traps under investigation. Trapped charge was allowed to decay and the charge was collected by the Q-DLTS device. The Q-DLTS algorithm was then used to create a spectrum of characteristic trap emissions for each sample. To obtain Arrhenius plots, measurements were made at temperatures that ranged between −15.9 °C and 136.0 °C. The Arrhenius plots were then used for the determination of the capture cross sections (σ) and the activation energies (Ea) of the observed surface traps. Following this, the AlN sample was exposed to water vapor at room temperature to observe any change in the Q-DLTS spectrum. The evolution in Q-DLTS spectrum as the water vapor concentration was increased is the result of the adsorption of water vapor molecules on the surface of the bare AlN. This is compared with a background spectrum obtained prior to exposure to water vapor.
Next, the surface was terminated with hydrogen. To accomplish this, the AlN surface was exposed to hydrogen plasma from a Scott Specialty Gas (Plumsteadville, PA) high purity 5% hydrogen 95% argon gas mixture for 10 min on the medium power setting in a plasma cleaning device (Harrick Plasma PDC-32G, Ithaca, NY) that generates an Inductively Coupled Plasma (ICP). The system utilizes an Edwards RV3F pump (Edwards, Sanborn, NY) with a lower pressure limit of 2 × 10⁻³ mbar, as well as an Edwards EMF10 oil mist filter (Edwards, Sanborn, NY) to prevent oil contamination. Three system flushes with the process gas were performed to remove any ambient air remaining in the plasma chamber. Following hydrogen termination, Q-DLTS measurements were again made at temperatures ranging from −15.1 °C to 105.6 °C. This data was used to generate Arrhenius plots, from which values for σ and Ea were obtained and compared with the data generated at pretermination. In addition, the terminated AlN surface was exposed to water vapor at room temperature. The termination of the surface with hydrogen is expected to lead to a change in the hydrophilic nature of the AlN. Any changes will be observed in the change of the Q-DLTS spectrum.
III. THEORY
Hydrogen plasma is an established method for surface termination of wide band-gap semiconductor materials and this same method has been applied here to AlN.Reference Cui, Ristein, Stammler, Janischowsky, Kleber and Ley22 Successful hydrogen termination of surface bonds may alter the characteristics of existing traps observed prior to termination or may lead to the creation of entirely new traps. These surface traps will be observable through the use of Q-DLTS because the detection of transient charge is maximized at the surface of the semiconductor.Reference Thurzo, Beyer and Zahn23
As in Lang’s original DLTS method,Reference Lang24 the Q-DLTS technique relies on cyclic bias pulses to momentarily excite the traps of p-n junctions and Schottky and other rectifying barriers. The electron occupation of the level is monitored as it returns to thermal equilibrium by measuring the associated charge transients. In this scheme, a “rate window” is defined as a function of two measuring gate times (t 1 and t 2) starting at the beginning of the trap discharge. The charge transient is measured at these two times and the difference, Q (t 2)−Q(t 2), is plotted as a function of temperature. According to Maxwell-Boltzmann statistics, the thermal emission rates are strongly dependent upon temperature. At a particular temperature, a thermal scan will produce an emission rate that matches the rate window. Therefore, a peak in the spectrum is produced because Q (t 2)−Q(t 2), is maximized. Multiple peaks are possible due to multiple emission rates with a variation in sample temperature.
If the trap distribution is assumed to be uniform, then the current can be described asReference Balland, Zielinger, Tapiero, Gross and Noguet25:

where q is the electronic charge, A is a constant depending on the surface area between the electrodes and the thickness of the substrate, V is the applied voltage, ηt(0) is the initial trapped carrier density, t is the time, τt is the trap time constant, and μ and τl are the mobility and recombination lifetime of freed carriers, respectively. To obtain the charge emitted, the previous equation must be integrated over time:
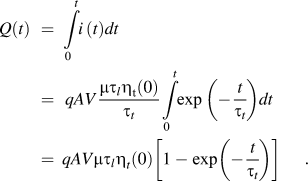
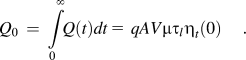
The prefactor in Eq. (2) is the total charge collected:
Traditionally in DLTS, the user-defined rate window is kept constant while the temperature is varied. A similar method is to maintain a constant sample temperature while the rate window is varied.Reference Arora, Chakrarty, Subramanian, Polyakov, Ermakov, Ermakova and Perov26 The rate window can be described as a function of the proportional gate times (i.e., t 2/t 1 = α) as:

The gate timed charge difference emitted from the beginning of discharge is simply:

For electrons, the previous equation can be also written as:

where en is the electron emission rate, which has the formReference Polyakov, Rossukanyi, Rukovishnikov, Pimenov, Karabutov and Konov27:

where σ is the capture cross section, T is the temperature, Ea is the activation energy, k is the Boltzmann constant, and Γn is defined as:
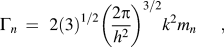
where h is Planck’s constant and mn is the effective mass of the electron. The equations for holes are analogous. For a given temperature, a maximum in the spectrum will occur when the rate window equals the emission rate of the trap:
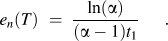
By setting α = 2 (as in the present design) we have,
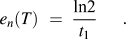
Substituting this value into Eq. (6) we have,
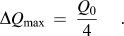
This last equation is significant because it allows a direct calculation of the total charge collected from the Q-DLTS peak maxima. Finally, due the Arrhenius dependence of the emission rate, σ and Ea can be calculated using Eq. (7).
Parallel contact Q-DLTS measurements have been used for analysis of states in the band gap using Schottky contacts. Wang et al. have reported the use of symmetrical planar Al electrodes in conjunction with Q-DLTS to analyze states in a diamond film.Reference Wang, Chen, Wu, Guo, Cao, Shang and Han28 Polyakov et al.Reference Polyakov, Rossukanyi, Rukovishnikov, Pimenov, Karabutov and Konov27 have used similar methods to analyze H-terminated diamond surfaces. Q-DLTS measurements are most sensitive at the surface of a semiconductor making this technique ideal for this type of analysis.Reference Thurzo, Beyer and Zahn23 Adsorbed species at the surface have the capability of creating surface defects that acquire the role of surface charge traps and may be observed through Q-DLTS.Reference Wolkenstein15 In addition, bulk charge traps may exist at the surface and may also be observed through Q-DLTS.Reference Volkenstein16
IV. RESULTS AND DISCUSSION
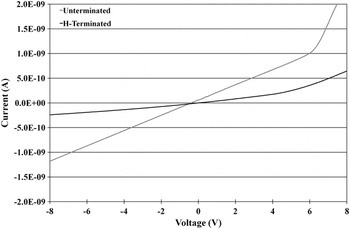
Immediately after metalization, the AlN sample showed no electrical contact observable by I-V measurements (Keithley model 6487, Cleveland, OH). The sample was annealed in a helium atmosphere at 825 °C for 5 min and subsequently displayed a linear response near the origin with an observable rectifying edge at a value of 6 Volts. The resistance in the linear region was measured to be 6.0 GΩ. Immediately after hydrogen termination, the rectifying edge was observed at approximately 4.5 V, however it was less distinct, as can be seen in Fig. 1. Post-termination, the resistance was increased to 20 GΩ in the linear region.
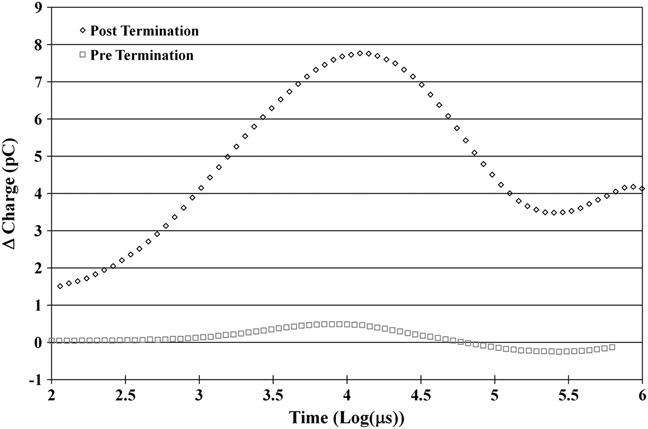
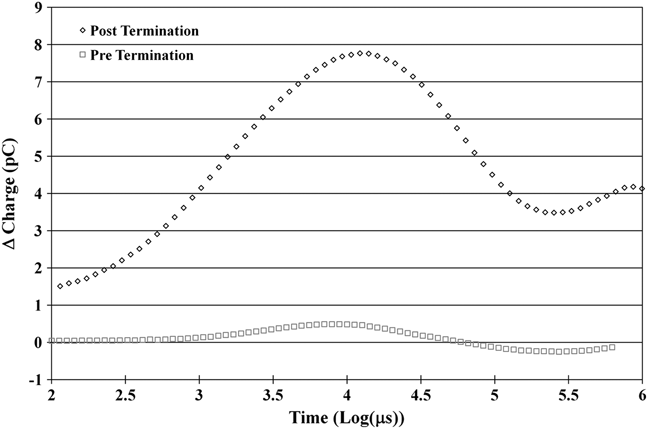
The surface of the sample was observed for its Q-DLTS response to water vapor before and after termination with hydrogen. The Q-DTLS spectra in Fig. 2 are corrected by the background measurements taken prior to the exposure to water vapor. This step is done to qualitatively determine the hydrophilic effect of the addition of hydrogen to the surface. The amount of charge output observed from the surface of the AlN as a result of exposure to water vapor is increased by more than an order of magnitude. This is evidence of a drastic increase in the response to water vapor from the hydrogen-terminated surface.
AlN Current-Voltage (I–V) measurements across an unmetalized gap before and after termination with hydrogen.

AlN Q-DLTS Response to water vapor before and after termination with hydrogen.
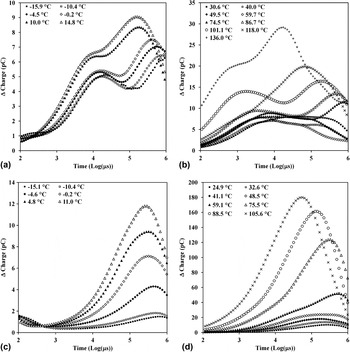
The AlN sample Q-DLTS signal was then measured at a wide temperature range from −15.9 °C to 136.0 °C. In all, four states were observed in the unterminated AlN spectra. Figures 3(a) and 3(b) display the Q-DLTS spectra for the unterminated surface at low temperatures and high temperatures, respectively. As expected, the peaks moved from a longer emission rate to a shorter emission rate with increasing temperature. A maximum of 30 pC of charge is emitted from the traps at 136.0 °C.
a) Low temperature Q-DLTS measurements on unterminated AlN at temperatures ranging from −15.9 °C to 14.8 °C b) High temperature Q-DLTS measurements on unterminated AlN at temperatures ranging from 30.6 °C to 136.0 °C c) Low temperature Q-DLTS measurements on H-terminated AlN at temperatures ranging from −15.1 °C to 11.0 °C d) High temperature Q-DLTS measurements on unterminated AlN at temperatures ranging from 24.9 °C to 105.6 °C.

After exposure to hydrogen plasma, Q-DLTS spectra were taken once again at temperatures ranging from −15.1 °C to 105.6 °C. Figures 3(c) and 3(d) illustrate the Q-DLTS spectra of the hydrogen-terminated sample at low and high temperatures, respectively. Significantly more charge is emitted from the traps on the AlN surface. This increase in charge output may be attributed to the addition of a new state and the alteration of existing states.
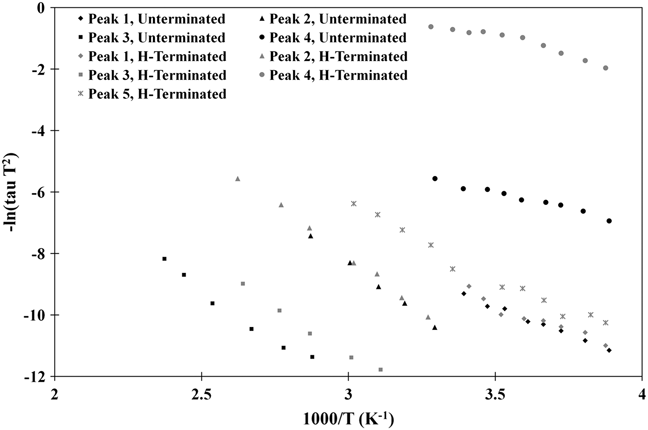
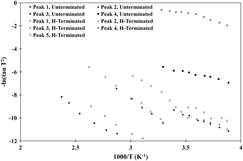
The Q-DLTS spectra were used to provide Arrhenius data for determining the activation energies and capture cross-sections of the individual traps. Data taken from the unterminated sample indicates that there are initially four surface traps. After termination, however, five distinct traps are observed. The additional fifth trap may be attributed to the previously unstudied hydrogen plasma exposure step. The Arrhenius data is illustrated in Fig. 4.
Arrhenius data for hydrogen-terminated and unterminated AlN surface showing the development of a fifth surface trap after termination.
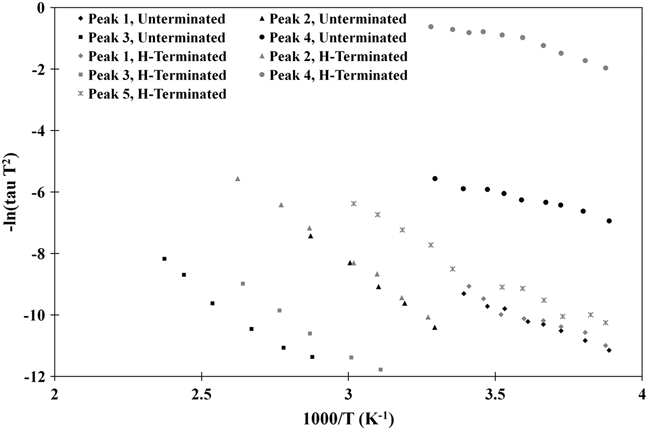
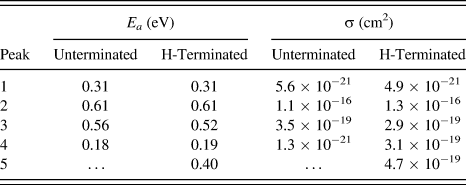
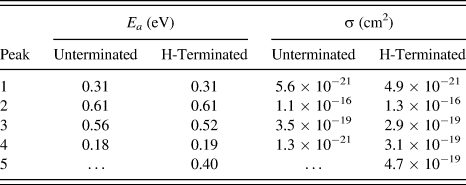
The characteristics of the traps observed before and after the hydrogen termination step are detailed in Table I. Careful analysis reveals that peaks 1, 2, and 3 appear relatively undisturbed after termination, while peak 4 is altered in capture cross section value only. A fifth peak is also observed after termination, which may be attributed to termination with hydrogen. Two of the original four peaks may be attributed to the bulk traps observed by Soltamov et al.,Reference Soltamov, Ilyin, Soltamova, Tolmachev, Mokhov and Baranov7 which was assigned to oxygen located in the N site and carbon or silicon located in the Al site. Peaks 1 and 2 compare favorably to those with activation energies of 0.26 eV and 0.65 eV determined by Polyakov et al.Reference Polyakov, Smirnov, Govorkov, Yugova, Scherbatchev, Avdeev, Chemekova, Mokhov, Nagalyuk, Helava and Makarov6 Bulk traps will exist at the surface as surface traps and in addition, surface states induced from the adsorption of vapor species will induce traps.Reference Wolkenstein15, Reference Volkenstein16 The remaining peaks, 3 and 4, were previously unobserved by other methods. They may be attributed to either lower density bulk defects or to surface states created from ambient atmospheric conditions. Given the effects on the value of capture cross section for peak 4 due to hydrogen termination, this peak is hypothesized to be a surface state. The observation of such surface states is result of parallel contacts and is critical for the construction of a Quantum Fingerprint™ sensor. The Q-DLTS peaks are a combination of bulk traps from crystal defects, surface states induced by vapor adsorption, and hydrogen termination.
Arrhenius data generated both before and after hydrogen surface termination.
V. CONCLUSIONS
A single crystal AlN wafer surface was analyzed for trap characteristics and the effect of hydrogen termination on surface traps. A multistep, aqueous cleaning was undertaken followed by a titanium-gold metalization scheme. Annealing served to enhance the electronic properties of the metalizations and provide a highly resistive contact with rectifying characteristics. I-V measurements show that the AlN surface is more resistive after termination and a rectifying edge exists at approximately 6 V for the unterminated surface and approximately 4.5 V for the hydrogen-terminated surface.
Q-DLTS measurements were taken before and after the exposure to hydrogen plasma. Arrhenius plots were generated from these spectra and the characteristics of the surface traps were determined. Prior to the hydrogen exposure, there were four AlN surface traps evident with activation energies of 0.31 eV, 0.61 eV, 0.56 eV, and 0.18 eV and capture cross sections 5.6 10−21 cm2, 1.1 × 10⁻¹⁶ cm2, 3.5 × 10⁻¹⁹ cm2, and 1.3 × 10⁻²¹ cm2, respectively. A fifth distinct surface trap emerges after hydrogen termination with activation energy of 0.40 eV and a capture cross section of 4.7 × 10⁻¹⁹ cm2. Three of the four original traps are observed in the hydrogen-terminated surface with very similar trap characteristics of activation energies of 0.31 eV, 0.61 eV and 0.52 eV, and capture cross sections of 4.9 × 10⁻²¹ cm2, 1.3 × 10⁻¹⁶ cm2, and 2.9 × 10⁻¹⁹ cm2, respectively. Peak 4 is observed with a similar activation energy of 0.19 eV, but a different capture cross section of 3.1 × 10⁻¹⁹ cm2. Peaks 1 and 2 may be attributed to bulk defects and match prior experiments quite well. Peaks 3 and 4 may be attributed to either surface states or low-density bulk defects that were previously unobserved and peak 5 is the result of hydrogen termination.
ACKNOWLEDGMENTS
This research was supported through fellowships through the Nuclear Regulatory Commission, No. NRC-38-08-959 and the Department of Education, No. DE-FG07-07ID14892. Funding was also provided by the Defense Threat Reduction Agency through Grant No. W911SR-07-C-0004.