Introduction
Thin-film photovoltaic (PV) technologies are attractive because they offer a lower overall module cost due to savings in both materials and processing. The lower module cost offers the potential for a lower cost kilowatt-hour produced by PV installation. The use of thin films also allows material of relatively poor quality to be used, since charge carriers only have to diffuse over a distance of the order of the film thickness. An inherent characteristic of both wafer-based and thin-film PV cells is incomplete light absorption in the spectral region near the bandgap of the photoactive material, which means that light-trapping approaches must be used to achieve optimal cell efficiencies.Reference Shockley and Queisser1–Reference Yablonovitch and Cody4 In thin-film PV cells, light trapping is particularly important because of the desire to produce cells with the thinnest possible active layers, but it remains relatively poorly understood and technologically challenging.
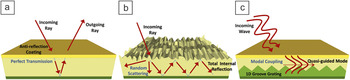
A common way to increase the optical absorption of a slab of material is to use an anti-reflective coating (ARC)Reference Zhao and Green5, Reference Bilyalov, Stalmans, Schirone and Levy-Clement6 (Figure 1a). An ARC reduces the reflectivity from air to the photoactive region, but also prevents the optical energy, once inside the photoactive region, from making multiple round trips inside the photoactive region. In contrast, the goal of a light-trapping approach is to enhance the optical path length (i.e., the distance a photon travels before escaping) inside the photoactive region, as shown in Figure 1b. ARCs and light-trapping approaches are used in tandem to maximize the number of photons absorbed in the photoactive region.
(a) The ability of an anti-reflection coating (ARC) to maximize optical absorption is limited because the optical path length is not altered. (b) Incoherent or geometric light trapping where random scattering off of a Lambertian surface is used to increase the optical path length inside the photoactive region. (c) Coherent light-trapping where interference, diffraction, and optical electric field concentration are exploited to enhance the likelihood that an incident photon is absorbed in the photoactive region.

Traditionally, geometric scatteringReference Shockley and Queisser1 at one or both surfaces that bound the active layer has been used for trapping incident light (Figure 1b). Light absorption is maximized by randomizing the occupation of the photon density-of-states (PDOS)Reference Yablonovitch2, Reference Yablonovitch and Cody4 in the active layer, thereby ensuring that, once trapped in the photoactive layer, the exit probability of a photon is reduced to a minimum possible value of 1/n 2, where n is the index of refraction of the active material. Since this approach is based on the principles of statistical ray optics, the limit strictly applies only to PV cells, whose active layer thickness is much larger than the wavelength. It is used to maximize light absorption in both wafer-based and thin-film PV cells, but is much less effective in thin-film PV cells where the wavelength of the incident light is comparable to or larger than the film thickness. The main reasons for the reduced effectiveness are that subwavelength structures that effectively scatter light across a wide spectral range are challenging to design and fabricate,Reference Müller, Rech, Springer and Vanecek8 and thin films have a lower local PDOS compared to the bulk.
Because of the shortcomings of geometric light-trapping schemes for thin-film PV cells, light harvesting approaches based on wave optics have attracted significant interestReference Gee9 (Figure 1c). Light trapping based on wave optics or coherent light-trapping approaches works in the regime where light needs to be treated as a wave phenomenon and can be made to interfere to reinforce the electric field in certain regions. The problem can be formulated as a spatial and spectral redistribution of the PDOS from regions where absorption is sufficiently strong or not needed to regions where absorption enhancement would lead to enhanced photocurrentsReference Agrawal10 by structuring of the dielectric landscape.
Theoretical limits of light trapping in the wave domain
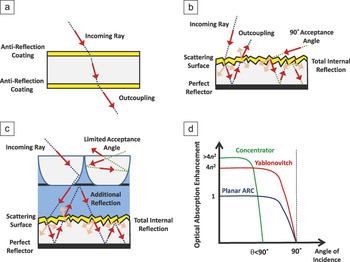
Before discussing the various coherent light-trapping approaches, we consider the physical limits of absorption enhancement. For thick structures, the Yablonovitch limit is applicable, which can be derived using either thermodynamicsReference Yablonovitch and Cody4 or statistical mechanicsReference Yablonovitch2 arguments. The Yablonovitch limit states that the maximum possible angular averaged enhancement of optical absorption as compared to a simple planar slab (Figure 2a) in the limit of a small absorption coefficient (under this condition, the enhancement in absorption equals the optical path length enhancement) is given by 4n 2, where n is the refractive index of the material.Reference O’Brien, Kherani, Chutinan, Ozin, John and Zukotynski24 Since light is randomly scattered in all possible directions by the Lambertian scattering surface, it will occupy all possible allowed photon states inside the medium. In this case, a photon occupancy state is characterized by the angle of scattering and polarization of light. The occupancy of the available PDOS is depicted in Figure 2b as the light scattering into various angles. It is important to understand that this limit also assumes that incident light is fully isotropic (i.e., the occupation of the PDOS in the medium outside the absorber [often air or vacuum] is fully randomized).Reference Agrawal10 If this is not the case, the enhancement in optical absorption can exceed 4n 2. In Figure 2c, the concentrator placed in front of a PV cell equipped with a Lambertian texture increases the optical path length to >4n 2 for a photon that manages to make it through the concentrator by virtue of a reflection from the backside of the concentrator. However, this increased optical path length comes at a cost of a reduced acceptance angle. Not all photon incidents on the concentrator make it through to the absorber. Generally, if the incident radiation occupies a limited solid angle given by θ, as is the case for the concentrator geometry shown in Figure 2c, the maximum achievable absorption enhancement is 4n 2/sin2(θ). When integrated over all solid angles, the absorption enhancement cannot exceed 4n 2. In the literature, several light-trapping proposals exist that appear to beat the Yablonovitch limit by looking at a single or a limited number of angles of incidence. Almost invariably, these structures exhibit angle-dependent absorption, and their performance drops for off-normal angles of incidence, as shown schematically in Figure 2d (green line).
(a) Planar slab with ideal anti-reflection coatings (ARCs). (b) Absorber with an ideal back reflector and Lambertian front surface with ideal ARC. The enhancement of the average optical path length is 4n 2. (c) Concentrator with backside reflector placed in front of the cell of (b). This leads to an increased optical path length at the cost of a reduced acceptance angle. (d) Optical absorption enhancement as a function of angle of incidence for cases (a), (b), and (c). Note that this graph was drawn to represent trends and is not based on actual data.

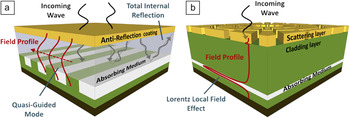
There have been a number of attempts to derive a limit for the enhancement that can be obtained in the wave regime,Reference Tobías, Luque and Marti11–Reference Yu, Raman and Fan13 but there is no general agreement yet. The constant brightness theorem cannot be applied, since light propagation is coherent such that energy flux cannot be calculated by summing energies propagating in different directions. In the coherent regime, the superposition of field magnitudes needs to be used to obtain the field intensity. The Poynting theorem can then be used to relate the net field intensities to the net energy propagation. Even in the coherent regime, in certain cases, information theoretical argumentsReference Agrawal10 can be used to show that the maximum possible absorption enhancement is bound by the Yablonovitch limit. This is the case when evanescent waves (near-field waves that decay exponentially in intensity away from the interface) play a minor role and light propagation inside the active material can be explained as a superposition of propagating waves (Figure 3a). The optical absorption rate is determined by the number of available modes in which solar photons can couple and the number of photons in each mode in the steady state. Classical information theory provides an upper bound on the maximum number of available modes in a given volume (known as electromagnetic degrees of freedom), while the maximum photon occupation of these modes is given by a theorem from Bassett. However, if evanescent modes are purposefully exploited (Figure 3b), this limit can be exceeded. Recently, two research groupsReference Green14, Reference Yu, Raman and Fan15 have independently shown that structures supporting evanescent waves can beat the Yablonovitch limit in terms of angular-averaged absorption enhancement.
(a) Coherent light-trapping approach that is bound by the Yablonovitch limit because it relies on scattering into non-evanescent modes. (b) Light-trapping strategy that can surpass the Yablonovitch limit on account of deep-subwavelength-scale confinement and field-enhancement characteristic of evanescent optical modes (adapted from Reference Reference Yu, Raman and Fan15).

We now review various approaches to light trapping in thin-film cells: photonic crystals, metal nanostructures, and approaches relying on optical interference in multilayer stacks.
Photonic crystals
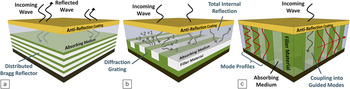
Photonic crystals are periodic dielectric media.Reference Joannopoulos, Meade and Winn16 Photonic crystals can possess a range of frequencies in which light cannot propagate in the structure, known as the photonic bandgap (PBG). The mechanisms by which photonic crystals assist in light trapping fall into three broad categories (Figure 4).
Three photonic crystal-based light-trapping strategies. (a) A photonic crystal is used as an omnidirectional reflector to reflect light back into the photoactive region without losses. (b) The photonic crystal is used as a diffractive element/scattering element that resides outside the photoactive region but scatters incident light into quasi-guided modes supported by the unpatterned photoactive region that can be thin or thick. (c) The photoactive region itself is patterned into a photonic crystal to couple incident light into quasi-guided modes.

In the first category, a photonic crystal acts as a high-quality back reflector (Figure 4a). This is not a light-trapping strategy in the strict sense because this approach does not necessarily change the optical path length. The existence of the PBG ensures that light of a wavelength that falls within the PBG is reflected back without losses. If the PBG is complete (which is possible in a 3D photonic crystal), reflection will be near unity regardless of angle of incidence. However, even for 1D photonic crystals, also known as distributed Bragg reflectors (DBRs), it is possible to achieve a high reflectivity over a wide spectral range.Reference Fink, Winn, Fan, Chen, Michel, Joannopoulos and Thomas17 One, two, and three-dimensional photonic crystals have been used in silicon cells as back reflectors.Reference Zeng, Yi, Hong, Duan and Kimerling18–Reference O’Brien, Kherani, Chutinan, Ozin, John and Zukotynski24 One area in which photonic crystals are used as reflectors is dye-sensitized solar cells (DSSCs); the ideal configuration is to have a reflective photonic crystal layer behind the wide bandgap semiconductor layer coated with dye, where most of the absorption happens.Reference Mihi and Miguez25–Reference Colodrero, Mihi, Häggman, Ocaña, Boschloo, Hagfeldt and Miguez27 Both 3D photonic crystalsReference Mihi and Miguez25, Reference Mihi, López-Alcaraz and Miguez26 and 1D photonic crystalsReference Colodrero, Mihi, Häggman, Ocaña, Boschloo, Hagfeldt and Miguez27 have been studied for this purpose. Alternative configurations, where a polymer 1D photonic crystal mirror was fabricated on the exterior behind the counter electrodeReference Lozano, Colodrero, Caulier, Calvo and Miguez28 of a DSSC, also have been investigated. Note that in many of the previous examples, the photonic crystal also acts to scatter or diffract incident light, and it could also be classified under the second category.
In a second category, the photonic crystal is located adjacent to the active layer and is used to diffract incident light into highly oblique angles propagating in the active layer according to Bragg’s law (Figure 4b). There is a twofold advantage to doing this. The distance that light must travel to reach the top surface is increased, and if the angle of the diffracted beam is greater than the critical angle, light will be reflected back at the top surface by total internal reflection. For thin active layers, a more accurate description is that the photonic crystal scatters incident light into quasi-guided modes. Planar structures support confined guided modes, which have infinite lifetimes into which incident solar radiation cannot couple. Adding a diffractive element to the solar cell configuration allows coupling of free space modes to these guided modes. The coupling is reciprocal such that strong coupling of incident light to guided modes also implies strong damping of those modes by re-radiation into free-space modes. The modes are leaky or quasi-guided (i.e., these modes gradually “leak” out of the structure or get attenuated as they propagate along the structure). However, they closely resemble the original guided modes in terms of the field profiles and resonant energies. It has been shown that for broadband enhancement, operating in the over-coupling regime is desirable, since this broadens the resonance peaks at the cost of a reduced intensity.Reference Yu, Raman and Fan15 The spectral location of these resonances depends on the grating period and structure and on the refractive index contrast of the materials involved. Incident light can couple into multiple leaky modes across the absorption spectrum, resulting in a broadband enhancement of absorption.
Gratings have been widely used as a diffractive element. The efficiency of light trapping with such structures depends on the period of the grating that should be large enough to suppress the zeroth order mode (no specular reflection) and small enough so that even the diffraction angles corresponding to the lower orders are large enough to ensure total internal reflection at the top surface. Simulations predict enhancements in photon conversion efficiency by combining 1D and 2D gratings with DBRs.Reference Bermel, Luo, Zeng, Kimerling and Joannopoulos22, Reference Mutitu, Shi, Chen, Creazzo, Barnett, Honsberg and Prather30, Reference Zhou and Biswas31 An increase in absorption has also been reported for fabricated crystalline silicon (c-Si),Reference Zeng, Bermel, Yi, Alamariu, Broderick, Liu, Hong, Duan, Joannopoulos and Kimerling32 amorphous silicon (a-Si),Reference Biswas, Bhattacharya, Lewis, Chakravarty and Dalal33 and nanocrystalline silicon (nc-Si)Reference Curtin, Biswas and Dalal34 cells. With clever design, cells with 2D photonic crystalsReference Gjessing, Marstein and Sudbø35 have been shown to have better absorption than those with 3D photonic crystals.Reference Bermel, Luo, Zeng, Kimerling and Joannopoulos22 Photonic crystals also have been considered as intermediate reflector layers by integrating an inverted opal ZnO layer in between the two subcells of a micromorph tandem cell comprised of a top amorphous silicon (a-Si:H) cell and a bottom multicrystalline silicon (mc-Si:H) cell.Reference Bielawny, Üpping, Miclea, Wehrspohn, Rockstuhl, Lederer, Peters, Steidl, Zentel, Lee, Knez, Lambertz and Carius36 DBRs and 3D inverted opals were compared,Reference Bielawny, Rockstuhl, Lederer and Wehrspohn37, Reference O’Brien, Chutinan, Leong, Kherani, Ozin and Zulotynski38 and their relative performance was found to depend on the materials used. For the 3D photonic crystal, both reflection of light due to the PBG and diffraction of light to increase path length contribute to absorption enhancement in the a-Si cell. One-dimensional gratings have also been explored to improve light harvesting in thin-film organic photodiodes.Reference Stolz Roman, Inganäs, Granlund, Nyberg, Svensson, Andersson and Hummelen39
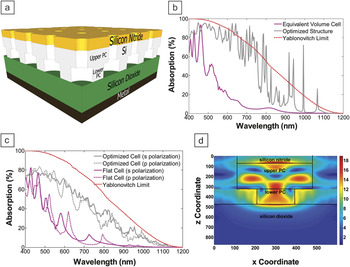
A third way to use photonic crystals for light trapping is to pattern the photoactive layer itself into a photonic crystal (Figure 4c). This approach allows for additional tuning of the mode profiles, which can result in greater field concentration in the photoactive material at the cost of introducing additional surface recombination sites. With optimal design, it is possible to offset the additional surface recombination with increased absorption so that there is a net gain in efficiency. Note that this third approach only works for the case where the photoactive material is thin. Several groups have explored this approach.Reference Bermel, Luo, Zeng, Kimerling and Joannopoulos22, Reference Lee, Huang, Chang and Wu40–Reference Basu Mallick, Agrawal and Peumans46 Patterning of a 100 nm-thick layer of hydrogenated a-Si:H into a planar photonic crystal was first theoretically studiedReference Park, Drouard, Daif, Letartre, Viktorovitch, Fave, Kaminski, Lemiti and Seassal43 and then experimentally demonstratedReference Daif, Drouard, Gomard, Kaminski, Fave, Lemiti, Ahn, Kim, Cabarrocas, Jeon and Seassal44 to result in a 50% increase in absorption over the 380–750 nm wavelength range. A solar cell consisting of a Ge p-n junction and an InGaP window layer patterned into a photonic crystal showed enhancements of the relative external quantum efficiency (EQE) of 22% over a wide spectral range.Reference Prieto, Galiana, Postigo, Algora, Martinez and Rey-Stolle45 We have previously shownReference Basu Mallick, Agrawal and Peumans46 that patterning a 400 nm-thick layer of c-Si into a double-layered photonic crystal shown in Figure 5a increases the integrated short-circuit current by a factor of three when compared to a planar slab with equivalent volume of material (Figure 5b). We also showed that the increase in optical absorption approaches, but is always bound by, the Yablonovitch limit when integrated over all angles of incidence (Figure 5c). Figure 5d shows that at the resonance at λ = 826 nm, the optical electric field is concentrated in the silicon, which leads to an enhancement in absorption.
(a) Schematic of the double-layered photonic crystal in a 400 nm-thick Si slab. (b) Optical absorbance at normal incidence of the photonic crystal structure (gray) as compared to a planar slab of equivalent volume (purple). The Yablonovitch limit is shown for reference (red). The photonic crystal structure beats the Yablonovitch limit in certain spectral regions. (c) Hemispherically averaged absorption for s polarization (when the electric vector is perpendicular to the plane of incidence) and p polarization (when the electric vector is parallel to the plane of incidence) for both patterned (gray) and reference (purple) structures. When integrated over all angles of incidence, the enhancement does not exceed the Yablonovitch limit. (d) Optical electric field intensity profile in an x-z cross-section in the structure at a wavelength of 826 nm.

Instead of removing material from the active layer to form a photonic crystal, nanowire solar cellsReference Kayes, Atwater and Lewis47–Reference Garnett and Yang61 have been explored as a strategy for enhancing light trapping while at the same time reducing the amount of material used. Carrier collection can take place axiallyReference Kempa, Tian, Kim, Hu, Zheng and Lieber58 or radially.Reference Kelzenberg, Boettcher, Petykiewicz, Turner-Evans, Putnam, Warren, Spurgeon, Briggs, Lewis and Atwater60 In the latter case, the carrier diffusion lengths required are of the order of the nanowire radius. Tian et al. demonstrated Si nanowire cells using vapor-liquid-solid growth with a power conversion efficiency of up to 3.4%.Reference Tian, Zheng, Kempa, Fang, Yu, Yu, Huang and Lieber57 Kelzenberg et al.Reference Kelzenberg, Turner-Evans, Kayes, Filler, Putnam, Lewis and Atwater59 demonstrated diffusion lengths of >2 μm in gold-catalyzed, vapor-liquid-solid grown silicon nanowires. The same group demonstrated a peak EQE of 89% in a Si nanowire array photoelectrode.Reference Kelzenberg, Boettcher, Petykiewicz, Turner-Evans, Putnam, Warren, Spurgeon, Briggs, Lewis and Atwater60 Garnett et al.Reference Garnett and Yang61 made large-area, scalable cells by using deep reactive ion etching through a mask of silica beads with a power conversion efficiency above 5% for devices fabricated on 8 μm-thick Si substrates.Reference Garnett and Yang61 As nanowires are grown longer, the periodicity of the nanowire array disappears for most fabrication processes. Exploiting the coherent light-trapping properties of nanowires requires that the nanowire arrays show at least short-range order. A potential advantage of solar cells consisting of arrays of radial nanowire solar cells that is not linked to an increase light absorption is that while absorption occurs along the vertical direction (and depends on the length and areal fraction of the array), carrier collection happens along the radial direction. This means that charge carriers have to travel shorter distances, and carrier collection efficiency improves, possibly at a cost of higher dark currents and hence a reduced open-circuit voltage. Theoretically, at least one studyReference Han and Chen62 concluded that nanohole arrays have an efficiency superior to nanorod arrays for practical thicknesses.
Patterning the photoactive layer has also been studied as a light-trapping strategy in organic solar cells.Reference Duche, Escoubas, Simon, Torchio, Vervisch and Flory63–Reference Tumbleston, Ko, Samulski and Lopez67 Tumbleston et al.Reference Tumbleston, Ko, Samulski and Lopez64 have shown a 14% absorption enhancement when using nc-ZnO 1D and 2D gratings to structure the photoactive region of a polymer/fullerene bulk heterojunction polymer solar cell. Another approach is to nanopattern the polymer photoactive region and fill the voids with an inorganic material to form a photonic crystal with significant refractive index contrast.Reference Ko, Tumbleston, Zhang, Williams, Desimone, Lopez and Samulski66 The resulting hybrid organic-inorganic photonic crystal can be tuned in terms of both periodicity and grating fill factor to optimize coupling of incident light into guided modes. In addition to an absorption enhancement close to the band edge due to resonance effects, the photonic crystal also optimizes the internal quantum efficiency due to a more optimal exciton generation profile.
Metal nanostructures
Metal nanostructures have drawn a lot of attention as a means to trap light in PV cells.Reference Atwater and Polman68, Reference Ferry, Munday and Atwater69 Some of these approaches make use of surface plasmons, which are collective oscillations of conduction electrons near the interface between a metal and a dielectric material. The frequency of plasmon resonances can be engineered by tuning the geometry and through the choice of the metal and enclosing dielectric. A plasmon resonance can either be a mode of limited spatial extent or a propagating mode at the metal/semiconductor interface called a surface plasmon polariton (SPP).
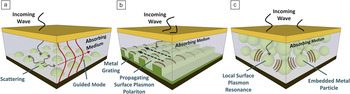
Metal nanostructures can enhance light absorption because they scatter incident light into wave-guided (Figure 6a) or SPP modes (Figure 6b) or due to enhancement of the optical electric field in the vicinity of the nanostructure (Figure 6c). We note that neither scattering nor field enhancement necessarily implies the use of plasmon resonances, which is why the term plasmonic PV fails to be an accurate common description. Plasmon resonances are, in many cases, advantageous because light scattering using localized plasmon resonances is relatively insensitive to the angle of incidence,Reference Ferry, Sweatlock, Pacifici and Atwater70 or because the scattering cross-section of a metal nanostructure can be many times its geometric cross-section under plasmon resonance conditions.
Three light-trapping approaches that use metal nanostructures. (a) Scattering elements couple incident light into quasi-guided modes, which have a higher lifetime in the absorbing material, thus increasing the possibility of absorption. (b) Excitation of surface plasmon polariton (SPP) modes at the metal-dielectric interface. In addition to exciting a quasi-guided mode, this approach also results in optical electric field concentration. Field concentration results in increased absorption, as absorption is proportional to the square of the electric field concentration. (c) Optical electric field concentration due to the excitation of localized surface plasmon resonance results in locally increased absorption.

Since the first reports on the absorption enhancement in silicon waveguides by scattering incident light into waveguide modes using metal nanoparticles,Reference Stuart and Hall71, Reference Stuart and Hall72 variations of this approach (Figure 6a) have been explored. The scatterer can be many wavelengths away from a location where enhanced absorption takes place. Typically, the subwavelength metal scatterers are located outside the active layer to prevent excessive electron–hole-pair recombination. This is a far-field effect that is similar in nature to scattering into quasi-guided modes using a dielectric structure, but it makes use of the high scattering cross-section of metal nanoparticles compared to their dielectric counterparts. It has been shown that shape, size, and type of metal used are key factors determining the efficiency of scattering into the quasi-guided modes.Reference Catchpole and Polman73–Reference Tsai, Wang, Huang, Kiang and Yang76 Comparing mode profiles enables one to predict which modes will be most advantageous for optical absorption enhancement in the semiconductor.Reference Saeta, Ferry, Pacifici, Munday and Atwater12 Particles placed at the back of the devices have been shown to have scattering efficiencies comparable to those in front while avoiding losses due to destructive interference between scattered and unscattered light.Reference Beck, Polman and Catchpole77, Reference Beck, Mokkapati, Polman and Catchpole78
Experimentally, a lot of groups have investigated the use of metal nanoparticles to enhance absorption in solar cells. The desire to control the size and density of the metal nanoparticle array has led to the use of colloidal Ag and Au metal nanoparticles on c-Si,Reference Pillai, Catchpole, Trupke and Green80, Reference Schaadt, Feng and Yu81 a-Si,Reference Derkacs, Lim, Matheu, Mar and Yu82, Reference Matheu, Lim, Derkacs, McPheeters and Yu83 InP/InGaAsP quantum wellsReference Derkacs, Chen, Matheu, Lim, Yu and Yu84 as intermediate reflectors in micromorph tandem solar cells,Reference Fahr, Rockstuhl and Lederer85 and organic solar cells.Reference Kulkarni, Noone, Munechika, Guyer and Ginger86 In addition to metal nanoparticles, another effective approach is to use periodic metallic gratings.Reference Rockstuhl, Fahr and Lederer87, Reference Ferry, Verschuuren, Li, Schropp, Atwater and Polman88 Ferry et al. reported photocurrent enhancements of 26% by nanostructuring the metallic back contact in a n-i-p a-Si:H cellReference Ferry, Verschuuren, Li, Schropp, Atwater and Polman88 using nanoimprint lithography. One drawback of far-field coupling is that the resulting large distance (>10 nm) between the active layer and the metal nanoparticle limits the achievable enhancement in absorption efficiency, which is bound by the Yablonovitch limit, since one does not make use of deep-subwavelength-scale confinement offered by evanescent modes.
In another kind of plasmonic light-trapping geometry, light is converted into SPPsReference Catchpole and Polman89, Reference Ferry, Sweatlock, Pacifici and Atwater70 (Figure 6b). For this to be effective, the absorption of the SPP in the semiconductor has to be stronger than in the metal. Using SPPs to enhance absorption has been investigated in several organic solar cell designs.Reference Mapel, Singh, Baldo and Celebi90–Reference Kang, Xu, Park, Luo and Guo93 This approach may offer enhancements of absorption not bound by the Yablonovitch limit, since it makes use of subwavelength-scale confinement of the optical mode in the active regions. Parasitic absorption in the metal, however, may limit the practicality of this approach.
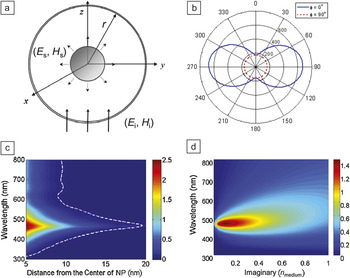
Metal nanostructures can also enhance optical absorption by directly concentrating the optical electric field (Figure 6c). The strongest of such effects are obtained by exciting a surface plasmon resonance, but this is not a requirement. The spatial extent of the enhanced optical absorption is confined to the immediate vicinity of the metal-dielectric interface. In the most straightforward implementation, metal nanoparticles are embedded in the photoactive regionReference Kirkengena, Bergli and Galperin94–Reference Hägglund, Appel and Kasemo96, Reference Shen, Bienstman and Maes107 or in functional layers surrounding the photoactive region.Reference Nakayama, Tanabe and Atwater97, Reference Kim, Na, Jo, Kim and Nah104, Reference Chen, Wu, Lee, Hong, Kuo and Huang108 Increased photocurrents owing to near-field effects have been demonstrated in DSSCs,Reference Kume, Hayashi, Ohkuma and Yamamoto98–Reference Hägglund, Zäch and Kasemo100 CdSe/Si heterostructures,Reference Konda, Mundle, Mustafa, Bamiduro, Pradhan, Roy, Cui and Burger101 InGaN cells,Reference Wang, Tsai, Huang, Chen, Li, Kiang and Yang102 and organic solar cells.Reference Peumans, Bulovic and Forrest103–Reference Lindquist, Luhman, Oh and Holmes106, Reference Rand, Peumans and Forrest109 Lee et al.Reference Lee and Peumans111 provided an analysis and physical interpretation of the origin of the enhancement of the optical absorption of a host material when spherical metal nanoparticles are embedded. For an Ag metal nanoparticle shown in Figure 7a, the intensity of the scattered electric field (E s) increases by >600 times the incident field intensity (E i) at the plasmon resonance (Figure 7b) occurring at λ = 460 nm, but the effect is spatially localized (up to 20 nm, see Figure 7c). Also shown in Figure 7c is that the enhancement persists to a smaller degree at non-resonant wavelengths (e.g., λ > 550 nm), as long as the metal is a good conductor at those frequencies. Since the concentration of the optical electric field is highly localized, the metal nanostructures need to be in close proximity to the active material. To prevent unwanted charge trapping, a thin dielectric coating between the metal nanostructure and active absorber may be required.
(a) Schematic of a metal nanoparticle embedded in an absorber. E i and H i refer to the incident electric and magnetic fields, respectively. E s and H s refer to the scattered electric and magnetic fields, respectively. (b) Ratio of the intensity of the scattered to incident optical electric field as a function of polar angle, θ, when the azimuthal angle φ is 0° (i.e., at the equator, solid blue line) and 90° (dashed red line), respectively, for a 10 nm-diameter Ag metal nanoparticle at plasmon resonance conditions (λ = 460 nm). (c) Logarithm (10 base) of the enhancement of absorbed optical power averaged over a 0.1 nm-thick shell concentric with the metal nanoparticle as a function of shell radius. The shell radius for which the absorption is enhanced by 10% is indicated by a white dashed line. The color bar shows the enhancement in absorption. (d) Logarithm (10 base) of the enhancement in optical absorption efficiency in the region bound by r = 5 nm and r = 10 nm for a 10 nm-diameter Ag metal nanoparticle embedded in a medium as a function of the imaginary part of the refractive index (the real part is set to 1.8).

It should be noted that in many cases, the effects of scattering, coupling into SPP modes, and optical electric field concentration are all simultaneously present to varying degrees. Careful and creative engineering can extract the maximum potential from these light-trapping mechanisms that might each target a different portion of the spectrum.
Other approaches
A very effective way to enhance optical absorption is to use optical spacer layers when the thickness of the photoactive region is limited. This is a common approach in organic solar cells,Reference Lee and Peumans111 where optical spacers can tune the optical electric field intensity so that the majority of excitons are created close to a donor-acceptor interface, where efficient exciton dissociation can take place. This concept was first introduced for small molecule solar cells by using a thin, wide bandgap layer as an optical spacer at the cathode.Reference Peumans, Bulovic and Forrest113–Reference Walzer, Maennig, Pfeiffer and Leo119 Other materials have been exploited as optical spacer layers in organic solar cells, including ZnOReference Gilot, Barbu, Wienk and Janssen120 and TiOx.Reference Kim, Kim, Lee, Lee, Ma, Gong and Heeger121 An organic external capping layer was also shown to be effective.Reference O’Connor, An, Pipe, Zhao and Shtein123 Optical spacer layers have little or no benefits when the thickness of the photoactive region can be optimized without negative effects on electrical behavior.Reference Andersson, Huang, Moule and Inganas124
Semi-transparent mirrors at both sides of a weakly absorbing photoactive layer can be used to coherently trap light over a narrow spectral and angular range and are commonly used in resonant cavity enhanced photodetectors. Agrawal et al.Reference Agrawal and Peumans126 applied this approach to coherently trap light over a broad spectral range by optimizing an aperiodic multilayer coating at the anode of an organic solar cell. The aperiodic coating behaves as an excellent anti-reflection coating in the spectral range where the absorption is strong and as a high-reflectivity mirror with tuned phase response for the spectral range where absorption is weak. Using this approach, a short-circuit current enhancement of up to 40% was predicted for an ultrathin organic solar cell, averaged over all incident angles and polarizations.
Recently, structures have been proposed that can surpass the Yablonovitch limit. GreenReference Green14 proposed a structure consisting of a thin active layer surrounded by cladding layers of a higher refractive index that beats the limit on account of using propagating evanescent modes. Yu et al.Reference Yu, Raman and Fan15 proposed a similar structure where an active material, either in the form of a layer whose thickness is smaller than a half wavelength or as a small inclusion whose size is smaller than a half wavelength, is surrounded by a high refractive index cladding material. The index contrast between the active region and the cladding provides nanoscale field confinement at a deep-subwavelength scale, owing to the Lorentz local field effect. We also note that at resonance, the angle-averaged enhancement of optical absorption near the surface of the Ag metal nanoparticle shown in Figure 7a also exceeds the Yablonovitch limit.
Conclusions
We reviewed coherent light-trapping strategies for thin-film photovoltaic (PV) cells. The approaches considered in this review are photonic crystal PV cells, PV cells with metal nanostructures (sometimes called plasmonic PV cells), and structures with engineered interference effects. The optimal strategy depends on the characteristics of the absorber material and the process constraints. Many of the approaches discussed rely on scattering into quasi-guided modes that can otherwise not be accessed. These are the thin-film equivalents of Lambertian scattering to uniformly occupy the photon density-of-states of the active layer and have the Yablonovitch limit as an upper bound for enhancement. Theory and modeling show that certain novel structures that exploit the deep-subwavelength-scale confinement of evanescent modes are able to surpass the Yablonovitch limit. To experimentally demonstrate the predicted enhancement factors, high refractive index, transparent claddings will be required.
Acknowledgments
Shrestha Basu Mallick and Nicholas P. Sergeant are joint first authors of this article.