Introduction
Supraglacial ponds are a common feature of debris-covered, relatively slow-moving glaciers but their position and size varies markedly between glaciers. Ponds can be a precursor to terminus disintegration by growing and coalescing, to culminate in large proglacial lakes, but they can also disappear from the glacier surface, leaving just a depression behind. The initiation and development of these ponds might be a significant aspect of terminus disintegration (Reference KirkbrideKirkbride, 1993), hence there is a need to understand when and how ponds grow or disappear and what controls their growth or decay.
The process of pond formation at down-wasting, debris-covered glacier termini is reasonably well understood and documented (e.g. Reference KirkbrideKirkbride, 1993; Reference Sakai, Takeuchi, Fujita and NakawoSakai and others, 2000; Reference Benn, Wiseman and HandsBenn and others, 2001). It involves the disruption of the insulating debris mantle by ‘thermokarst erosion’ which exploits the pre-existing englacial drainage network (Reference KirkbrideKirkbride, 1993). Based on the analysis of a pond heat budget, Reference Sakai, Takeuchi, Fujita and NakawoSakai and others (2000) concluded that warmer pond water could enlarge conduits down-glacier from the ponds and subsequent collapse would create further ponds. This positive feedback process would accelerate the ablation rate of debris-covered glaciers. The location of ponds appears to play an important role for the effects of ponds on terminus dynamics. For example, perched lakes (perennial lakes whose surface level lies at a considerably higher elevation than those of other bodies of water directly or closely associated with these) show only limited growth caused by intermittent lake drainage (Reference Benn, Wiseman and HandsBenn and others, 2001), while ponds reaching the englacial base water level tend to grow progressively. The surface gradient of the glacier may be the controlling factor on the formation of supraglacial ponds (Reference ReynoldsReynolds, 2000).
Ponds enlarge predominantly by melting, but coalescence of ponds may eventually lead to a calving terminus (e.g. Reference Chikita and YamadaChikita and Yamada, 2005). The processes involved in the transition from melting to calving into a proglacial lake, however, have remained largely unexplained. In addition, ongoing pond development at glaciers after the establishment of a calving ice face has not received much attention. Understanding the significance of ponds under these conditions may be important for longer-term terminus evolution and prediction of future retreat scenarios.
In order to address these issues, the characteristics and development of supraglacial ponds on Tasman Glacier, New Zealand, have been investigated. The aim is to describe and quantify as far as possible the processes and their controls and to determine the contribution of supraglacial ponds to terminus disintegration.
Site Description
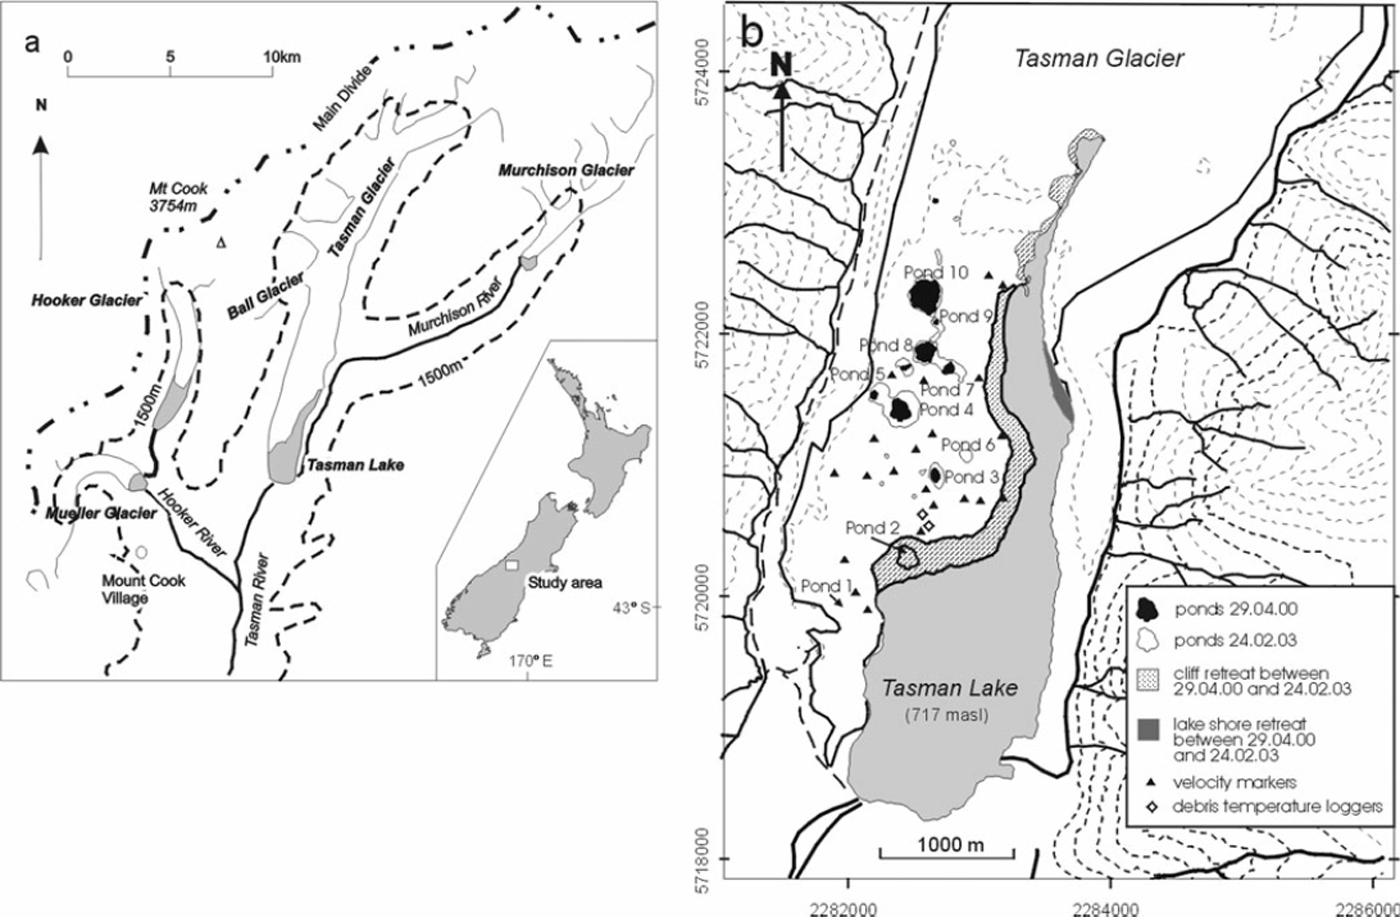
With a length of ∼29 km, Tasman Glacier is the largest glacier in New Zealand and is located on the eastern side of the Southern Alps (Fig. 1a). The debris cover extends from the terminus to ∼8 km up-glacier. Its thickness increases down-glacier from the clean-ice interface to an average of ∼1 m at the terminus, but is generally very variable. Decades of down-wasting resulted in the development of numerous supraglacial ponds. During the 1980s, a pro-glacial lake formed by coalescence of several ponds (Reference KirkbrideKirkbride, 1993), and calving started in the 1990s. In 2003, the lake had a maximum depth of 185 m and covered an area of 3.7 × 10⁶ m2. Supraglacial ponds occurred in a zone between the terminal ice face and ∼13 km up-glacier in 2002. Their sizes ranged from small sinkholes of only a few metres to large water bodies of 200 m diameter. For reasons of accessibility, the study focused on ponds in the immediate terminus area (Fig. 1b). Most of the ponds, in particular the larger ones, are at the same elevation as Tasman Lake (717 m a.s.l.) and appear to be hydraulically connected to the main glacial drainage system. Ponds 7 and 8 have to be distinguished, as their water level is ∼0.5 m above that of the other ponds and obvious currents of up to ∼1 ms−1 were noticed. In all other ponds, only wind-driven surface currents were observed. Pond 1 represents a perched pond with a water level at 743 m a.s.l. and therefore 26 m above that of Tasman Lake. Summer ice velocity in 2001/02 decreased markedly from 96 m a−1 near Ball Glacier to 3 m a−1 at the terminus, both width-averaged.
Location map of Tasman Glacier and measurement sites: (a) study area and Tasman Glacier; and (b) supraglacial ponds in the lower 5 km and locations of measurements (New Zealand Map Grid). Changes in occurrence and size of supraglacial ponds and Tasman Lake are based on ASTER (Advanced Spaceborne Thermal Emission and Reflection Radiometer) images on 29 April 2000 and 24 February 2003.
The climate is largely influenced by westerly airflows from the Tasman Sea resulting in a strong precipitation gradient across the Main Divide towards the east. While annual rainfall on the upper Tasman Glacier is ∼7000 mm a−1, the terminus receives ∼3000–4000 mm a−1. Climate data from Mount Cook Village (NIWA climate station), ∼7 km from the terminus (Fig. 1a), show for 2001 an annual precipitation of 3020 mm a−1, a mean air temperature of 8.0°C, a mean wind speed of 5.0 m s−1 and 13.7 MJ m−2 mean daily global radiation total. The ponds and Tasman Lake are usually frozen over for ∼2 months in winter, but thin surface ice can occur in any season in the morning.
Methods
In order to map morphological changes and record melt and retreat rates, the supraglacial ponds on the lower Tasman Glacier were surveyed between 2001 and 2003. The positions of transects and ice velocities at various markers were measured using a global positioning system (GPS) with a Trimble ProXR/XL receiver. Most measurements were taken in carrier phase mode and all were corrected differentially using the continuous Annette Plateau and Kara GPS stations as base stations. These are located within 10 km of the rover measurements. The horizontal accuracy was ∼±0.35 m and vertical accuracy ∼±0.65 m. A total of 24 transects perpendicular to the cliff/slope edge were established at ponds 1, 2, 3 and 4 to determine the retreat rates of different cliff and slope types (e.g. Figs 1b, 2, 8 and 9). At each visit, changes in slope angle were recorded using an inclinometer and the condition of the slopes was noted. The retreat rates corresponded to ice melt at the pond walls except for pond 2, where calving accounted for some of the retreat.
For comparison, vertical ice loss by sub-debris melt was also determined. Due to problems establishing ablation stakes, quantification is based on the temperature regime through the debris cover. Two pits (see Fig. 1b for locations) were excavated in 0.9 and 1.0 m debris thickness, and a total of ten thermistors installed at the ice-debris boundary, at 0.10, 0.30 and 0.50 m above the glacier ice, and near the surface between boulders. All were connected to Campbell CR10 data loggers which recorded at hourly intervals with an accuracy of ∼±0.1°C. Due to computer or logger problems, some gaps exist in the data; recordings from pit 1 provide the most complete record for a period of over 2.16 years.
Water temperatures, in conjunction with currents, are key parameters for ice melt and were obtained by recording vertical profiles at several locations in ponds 1, 2, 3 and 4 between 2001 and 2003 and by hourly monitoring in ponds 3 and 4, which enabled the investigation of both the spatial and temporal variations. Vertical water temperature profiles were taken with a hand-held digital thermometer connected by a 10 m cable to a thermocouple, which restricted measurements to a water depth of 10 m. The final set of measurements in 2003 was taken with a 50 m long cable connected to a thermistor after these became available. The accuracy in both cases was ±0.1 °C. For continuous monitoring of water temperatures over several months, sealed temperature loggers were used with an accuracy of ±0.2°C. Two data loggers were programmed to sample temperatures at the surface and 10 m water depth every 60 min. They were connected to a rope which was anchored in the pond. The rope with the anchor had to be retrieved and redeployed in order to download the data loggers with an optic shuttle. This resulted in slight variations of the measurement location.
Bathymetrical surveys were conducted on several ponds concurrently with the water temperature profiles using a Hummingbird 200 kHz single beam echo sounder from a small inflatable boat. Vertical measurements of water depths had an accuracy of ±1 m over a range from 5 to 125 m. As the small size of the boat prohibited the use of GPS, positions were approximated by using transects and features onshore and a laser rangefinder (LASERACE 300) to determine the distance from selected points. No practical solution was found to measure water currents in the ponds. Comparison between the levels of the ponds was also achieved with conventional ground surveying and a bubble level. Ground and aerial photography was used to document pond development over different time periods. ASTER (Advanced Spaceborne Thermal Emission and Reflection Radiometer) satellite images from 29 April 2000 and 24 February 2003 served as a basis to determine pond growth and development over a 3 year period. The images were geo-referenced with both ground-surveyed control points and control points taken from the New Zealand topographic map series 260-H36. Comparison of the position of the Tasman ice cliff derived from remote sensing and from ground surveying shows an overall accuracy of ∼15 m. As a consequence, supraglacial ponds may only be detected if they are >∼200 m2.
Results
Limnological observations
Major rain events resulted in a substantial water-level rise in Tasman Lake and in most of the supraglacial ponds, where records of temporarily increased water levels corresponded to the height at the lake, giving evidence of the connection of the ponds to the main glacial drainage system.
Water temperatures in supraglacial ponds show distinct diurnal, seasonal and spatial variability. The data also indicate small differences between ponds in summer water temperatures. These were highest in pond 1, which is the smallest pond with the shallowest water depth. The lowest temperatures were recorded in the larger and deeper ponds 3 and 4. Furthermore, these two ponds have a steep subaqueous relief in places where bare ice is in direct contact with pond water, thus reducing water temperatures (Fig. 2), whereas normally the subaqueous slopes are predominantly <37° and are debris-covered.
Map and bathymetry in November 2001 of (a) pond 3 and (b) pond 4 with locations of measurements. Light-grey shaded areas show the walls/slopes in November 2001. Dates are dd.mm.yy.
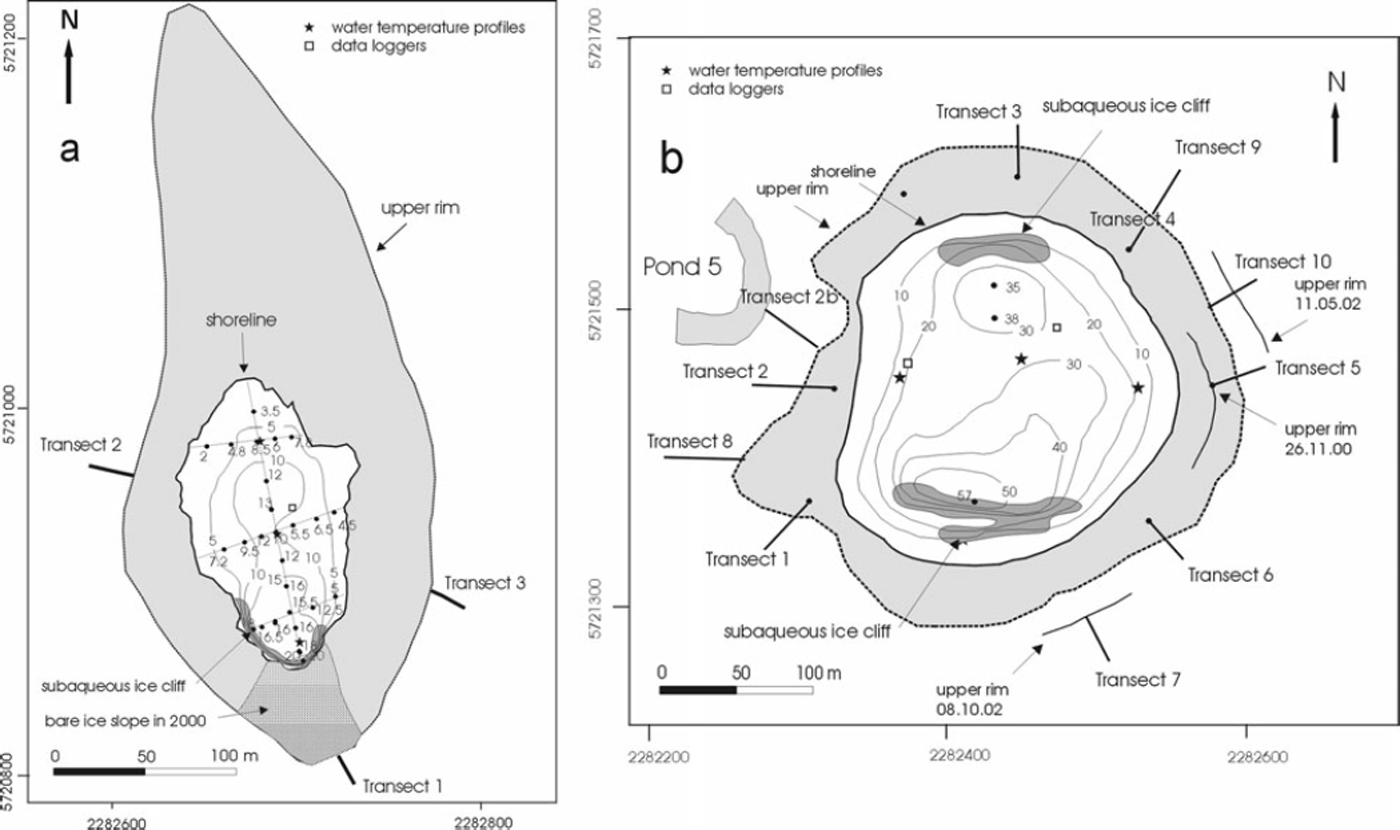
Vertical water-temperature profiles reveal some spatiotemporal variability that differed between ponds. Profiles taken in pond 1 in November 2001 show a gradual temperature increase towards the ice cliff and a slight decrease with depth (Fig. 3). By January 2002, after the water level had dropped >1 m and the pond area decreased by ∼65%, water temperatures had risen markedly and a strong increase in temperature with distance from the ice cliff could be observed at the surface. In ponds 3 and 4, the difference in temperatures was up to 2°C between different locations but this changed over time (Figs 4 and 5). The ponds were almost isothermal with depth (<0.2°C variation) and showed no or very little sign of surface warming. In both cases, temperatures appeared to be reduced near the areas of subaqueous ice cliffs (Figs 2 and 4) and tended to be higher in shallower areas. In contrast, little variation with either depth or location was recorded in pond 6, where the temperature ranged between 1.7 and 2.2°C in March 2002. The bathymetry revealed a relatively regular bowl shape, slightly deeper towards the south where the maximum depth of 23 m was found.
Vertical water-temperature profiles in pond 1 on (a) 6 November 2001 and (b) 23 January 2002, showing a pronounced rise in temperatures after a 1 m drop in water level. Note that the ice cliff is in the northern area.

Spatio-temporal variations in water temperatures in pond 3: (a) 10 November 2001, (b) 7 January 2002, (c) 14 February 2002, (d) 7 March 2003 and (e) 24 November 2003. The ice cliff is located in the south.

Characteristics of water temperatures in pond 4 over 1 year.

Hourly monitoring of water temperatures in ponds 3 and 4 revealed some seasonal variations, albeit within a relatively small range (Table 1). Pond 3 was generally colder, and, interestingly, water temperatures were slightly higher at depth than at the surface. During the warmest months December–March, the variability was highest (Fig. 5). Annual average temperature in pond 4 at the surface and at 10 m water depth was 1.1 and 0.8°C, respectively. On a diurnal scale, water temperatures at the surface follow closely the fluctuations of the incoming solar radiation and air temperature, which results in a conspicuous diurnal pattern (Fig. 6).
Seasonal average water temperatures in ponds 3 and 4, based on hourly monitoring data (standard deviation in parentheses)

Water temperatures in pond 4 in relation to air temperature, global radiation and rainfall over 1 week in January 2002.

Ice loss processes
Most of the ponds on the lower Tasman Glacier grow by back-melting of the surrounding walls. The annual average retreat ranges between 7.3 and 26.0 m a−1 (Table 2), largely controlled by the nature and amount of debris on the slopes. The threshold above which an ice slope cannot support substantial gravel cover is 38°. At greater angles, only a thin, slushy layer of sand or smaller deposits can be maintained. The angle and cover of the pond walls often changes over time, but the development of vertical or near-vertical ice cliffs is only possible once calving has commenced (see below). Summer retreat rates of all kinds of slopes are significantly higher than winter rates (3–5 times). While the slope angle affects the retreat rates through the feedback with the debris cover, no obvious influence of the slope aspect could be found from all transect measurements.
Retreat rates on different slopes around supraglacial ponds

In contrast to the direct measurements of ice loss by slope retreat at ponds, ice melt rates under debris, both by conduction and advection, were calculated. In order to calculate the rate of these processes and infer sub-debris ice melt, the method of Reference McSaveneyMcSaveney (1975) was adopted, which uses the temperature gradient within the debris layer. Ice melt by conduction can be calculated by using

where k d is the thermal conductivity of the debris layer, T 0 is the temperature of the debris surface, h d is the debris layer thickness, L is the latent heat of fusion of ice and ρ i is the density of ice with dispersed debris. The variation of monthly rates is shown in Table 3, based on monthly average thermal gradients and a thermal conductivity for the debris of 1.8 W m−1 K−1. Taking the seasonal variation into account, the annual average melt by conduction is 1.79 m a−1.
Monthly average melt under debris layer by conduction Q c, calculated with Equation (1)

The amount of ice melted by advective heat transfer (Q a) can be calculated as

where T w is the water temperature in the lower 25% of the debris layer (°C), c w is the specific heat capacity of water and m w is the precipitation. It is assumed that the temperature of percolating rainwater equilibrates with that of the debris where this cover is thick, and thus water temperature equals that of the lower debris layer. Using an average daily rainfall of 10 mm and an average temperature of 1.21 and 1.08°C within the lower 0.25 m of the debris layer in two consecutive years, Equation (2) yields 0.06 and 0.05 m a−1.
The submerged parts of the ponds are also subject to melt under debris. Most slopes with angles <38° are likely to be covered by a debris layer similar in thickness and nature to that of their immediate surroundings plus some sediments settled out from suspension. The amount of finer sediments from suspension depends on the permanency and size of the water bodies and their hydrodynamic characteristics. The permeability of these submerged sediments can be regarded as negligible, so heat transfer is likely to be by conduction alone (Equation (1)). A thermal conductivity k d = 1.3 W m−1 K−1 was used according to

where k r and k w are the thermal conductivities of rock and water, respectively. Values for porosity between 50 and 60% were taken from sediment trap data from Tasman Lake (unpublished data). With a mean water temperature of 1°C and a layer thickness of h d = 0.9 m, the subaqueous melt is in the order of 0.15 m a−1. This first estimate of the melt rate may even be smaller, as h d is likely to be higher.
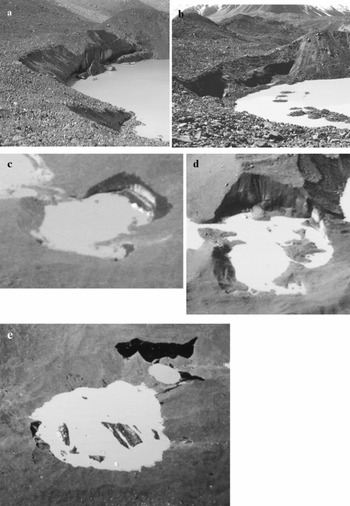
A further form of ice loss at the ponds is calving, which occurred both subaerially and subaqueously but was generally limited to isolated, relatively rare events. Subaerial calving during the study period was observed in ponds 5 and 8 after substantial thermo-erosional notch development. Calving types included waterline, slab and flake calving. Both ponds were connected to an adjoining, larger pond at the time of calving (see Figs 1b and 7). However, calving ceased in pond 8 in October 2002, and the calving ice wall was gradually covered with gravel. Shallow water depth and correspondingly higher water temperatures in conjunction with water circulation might have caused the onset of calving in a way described by Reference RöhlRöhl (2006). However, shallow water also prevented the calved ice blocks from being removed, so water circulation was largely restricted. Debris was able to accumulate around the melting ice blocks, and the bare ice wall gradually changed into a low-angle gravel slope (Fig. 7). Where subaerial calving occurs, annual cliff retreat rates are between 20 and 50 m a−1 . Subaqueous calving was observed on several occasions and involved a large range of ice volumes. At the smallest scale, rocks falling into the pond may result in small pieces of ice emerging at the surface. On a larger scale, icebergs with a length of several metres to several tenths of metres can occur (Fig. 7e). In pond 2, increases in water depth of >20 m within a year indicate substantial subaqueous calving as the cause.
(a–d) Calving ice walls at pond 8: (a) northwest part on 29 December 2001; (b) northwest part on 8 October 2002, illustrating the cessation of calving, increased debris cover and lowered slope angle; (c) southeast part on 25 February 2003; (d) southeast part on 18 March 2004, showing the cessation of calving and the establishment of a high, steep melting ice wall. (e) Icebergs in pond 10 as evidence of recent subaqueous calving on 18 February 2001. Pond diameter is ∼250 m.

Wherever subaqueous ice cliffs exist, at slopes with angles of >38°, these can be assumed to show bare ice. Given the lack of current measurements or bathymetrical surveys of sufficient accuracy, subaqueous melt rates were estimated using

where v m is the melt rate and T w the water temperature (Reference Russell-HeadRussell-Head, 1980). With an annual average temperature of 0.8°C, the melt rate would be 4.7 m a−1.This is regarded as a minimum estimate, as ice melt by convection, depending on current velocity, is likely to be considerably higher.
Pond evolution
Based on the analysis of the ASTER images, the pond area in the lower 3 km of the terminus shows an increase of 141% or 138 000 m2, with a contribution of some 14 000 m2 from new ponds (Fig. 1b). The total perimeter increased by 86% or 2750 m (new ponds accounted for 1000 m). The biggest changes occurred at ponds 8 and 9. Despite the substantial changes at pond 2, it had to be excluded from the calculations, as it did not represent supraglacial ponds after the connection to Tasman Lake (see below). Assuming a regular round shape for the ponds, the change in radius can be compared to wall retreat measured by ground surveying. Averaged over the 2.82 years from the interval between the ASTER images, ponds 3, 4 + 5, 7, 8, 9 and 10 increased their effective radii by 10.6, 27, 14.5, 11.7, 12.5 and 5.7 m a−1, respectively. Even though these calculations are based on an idealized shape, which scarcely approximates the irregular and variable form of the ponds, the range of pond-growth rates is close to the average annual retreat rates of debris-covered and bare pond walls derived from ground surveying of 7 and 22 m a−1, respectively. Accordingly, the ASTER results provide the highest rates at ponds 4 and 5 that have the highest percentage of bare ice walls, and the lowest for ponds 3 and 10 with their almost entirely debris-covered slopes. In contrast, pond 1 gradually disappeared through successive drainage and reduction of bare ice area (Fig. 8). This was accompanied by a trend of decreasing slopes with progressive back-melting.
Evolution of pond 1 between October 2001 and February 2003, showing the progressive drainage of the pond and reduction in bare ice area on: (a) 1 October 2001, (b) 6 November 2001 after 37 days, (c) 15 December 2001 another 39 days later, (d) 5 January 2002 after another 20 days, (e) 14 February 2002 after 40 more days, (f) 12 May 2002 after another 87 days, (g) 1 October 2002 another 142 days later, and (h) 22 February 2003 after another 144 days.

Further up-glacier towards the Ball Glacier confluence, supraglacial ponds differed in size and development from those in the terminus area. While most ponds at the terminus enlarged significantly with time and eventually coalesced, ponds up-glacier occurred in considerable numbers but growth was restricted and many disappeared and new ones emerged. The number of up-glacier ponds detectable on the ASTER satellite images increased from 18 to 30, while the total area increased from 16 600 to 34 300 m2, representing an increase of 106%. However, the range of pond area grew from 220–2570 m2 in 2000 to 330–3900 m2 in 2003, with the largest pond showing an increase by only 52%.
Capture of a pond by the lake
Observations of the joining of pond 2 with the lake revealed the effects of this process on limnological properties and ice loss processes. In November 2000, pond 2 was shallow, covering ∼5000 m2 and still separated from the lake by a 20 m ice barrier. The surrounding slopes were mostly debris-covered, with angles of ∼25–30°. Only the northern and southern slopes showed some bare ice at angles of ∼40–45°. The separating ice bridge was vertical at the lake-facing side, but during the last 2 weeks of November the ice cliff started bending towards the lake, developing an overhang due to ice deformation. The upper parts of the ice cliff progressively calved within the next 2 weeks until only a low ridge of ice remained which was reduced by melting prior to the joining of the pond with Tasman Lake at the end of December. By mid-January 2001, the connecting channel was ∼15 m wide, allowing boat access into the former pond (Fig. 9). Water depths were generally a few metres in the eastern part but reached a maximum of 14 m in the northwestern area. Towards the lake, a subaqueous ridge at 4 m water depth existed beyond which water depths dropped to 94 m at a distance of 40 m from the pond entrance. Water temperatures in the deeper northwest area in January 2001 were isothermal around 1°C but reached almost 2°C in the much shallower eastern part.
Map and bathymetry of pond 2 with locations of measurements (New Zealand Map Grid), showing the successive retreat of the pond wall. Water depths are shown in January 2001 and December 2001 (in parentheses). Dates are dd.mm.yy.

The pond area enlarged by back-melting (summer and winter rate of 0.08–0.11 and 0.019 m d−1, respectively) of the surrounding walls, which had mostly developed bare ice slopes by November 2001. At this time, slope angles ranged between 36 and 48° and wall heights between 9 and 13 m. Increasing thermo-erosional undercutting was observed and notch formation rates ranged from 0.3 to 0.5 m d−1 in December 2001 (Reference RöhlRöhl, 2006). Calving started at the end of December at the northern and eastern sections, which left the ice cliff with vertical or partially vertical slopes. Water depths then reached up to 34 m in the northwestern area but remained only a few metres in the central and eastern part. Water temperatures ranged mostly between 2 and 3°C throughout the now considerably enlarged pond area, showing higher temperatures in the eastern and northern area compared to the rest of the pond. A slight trend of decreasing water temperatures with decreasing water depth could be noticed. On another occasion in December 2001, temperature profiles showed a distinct thermocline between 2 and 3 m water depth, while spatial differences were smaller except for the surface. Below 4 m water depth, isothermal conditions around 2.6°C existed while surface temperature reached >5°C.
During December and January the pond enlarged considerably at a rate of 0.14–0.29 m d−1, and by February 2002 all ice walls around the former pond were actively calving and had mostly vertical ice slopes. Water temperature profiles taken in the lake at different distances towards pond 2 in January 2002 showed higher temperatures below a water depth of 1 m than in the pond (3.5 and 2°C, respectively). While a distinct thermocline between 10 and 20 m water depth (3.5–0.3°C) was present in the lake and at the pond entrance, temperatures within the pond decreased only slightly with depth.
Throughout the summer of 2002/03, the western corner calved more often and the main ice cliff retreated slightly faster by calving than the former pond walls. This resulted in a smoother cliff line in plan view and increasingly removed evidence for the existence of the former pond. In summary, the joining of the pond with the main lake had two major consequences: a change in the pond’s limnological conditions towards higher water temperatures, increased wave exposure and water movement, and the onset of calving. The limnological changes augmented the thermal undercutting of the ice cliff, permitting calving of the subaerial face. As a result, the retreat of the surrounding walls accelerated. The average retreat rates of the northern half of the pond increased steadily from around 11 m a−1 of melt under partial debris cover to a retreat by calving and melting of 34 m a−1 in summer/autumn.
Discussion
Nature of supraglacial ponds
As shown here for Tasman Glacier, supraglacial ponds vary greatly in location, size, geometry, limnological properties and evolution. With respect to water temperatures, a trend of increasing temperatures with increasing size is present. One might also expect that water bodies with a higher water depth/area ratio have lower temperatures and vice versa because of relative differences in subaqueous bare ice exposure and absorption of solar energy. However, the present data do not support this hypothesis. Furthermore, the cover and slope angles of the surrounding pond walls do not appear to exert a major influence on average temperatures, as no clear difference is apparent between ponds with mostly debris-covered walls and ponds with steeper, partly bare ice slopes. Although few data from other supraglacial ponds exist with which to compare the present results, a small pond of 385 m2 on Lirung Glacier, Nepal (Reference Sakai, Takeuchi, Fujita and NakawoSakai and others, 2000), showed similarly high water temperatures and diurnal variability compared to data from pond 1 in this study. This might emphasize the significance of absolute pond size and water depth for the thermal regime of a supraglacial pond.
The location and size of ponds is largely controlled by surface gradient and ice velocity. As shown in Table 4 for New Zealand, only glaciers with surface gradients well below 2° have well-developed supraglacial ponds, while at glaciers with higher gradients ponding occurs laterally and is mostly small with the exception of LaPerouse Glacier. This glacier has developed large, lateral ponds in an area with a surface gradient of ∼2.8°. It appears that the threshold for the existence of truly supraglacial ponds, which do not predominantly owe their existence to ponding against moraine walls, is <2°, supporting earlier observations (Reference ReynoldsReynolds, 2000; Reference QuinceyQuincey and others, 2007). Only these very low-gradient glacier tongues are affected by ponds with respect to ice loss and terminus evolution in the long term.
Debris-covered glaciers with proglacial lakes and the occurrence of supraglacial ponds on glaciers in New Zealand in 2003

Large ponds additionally influence the rate and direction of ice flow locally. Temporary and/or laterally, small ponds do not have a significant affect on glacier dynamics. It is interesting that, on Tasman Glacier, ponds exist in areas where ice velocity reaches 80 m a−1.However, in these areas they do not persist for a long period. While the total pond area increased, pond evolution is much more dynamic than at the terminus. This is probably due to the much higher ice flow in this area, causing increased stresses on pond walls and leading eventually to drainage.
It is evident that, besides surface gradient and ice velocity, the further development of ponds depends largely on their hydraulic connection to the englacial drainage system, which in turn is largely determined by the position of englacial conduits and the supraglacial topography. Other factors such as debris cover, climate and limnological parameters are important controls once a growing pond has been established. The subaqueous topography is in turn determined by surface topography (slopes, debris cover) and the extent of ice collapse at the initiation of a pond. Once formed, three types of supraglacial ponds can be distinguished:
Type A – perched ponds which lie above the level of the englacial drainage system (e.g. pond 1)
Type B – ponds which are hydraulically connected to the main drainage system (e.g. pond 3)
Type C – ponds which constitute an active part of the drainage system and feature noticeable currents with flow velocities >0.02 m s−1 (e.g. pond 8).
The type determines if the pond is an ephemeral feature with a limited contribution to ice loss (type A) or a relatively permanent feature, which contributes to longer-term terminus disintegration (types B and C). The hydraulic connection affects the modes and the quantity of ice loss within the ponds (Table 5). In addition, a distinction between high-and low-relief ponds can be made, as the subaerial and subaqueous topography affects the rates and relative significance of ice loss processes. The varied and dynamic nature of supraglacial ponds makes a definition of categories that are mutually exclusive difficult. Furthermore, during its evolution, the geometry and hydraulic connection of a pond might change, causing a change in pond type as classified here. The same applies to the differentiation between limnological conditions of supraglacial ponds and a proglacial lake, which is ultimately a gradual progression.
Examples of different types of ponds and their contribution to ice loss

Contribution to ice loss at the terminus
Ice loss from supraglacial ponds is difficult to determine due to the varying shape and spatio-temporal changes in slope geometry and debris cover. Therefore it should be regarded as an estimation and it increases with pond enlargement, which is a non-linear process. The most noticeable form of pond expansion and largest component of ice loss is the subaerial wall retreat (Fig. 10). An ice loss of 820 000 m3 a−1 was calculated using the average radius increase over 2.8 years of 13.7 m a−1, an average wall height of 15 m and a total wall length of 4000 m. A more detailed picture emerges from the separate calculation of ice loss on bare ice and debris-covered pond walls based on annual average melt rates of 7 and 22 m a−1, respectively. About 20% of the total pond wall area is bare ice, but melt on these slopes accounts for 42% of the total subaerial ice loss from pond walls. While total ice loss increases with pond growth as a greater area of walls is successively exposed to melt, the increase of pond area and perimeter slows with pond growth. Subaerial calving constitutes a very small fraction of total ice loss at ponds, as it occurs in isolated, relatively rare events, making an estimate of annual average rates difficult. The estimated calving volume of 5000 m3 a−1 is naturally subject to large interannual variations, depending on the state of pond development.
Ice loss components at supraglacial ponds on Tasman Glacier. Note that subaqueous melt is a minimum estimate and calving occurs very irregularly.

The estimation of ice loss processes at ponds below the waterline is particularly difficult, as direct measurements were not possible and observations were scarcer. Based on the area of subaqueous bare ice from bathymetrical maps of ponds 3, 4 and 6, a volume loss of ∼35 000 m3 a−1 is indicated, with a melt rate of ∼5 m a−1. Ponds 5 and 7–10 are also likely to have subaqueous bare ice slopes, and limnological conditions might differ in terms of temperature, currents and water depth. Accordingly, ice loss by subaqueous melt is likely to be substantially higher. This applies particularly to pond 7 which, according to the classification system, is of type C, being a part of the active drainage system with substantial currents. However, even if current measurements were available, it would be questionable if equations developed for icebergs (e.g. Reference Weeks and CampbellWeeks and Campbell, 1973) would be applicable under these conditions.
For the estimation of subaqueous melt under debris, an area of 90% of the total pond area is assumed to be debris-covered at ponds where the bathymetry and area of subaqueous ice is unknown, and an average water temperature of 1°C was used for all ponds. The relationship to water temperatures is linear, so using a higher temperature of 2°C would not render the contribution of this process more important. Even though difficulties exist in determining the thickness and constitution of the subaqueous sediments and debris, the significance of this form of ice loss is low. Calculations indicate a volume loss of 17 000 m3 a−1 or 2% of total ice loss.
Subaqueous calving appears to be more significant, although its estimation encounters the same problems as with subaerial calving. Calving events are relatively rare and irregular in terms of size and occurrence, and their significance varies substantially between ponds. Volumes of up to 500 000 m3 a−1 estimated here are therefore just an indication of the range of possible contribution to ice loss. However, subaqueous calving indirectly increases ice loss by melt through exposing bare ice below the waterline.
The total ice loss at supraglacial ponds on Tasman Glacier calculated with the outlined assumptions was ∼0.9 × 10⁶ m3 a−1. The largest uncertainty is introduced by subaqueous melt and calving so that this value has an estimated error of ±0.1 × 10⁶ m3 a−1 . This ice loss occurred over an area of ∼0.22 × 10⁶ m2 if the area of adjacent walls is added to the pond surface area. Without ponds, these areas would have been subject to vertical melt under a supraglacial debris layer at a rate of 1.85 m a−1 based on long-term temperature gradients. The resulting 0.41 × 10⁶ m3 a−1 of ice loss by sub-debris melt are less than half the loss at supraglacial ponds. Considering the diversity of ponds investigated in the present study, this proportion is a good indication of the magnitude of ice loss increase by the existence of supraglacial ponds. The significance of ice loss at ponds obviously increases with their size and the ratio of pond area to other debris-covered glacier surface area. Here, the terminus area is defined as the glacier and lake area up to the northern tip of the lake, yielding a debris-covered glacier surface of ∼5 × 10⁶ m2. No bare ice cliffs were present without ponds. Absolute ice loss due to sub-debris melt was then 9.5 × 10⁶ m3 a−1, and ice loss at supraglacial ponds accounted for 10%. With respect to the total ice loss at the terminus, ponds account for ∼4%.
A much greater proportion of ice loss is due to lake ice edge calving and melting. The significantly higher ice loss rates at the lake-facing ice cliff are largely caused by ongoing calving in conjunction with substantial subaqueous melt. Compared to the proglacial lake, ice loss at ponds, even with the uncertainties of subaqueous melt rates, is clearly dominated by subaerial processes, whereas subaqueous ice loss is the most significant, with 71% at the lake, based on data from repeated bathymetries. Lower water temperatures and less water circulation are likely to reduce subaqueous melt in supraglacial ponds. Waterline melt in particular is mostly not sufficient to cause progressive undercutting of the pond walls and consequently a positive notch formation rate that eventually leads to subaerial calving (Reference RöhlRöhl, 2006). Exceptions are the joined ponds where enhanced water currents lead to deeper undercutting and some localized calving. In absolute terms, the estimated subaqueous ice loss at ponds with 0.1 × 10⁶ m3 a−1 is only 1–2% of that at Tasman Lake of ∼7.5 × 10⁶ m3 a−1.
Transition from melting to calving
Observations from supraglacial ponds at Tasman Glacier indicate the four key factors of water temperature, water currents, debris supply and water depth to be central to the initiation and maintenance of subaerial calving. Analogous to calving at the lake ice face (Reference RöhlRöhl, 2006), thermal undercutting at supraglacial ponds has been identified as a precursor to subaerial calving. However, undercutting is often interrupted or terminated by accumulation of debris at the foot of the pond wall and is mostly not effective enough to undercut the ice to the point where collapse of overlying ice can occur. Accumulation of debris is facilitated by a shallow subaqueous topography, so it is more likely to occur here than at the main ice face at the lake where water depths are generally greater. Comparatively shallow water also inhibits the transition from gently sloping debris-covered pond walls to bare ice faces, as debris accumulation is enhanced and the chances of development of bare ice slopes are reduced.
The threshold at which subaerial calving commences is determined by the limnological factors of temperature and currents. An indication of this threshold is water temperatures of >∼1–2°C, depending on water currents, which may need to exceed ∼0.1 m s−1 to cause effective undercutting. However, given the uncertainties, this is a crude estimate which could be considerably improved when data on water currents are available.
The connection of ponds or their joining with the lake are two occasions when water temperature and currents passed the threshold, resulting in progressive undercutting of the ice cliff and eventually calving. In general, subaerial calving occurs mainly at ponds of type C, which constitute an active part of the drainage system and have noticeable currents. Ponds of types A and B do exhibit thermal undercutting, but this is not sufficient to induce calving. For a notch to be persistent but not growing, the melt rate in the notch needs to be about equal to the rate of subaerial cliff retreat, which is 22 m a−1 on average. Accounting for water-level fluctuations in ponds of type B, the effective melt rate would be ∼18.3–36.5 m a−1 higher. The lower effective summer melt rate in ponds of ∼43.8–62.1 m a−1 compared to the rate from notches at Tasman Lake of ∼54.8–146 m a−1 (Reference RöhlRöhl, 2006) can only partly be explained by slightly lower water temperatures in the ponds. The majority of the higher melt in the lake is likely to be caused by water currents. This is supported by the fact that calving only occurred after a significant increase in size by joining another pond or the lake. Ongoing calving only developed at the former pond 2 eleven months after the connection to Tasman Lake. However, calving rates were still lower at the former pond than at the main ice cliff, a fact again likely to be due to less water circulation.
Though infrequent, the size of subaqueous icebergs reported here indicates subaqueous calving to be a significant process in the evolution of supraglacial ponds. Its importance for pond growth lies in the effective removal of ice, which applies to all calving processes, and the fact that subaqueous calving enlarges the pond volume and the bare ice area that is subject to enhanced subaqueous melt. This would be particularly important for ponds with stronger water currents. At ponds on Ngozumpa Glacier, Nepal, Reference Benn, Wiseman and HandsBenn and others (2001) regarded subaqueous calving as infrequent and of minor importance as a mechanism of growth. It might thus not be the magnitude of ice loss that determines the significance of subaqueous calving but rather its role in facilitating other ice loss processes in the evolution of ponds. Observations indicate an important process link between subaerial and subaqueous calving, which depends on the evolutionary state of the pond. Subaqueous calving occurred first and may be a precursor to initiate ongoing calving (both subaerial and subaqueous) by increasing water depth and affecting the limnological properties.
Implications of pond growth
Due to the relatively large combined perimeter and, at least initially, shallow water depths of supraglacial ponds, subaerial ice loss processes are more important than subaqueous processes, resulting in pond growth in primarily the horizontal dimension. Although ice loss at supraglacial ponds is substantially lower than that at the main ice cliff, pond enlargement in predominantly horizontal extent has important consequences for the terminus evolution. First, deeper and larger ponds can increasingly affect the surrounding ice by altering the stress regime, leading to crevasse development and subsequent exposure of bare ice. Second, ice loss rates increase, and third, the presence of ponds at the glacier surface influences the buoyancy of the terminus significantly. If the volume of a depression occupied by a pond were substituted with ice, the overburden weight would increase in the order of 10 t m−2. Buoyancy calculations are shown in Table 6 for two examples. The calculation is based on ice filling the water body of the pond and the overlying air space up to the top rim of the pond. All parameters are averaged and the shape of the pond is idealized to be round. Pond enlargement over time therefore increases buoyancy up to a threshold when the whole terminus may become buoyant. This might accelerate terminus disintegration significantly by changing the stress regime and mode of ice loss by calving similar to the mechanism deduced by Reference Warren, Benn, Winchester and HarrisonWarren and others (2001) from observations at Glacier Nef, Chile.
Examples of change in density and buoyancy through existing ponds

Conclusions
Supraglacial ponds contribute to glacier terminus disintegration firstly by exposing ice faces and, through growth, enlarging the area of bare ice that is susceptible to rapid back-melting. Once formed, three types of supraglacial ponds can be distinguished. Perched ponds (type A) lie above the level of the englacial drainage system, have a very limited contribution to ice loss and may disappear. Ponds that are hydraulically connected to the main drainage system at the same base water level (types B and C) show persistent growth with increasing possibility of joining and even changing from a type B to a type C (active part of the drainage system with noticeable currents). Subaqueous calving plays a central role in the evolution by exposing bare ice and deepening the ponds, with consequences for the limnological properties. While in the early stages ponds enlarge predominantly in the horizontal dimension by subaerial melt, enhanced water temperatures and currents in deeper and larger ponds may initiate the transition from melting to calving. This is particularly likely in the events of ponds connecting or joining the proglacial lake, and increases ice loss rates significantly.
Acknowledgements
I thank W. Anderson and R. Bach for help in the field. Support from the University of Otago Department of Geography is gratefully acknowledged. I also thank D. Benn, B. Brooks and M. Gudmundsson, whose valuable comments and suggestions helped improve the manuscript.