Implications
Precision feeding systems providing diets tailored daily to the requirements of each pig in the herd can contribute to significant reductions in feed costs and nutrient excretion. The results of this study contribute to the development of the numerical procedure used for the real-time estimation of lysine requirements in growing–finishing pigs and demonstrate that the factorial method currently used to estimate these requirements can be used in precision feeding systems. The proposed method accounts for the slight genetic differences in feed intake and growth observed in this study, but this ability remains to be validated with animals of heavier weights and larger genetic differences.
Introduction
Feeding accounts for more than 65% of the costs of producing pigs. Currently, the majority of feeding programs for growing–finishing pigs consist of two or more feeding phases, during which the nutritional composition of the feed is established according to the requirements of a representative pig of the herd. Given that pigs’ nutritional requirements vary depending on their sex, age, weight and production potential (Brossard et al., Reference Brossard, Dourmad, van Milgen and Quiniou2007), using a single feed within each feeding-phase means that some pigs will be underfed, leading to reduced growth performance, whereas others will be overfed, resulting in nutrient wastage. Precision feeding addresses these issues by providing each pig in the herd with feed tailored to its specific requirements on a daily basis (Pomar et al., Reference Pomar, Hauschild, Zhang, Pomar and Lovatto2009; Hauschild et al., Reference Hauschild, Lovatto, Pomar and Pomar2012; Pomar et al., Reference Pomar, Pomar, Rivest, Cloutier, Letourneau-Montminy, Andretta and Hauschild2014). With this approach, it was estimated that herd protein supply could be reduced by 25%, nitrogen excretion by 38% and feeding costs by 11% without affecting animal performance (Pomar et al., Reference Pomar, Hauschild, Zhang, Pomar and Lovatto2010); these findings were recently corroborated in an animal trial (Andretta et al., Reference Andretta, Pomar, Rivest, Pomar, Lovatto and Neto2014). However, the implementation of precision feeding systems requires accurate knowledge of the animals’ nutrient requirements and the development of feeding devices and numerical procedures capable of providing each pig with the required amount of nutrients at each feeder visit (Hauschild et al., Reference Hauschild, Lovatto, Pomar and Pomar2012).
A recent experiment was carried out to validate a method of estimating individual lysine (Lys) requirements of pigs during the growing–finishing period (Zhang et al., Reference Zhang, Pomar, Pomar and Del Castillo2012). In that study, pigs were individually fed by means of automatic precision feeders (Pomar et al., Reference Pomar, López and Pomar2011). The results showed that the factorial method that was used in that study correctly estimated the Lys requirements of young pigs (25 to 55 kg BW) but seemed to underestimate the requirements of older pigs (70 to 100 kg BW; Zhang et al., Reference Zhang, Pomar, Pomar and Del Castillo2012). The factorial method used in the present study was therefore adjusted by taking these results into account. The objective of the present study was to validate the updated method of estimating real-time individual Lys requirements of growing–finishing pigs and the ability of this method to estimate the requirements of pigs with different feed intake and growth patterns.
Material and methods
Animals were housed and cared for according to the recommended Canadian Council on Animal Care (CCAC; 2009) guidelines. The Animal Protection Committee at Agriculture and Agri-Food Canada’s Dairy and Swine Research and Development Centre in Sherbrooke, Quebec reviewed and approved the protocol for this experiment.
Experimental feeds
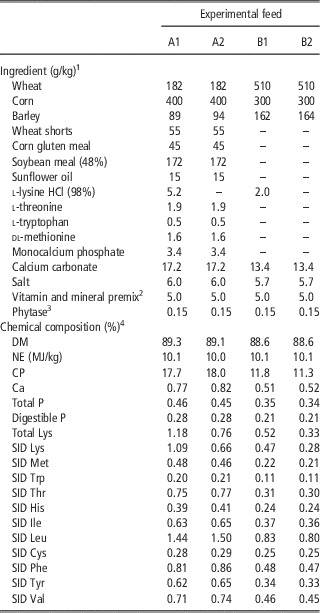
Four experimental feeds (A1, A2, B1 and B2) were used in this experiment (Table 1). Feeds A1 and B1 were formulated to supply 115% of the assumed standardized ileal digestible (SID) amino acids (AA) requirements of a 20 kg pig and a 110 kg BW pig with high protein deposition potential (National Research Council (NRC), 1998). Feeds A2 and B2, respectively, had the same nutrient composition as A1 and B1, with the exception of the SID Lys components, which were formulated to supply 70% of the assumed SID Lys requirements of a 20 kg and a 110 kg BW pig. Dietary P and Ca requirements were estimated according to the method of Jondreville and Dourmad (Reference Jondreville and Dourmad2005), and microbial phytase (750 phytase units/kg; Phyzyme XP, Danisco Animal Nutrition, Canada) was added to all feeds. Corn, soybean meal (48% CP) and wheat were the main feed ingredients. Free AA, such as l-lysine, l-threonine, l-tryptophan and dl-methionine, were incorporated to optimize the AA balance (NRC, 1998). The five main feed ingredients were first analyzed for their DM and total N contents (Kjeldahl method; Association of Official Analytical Chemists (AOAC), 1990). Feeds were formulated after adjusting the tabulated N composition of each ingredient (Sauvant et al., Reference Sauvant, Perez and Tran2004) to the analyzed N value while maintaining the tabulated AA profile. Feeds were steam-pelleted at 4 mm.
Ingredient and chemical composition of the experimental feeds

SID=standardized ileal digestible; AA=amino acids.
1 As-served basis.
2 One kilogram of the experimental feeds provides the following nutrients: vitamin A, 11 400 international units (IU); vitamin D, 1140 IU; vitamin E, 35 IU; vitamin B12, 0.03 mg; vitamin K (menadione), 2 mg; biotin, 0.15 mg; folic acid, 0.7 mg; niacin, 20 mg; pantothenic acid, 15 mg; pyridoxine, 2 mg; riboflavin, 3 mg; thiamine, 2 mg; choline, 500 mg; copper, 122 mg; iodine, 0.3 mg; iron, 100 mg; manganese, 63.3 mg; selenium, 0.3 mg; zinc, 152 mg.
3 Phyzyme XP 5000G; Danisco Animal Nutrition.
4 DM, CP, Ca, total P and total Lys, Met, Trp, Thr, His and Phe were analyzed. Net energy and digestible P were estimated from the INRA-AFZ tables (Sauvant et al., Reference Sauvant, Perez and Tran2004). SID Tyr, Ile, Leu, Cys and Val were obtained by proportional adjustment of INRA-AFZ tables’ values to the analyzed CP content of the experimental feeds. The other SID AA were obtained by converting analyzed total feed AA to SID values using the SID : total AA ratios provided in the INRA-AFZ tables.
Estimation of lysine and other nutrient requirements
The required Lys concentration of the feed given daily to each pig was estimated on the basis of the pig’s own BW, daily feed intake (DFI) and daily BW gain. Next-day DFI, BW and BW gain were estimated by linear regression using individual DFI and weekly BW; the latter value was obtained with a conventional scale. Daily SID Lys requirements (g/day) were calculated by summing the maintenance and growth requirements. Maintenance SID Lys requirements were estimated by adding basal endogenous losses (313 mg Lys/kg DM×DFI), losses related to desquamation in the digestive tract (4.5 mg Lys/kg0.75 day×BW0.75) and losses related to basal renewal of body proteins (23.9 mg Lys/kg0.75 day×BW0.75; van Milgen et al., Reference van Milgen, Valancogne, Dubois, Dourmad, Sève and Noblet2008). The SID Lys growth requirements were calculated by assuming 16% protein in daily gain (de Lange et al., Reference de Lange, Morel and Birkett2003), 7% Lys in protein gain (Mahan and Shields, Reference Mahan and Shields1998) and 72% SID Lys retention maximum efficiency (Mohn et al., Reference Mohn, Gillis, Moughan and de Lange2000). The desired daily concentration of SID Lys (g/kg) in the feed to be provided to each pig was calculated by dividing the estimated daily SID Lys requirement (g/day) by the expected next-day DFI (kg/day).
Animals and experimental design
A total of 75 castrated pigs (G Performer 8.0×Fertilis 25 pigs, Genetiporc Inc., Saint-Bernard, QC, Canada) corresponding to a terminal (T) genetic line and 72 castrated pigs (Fertilis 25) corresponding to a maternal (M) genetic line were used in this study. Pigs (18.2 kg BW, s.d.=2.2) were group-housed and fed ad libitum with a commercial starter diet from the time they were received at the research station until the treatments began. The pigs were separated into two groups. For the first group (37 pigs of each genetic line), the application of treatments began at an average BW of 25.8 (s.d.=2.5) kg, whereas for the second group (38 pigs from a terminal line and 35 pigs from a maternal genetic line, respectively), treatments began at an average BW of 73.3 kg (s.d.=5.2). Both trials lasted 28 days. A minimum of nine pigs from each group were randomly assigned to each treatment. The pigs in each weight group were housed in the same pen and individually fed ad libitum using five automatic feeders (Pomar et al., Reference Pomar, López and Pomar2011) that provided each pig with the appropriate mixture of the four experimental feeds. To this end, the feeder identified each pig when its head was introduced into the feeder, and the feeds were blended according to the assigned treatment and delivered upon animal request. A serving consisted of the amount of feed delivered at each animal request. A time lag was imposed between servings to ensure that pigs ate each serving before requesting a new one. Serving size was progressively increased during the experiment and ranged from 15 to 40 g. The amount of feed served during each feeder visit was considered a meal. Pigs tended to leave the feeder hopper empty or with very small amounts of feed after each visit. This ensured that each pig received the assigned amount of blended feed.
Pigs within each experimental group were randomly assigned to treatments according to a 2×4 factorial design with genetic lines (maternal and terminal) and SID Lys levels (70%, 85%, 100% and 115% of the daily estimated requirements and called Lys70, Lys85, Lys100 and Lys115, respectively) as the main factors. As mentioned before, all other nutrients including AA other than Lys were provided at 115% of the estimated requirements for all experimental treatments. Thus, pigs assigned to Lys115 treatment received a blend of A1 and B1 feeds, whereas those assigned to Lys70 received a blend of A2 and B2 feeds. The four experimental feeds were blended in the appropriate proportions to obtain Lys100 and Lys85 treatment feeds.
Measurements
At the beginning and end of each feeding phase, backfat thickness and loin muscle depth were measured between the third and fourth last ribs at 5 cm from the mid-line with a B-mode ultrasound device (Ultrascan 900, Alliance Médicale Inc., Montreal, QC, Canada; 120 mm, 3.5 MHz). Pigs were then anesthetized with a mask, which provided a mixture of 7% sevoflurane (Sevorane; Abbott Laboratories, North Chicago, IL, USA) and oxygen. When the animal showed signs of drowsiness, sevoflurane was replaced by 5% isoflurane (IsoFlo; Abbott Laboratories) in oxygen to maintain anesthesia. The animal was then placed in a prone position on the scanning table, and bone mineral content (BMC), bone mineral density (BMD), and body lean and fat mass were estimated by dual-energy X-ray absorptiometry (DXA; Prodigy; GE Healthcare, Madison, WI, USA) using whole-body thin (1st scan), standard (2nd scan) and thick (3rd and 4th scans) scan modes. The DXA body lean and body fat mass values (g) were converted to their body chemical equivalents (protein mass=0.216×DXA-body lean mass−1384; body lipids=1.009×DXA-body fat mass+2825) as suggested by Pomar and Rivest (Reference Pomar and Rivest1996).
Analytical procedures
Representative samples of the feeds were taken upon delivery and once weekly throughout the experiment. The weekly samples of each feed were mixed together at the end of the experiment to obtain a representative composite sample. The composite samples were analyzed by applying the AOAC standard methods for lyophilization (Method 938.18) and for determination of total protein (Method 992.15), lipids (Extraction Method 991.36), dry matter (Method 950.46) and ash (Method 920.153) (AOAC, 1990). The Ca and P concentrations in the samples were obtained by colorimetric methods and atomic absorption, respectively (AOAC, 1990). The AA content in feed was measured by gas chromatography coupled with mass spectrometry (Calder et al., Reference Calder, Garden, Anderson and Lobley1999).
Statistical analyses
Total SID Lys intake was obtained for each pig by adding the daily amount of Lys provided by each serving of feed. Total weight gain was obtained by the difference between the weights measured at the beginning and the end of each experimental period. Total protein and lipid deposition were obtained by taking the difference between the respective body constituents estimated by DXA at the beginning and at the end of the experimental periods. Average DFI (ADFI, kg/day), average daily SID Lys intake (g/day), average daily gain (ADG, kg/day), average daily protein deposition (ADPD, g/day) and average daily lipid deposition (ADLD, g/day) were individually calculated by dividing the corresponding variables by the 28 days of each experimental period. Feed and protein efficiencies are given by the ratio between the corresponding retained amount and ingested amount. Analyses of variance were performed on the variables studied for each of the phases using the MIXED procedure of SAS (SAS 9.2, 2002, SAS Institute Inc., Cary, NC, USA) after their normality was tested using the Shapiro–Wilk test, with the pig as the experimental unit. Multiple comparisons were performed using the Tukey–Kramer test.
Results
One pig was removed from the study because of a locomotion problem that was unrelated to the experimental treatments. No other major health problems were observed, and the pigs exhibited normal growth.
Protein and fat body mass estimated by DXA included the amount of protein and the fat content in the digesta. Given that no interaction between genetic line and Lys level was observed, body composition and growth performances for the two factors under study are presented and discussed separately.
First growing phase: 25 to 50 kg
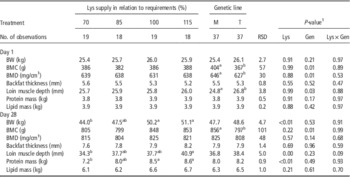
At the beginning of the first experimental phase (day 1), the initial body characteristics were not significantly different between the groups of pigs assigned to the different experimental treatments (Table 2). However, animals of the terminal line had lower BMC and BMD (P<0.01) and greater loin muscle depth (P=0.03) than the pigs of the maternal line.
Initial and final body characteristics of pigs from maternal (M) and terminal (T) genetic lines fed different levels of standardized ileal digestible lysine from 25 to 50 kg BW

BMC=bone mineral content; BMD=bone mineral density; RSD=residual standard deviation.
a,b,c,dValues within a row with different superscripts differ significantly (Tukey–Kramer test, P<0.05).
1 Lys=effect of lysine levels; Gen=genetic line effect.
Levels of lysine supply in relation to requirements
At the end of the first growing period (day 28), Lys70 pigs had lower BW (P<0.01) and protein mass (P<0.01) than Lys100 and Lys115 pigs; Lys85 pigs had intermediate values relative to those groups. Loin muscle depth of Lys70 pigs was lower than that of Lys115 pigs (P<0.01); Lys85 and Lys100 pigs were intermediate between those two experimental groups.
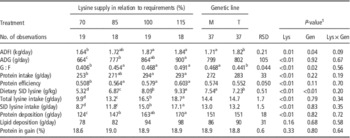
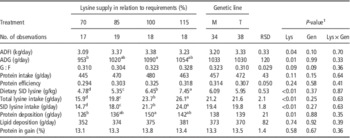
Average SID Lys concentrations in feeds served to pigs were consistent with the planned treatments (Table 3), with Lys70 and Lys115 pigs having consumed feeds with 66% and 115%, respectively, of the Lys consumed by Lys100 pigs. The Lys70 pigs ate less feed (P<0.01) than Lys100 and Lys115 pigs did; Lys85 pigs had an intermediate feed intake. The Lys70 pigs had significantly lower ADG and ADPD than pigs from the other three Lys levels (P=0.01). Pigs fed Lys85 feeds had significantly lower ADG and ADPD than Lys115 pigs (P<0.01). The Lys100 pigs had intermediate performances. With respect to the gain-to-feed ratio (G : F), Lys70 pigs were less efficient (P<0.03) than those from the other three groups, which did not differ from one another. Pigs in the 70% treatment consumed less protein (P<0.01) than Lys100 and Lys115 pigs did; Lys85 pigs had intermediate protein intake. Pigs in the 70% group had lower protein efficiency (P<0.03) than pigs in the other three experimental groups, which did not differ from one another. No significant differences were observed between treatments with respect to ADLD and percentage of protein in gain.
Impact of lysine supply on growth performance of pigs from 25 to 50 kg BW of maternal (M) and terminal (T) genetic lines

RSD=residual standard deviation; ADFI=average daily feed intake; ADG=average daily gain; G : F=gain-to-feed ratio; SID=standardized ileal digestible.
a,b,c,dValues within a row with different superscripts differ significantly (Tukey–Kramer test, P<0.05).
1 Lys=effect of lysine level; Gen=genetic line effect.
Comparison of two genetic lines
At the end of this first growing phase, only BMC differed between the two genetic lines. The BMC of terminal pigs was lower than that of maternal pigs (P=0.01). The maternal pigs consumed less feed (P=0.04), had greater G : F ratios (P=0.02) and received feeds with higher average SID Lys concentrations (P<0.01) than terminal pigs. There was no difference in ADG, ADPD, ADLD or SID Lys intake between the two genetic types.
Second growing phase: 70 to 100 kg
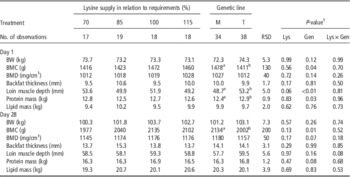
At the beginning of the second growing phase, no significant differences were observed between the groups of pigs assigned to the various experimental treatments (Table 4). However, the animals of the terminal line had lower BMC (P=0.04), greater loin muscle depth (P<0.01) and greater protein mass (P=0.03) than pigs of the maternal line (Table 4).
Initial and final body characteristics of pigs from maternal (M) and terminal (T) genetic lines fed different levels of standardized ileal digestible lysine from 70 to 100 kg BW

BMC=bone mineral content; BMD=bone mineral density; RSD=residual standard deviation.
a,b,c,dValues within a row with different superscripts differ significantly (Tukey–Kramer test, P<0.05).
1 Lys=effect of lysine level; Gen=genetic line effect.
Levels of lysine supply in relation to estimated requirements
On day 28 of this second experimental phase, experimental groups did not differ in terms of BW, protein mass, lipid mass, loin muscle depth or backfat thickness. The average SID Lys concentrations in feeds given to pigs differed between the four experimental groups (P<0.01): on average, Lys70 pigs consumed the feed with the lowest Lys concentration, that is, 74% in relation to Lys100 pigs, and Lys115 pigs consumed the feed with the highest Lys concentration, specifically 116% (Table 5). The four groups all consumed different quantities (g/day) of SID and total Lys (P<0.01), with Lys70 pigs consuming the least Lys and Lys115 pigs consuming the most. However, Lys70 pigs had significantly lower ADG (P<0.01) and ADPD (P<0.01) than Lys100 pigs; Lys85 and Lys115 pigs were intermediate between those two groups. The G : F ratio tended (P=0.09) to increase with increasing Lys supply. No significant differences were observed between the various treatments in terms of protein intake, protein efficiency, percentage of protein in gain or ADLD.
Impact of lysine supply on growth performance of maternal (M) and terminal (T) genetic lines pigs from 70 to 100 kg BW

RSD=residual standard deviation; ADFI=average daily feed intake; ADG=average daily gain; G : F=gain-to-feed ratio; SID=standardized ileal digestible.
a,b,c,dValues within a row with different superscripts differ significantly (Tukey–Kramer test, P<0.05).
1 Lys=effect of lysine level; Gen=genetic line effect.
Comparison of two genetic lines
At the end of the second experimental phase, no significant differences were observed between genetic lines with respect to final body characteristics, except for BMC, which was lower in terminal than in maternal pigs (Table 4; P=0.01). With respect to growth performance measurements, no significant differences were observed between genetic lines (Table 5).
Discussion
Method of estimating lysine requirements
The differences observed in dietary Lys concentration and intake between the four dietary treatments confirm that the objective of providing pigs with feeds having different concentrations of SID Lys was achieved during the two experimental phases. However, the SID Lys concentration in feeds served to Lys70 pigs was lower than originally planned during the first phase. In fact, instead of the planned 30% lower dietary SID Lys concentration, these pigs were served feeds containing 34% less SID Lys than the feeds served to Lys100 pigs. This difference appears to be due to the estimation method, which estimates pigs’ daily SID Lys requirements on the basis of their predicted ADG. In this first experimental growing phase, ADG decreased as a result of the lower dietary Lys, this amplifying the planned restriction in SID Lys supply, which was 34% instead of 30%. It should be noted, however, that this effect was not observed during the second phase, which involved heavier pigs. The variation in protein intake during the first phase was slight and appears to be linked to the variation in feed intake. These two variables had the same amplitude of variation, namely 13% between the 70% and 100% SID Lys supply treatments (1.64 v. 1.87 kg). This decrease in feed intake also magnified the reduction in SID Lys intake, which was 42% instead of the expected 30%; the difference between the planned and actual values was equivalent to the variation in feed intake.
The impact of SID Lys supply on the feed intake of ad libitum fed pigs is not consistent across reports in the literature. In some studies, Lys restriction did not have any impact on intake (e.g. Kamalakar et al., Reference Kamalakar, Chiba, Divakala, Rodning, Welles, Bergen, Kerth, Kuhlers and Nadarajah2009; Zhang et al., Reference Zhang, Pomar, Pomar and Del Castillo2012), whereas other researchers found that dietary Lys restriction resulted in decreased feed intake (Rodriguez-Sanchez et al., Reference Rodriguez-Sanchez, Sanz, Blanco, Serrano, Joy and Latorre2011) or in increased feed intake (Yang et al., Reference Yang, Jin, Yoon, Choi, Shinde, Piao, Kim, Ohh and Chae2008). Such differences could be caused in part by the method used to formulate Lys-restricted feeds, with some approaches based on varying proportions of main feed ingredients resulting in a decrease in CP, whereas others supply feed with synthetic AA and removing one AA to create a restriction without affecting the CP level. The second method has been used in the current study and allows for better evaluation of the effect of the dietary concentration of SID Lys, given that SID Lys is the only nutrient that varies between the treatments. With this method, a decrease in feed intake was previously observed with a low level of dietary SID Lys supply in pigs from 6 to 50 kg BW (Martinez and Knabe, Reference Martinez and Knabe1990). Moreover, another study demonstrated that a decrease in dietary Lys supply from 7 to 6 g/kg caused a decrease in feed intake in 100 to 120 kg BW pigs (Rodriguez-Sanchez et al., Reference Rodriguez-Sanchez, Sanz, Blanco, Serrano, Joy and Latorre2011). Unlike the effect of CP restriction on feed intake, Lys restriction appears to cause a slight decrease in intake, which could be the result of an AA imbalance and subsequent changes in AA competition for transport from blood to brain (Le Floc’h and Seve, Reference Le Floc’h and Seve2007). However, this effect seems to be weak, as observed in a study in which pigs were fed diets providing 60% of the estimated SID Lys requirements (Zhang et al., Reference Zhang, Pomar, Pomar and Del Castillo2012). In the present study, Lys70 pigs from 25 to 50 kg ate 12% less feed than Lys100 pigs. In heavier pigs, that is, from 70 to 100 kg, the decrease in feed intake between these two treatments was 9% and did not reach a level of significance even though the overall treatment effect was significant.
Most studies agree that Lys restriction causes a decrease in other growth performance traits such as ADG, G : F and ADPD (Kamalakar et al., Reference Kamalakar, Chiba, Divakala, Rodning, Welles, Bergen, Kerth, Kuhlers and Nadarajah2009; Zhang et al., Reference Zhang, Pomar, Pomar and Del Castillo2012). A similar effect was observed in the present trial in young (from 25 to 50 kg BW) and older (from 70 to 100 kg BW) pigs, although G : F differences for the heavier group were only trends. The performance of pigs from 70 to 100 kg BW seemed to be less affected by SID Lys restriction than was the performance of the pigs from 25 to 50 kg BW. The absence of significant differences in terms of BW, protein mass, G : F and protein efficiency in the second phase could be explained by the fact that the method used in the present experiment for estimating individual animal SID Lys requirements assumes that weight gain has a constant composition of 16% protein throughout the growth period. However, DXA results showed that weight gain was actually composed of 13% protein in pigs from 70 to 100 kg, in comparison with 19% in pigs from 25 to 50 kg. In other words, the finishing pigs likely received more SID Lys than they required for actual ADPD. Nevertheless, ADG and ADPD were significantly different between the various experimental treatments, indicating that these performance variables are sensitive to Lys restriction.
Based on the body characteristics of the 50 kg pigs, maximum BW and protein mass appeared to be achieved at 100% of Lys requirements. In terms of maximal ADG and ADPD for these pigs in the first growing phase, however, maximum performance seemed to be achieved with 115% of Lys requirements, even though the performance of the pigs in the 100% treatment did not differ significantly from those in the 115% group. Therefore, the method used in this study to estimate daily individual Lys requirements slightly underestimates pig requirements for ADG and ADPD in young pigs. The absence of a significant difference between the 85%, 100% and 115% treatments seems to show that maximum G : F begins at 85% of Lys requirements, which does not match the requirement for maximum ADG and ADPD.
For pigs from 70 to 100 kg, maximum ADG and ADPD were achieved at 100% of the estimated Lys requirements. No significant difference was observed between treatments in terms of G : F, protein efficiency, BW or protein mass. The method of estimating Lys requirements therefore appears to adequately determine the requirements of pigs from 70 to 100 kg. However, this estimation method assumes that 16% of BW gain is protein while the estimated value is 13%. Given that maximal BW gain and protein deposition were achieved at 100% of the estimated Lys requirements, this method should have overestimated the pigs’ Lys requirements. To explain this result, we can hypothesize that maintenance requirements during the finishing period were underestimated and Lys retention efficiency overestimated. In pigs from 25 to 50 kg, maintenance requirements and Lys retention efficiency appear to have been well estimated. The underestimation of requirements between 25 and 50 kg appears to be the result of an underestimation of the proportion of protein in weight gain. The proposed model appears to be calibrated to adequately predict Lys requirements of pigs within these two weight intervals even though maintenance and Lys retention efficiency appear biased.
Comparison of two genetics lines
The lower BMC observed in terminal line pigs compared with maternal line pigs in both experimental phases could have been caused by the BMC of the Piétrain breed in the terminal line, which is recognized to have lower BMC than other breeds. Castrated Piétrain pigs were found to have a lower bone mass percentage as compared with castrated pigs of the Landrace breed (Desmoulin and Bonneau, Reference Desmoulin and Bonneau1979). Another study showed that bone content was significantly lower in Piétrain pigs than in Large White pigs (Fortin et al., Reference Fortin, Wood and Whelehan1987). However, other studies did not find any significant differences between these breeds (Quiniou and Noblet, Reference Quiniou and Noblet1995). Other differences observed in the present study between the two genetic lines, that is, occasionally lower feed intake, G : F, protein mass and loin muscle depth in maternal pigs, are likely the result of different growth rates (Schinckel and de Lange, Reference Schinckel and de Lange1996).
The objective of using two genetic lines with different growth potentials in this study was to test the method of estimating SID Lys requirements. The absence of major differences between the two genetic lines in terms of body composition, ADG and ADPD indicates that these lines had similar growth potentials and, consequently, this objective was not entirely met. However, the fact that differences in ADFI, but not in ADG and ADPD were observed between these two genetic lines and the fact that the dietary Lys concentration served was adjusted accordingly indicates that the proposed factorial method can be adjusted to accommodate small genotype differences. From 25 to 50 kg BW, pigs from the maternal line consumed less feed. While these pigs should have had lower Lys consumption, no differences were observed between the two genetic lines, given that the average SID Lys concentration was significantly higher in maternal pig feeds than in terminal pig feeds. Thus, the two genotypes had similar ADG and ADPD. These results suggest that the proposed factorial method used to estimate the amount of Lys and the corresponding dietary concentration to be provided daily to each pig in the herd takes into account potential genotype differences. However, these results need to be confirmed using animals with larger differences in feed intake and protein growth potential.
Conclusion
The results of this study show that the method of estimating Lys requirements used for precision feeding slightly underestimates the requirements for maximal ADG and ADPD in pigs from 25 to 50 kg but adequately estimates the corresponding requirements of pigs from 70 to 100 kg BW. Therefore, the factorial method used in the present study to estimate individual daily SID Lys requirements can be used in precision feeding systems with minor adjustments for younger pigs. The two genetic lines used in the study did not differ substantially in terms of ADG or ADPD, showing that the ability of the proposed factorial method to account for large genetic differences has not been fully evaluated. Nevertheless, the results show that the proposed method was able to accommodate genetic differences in feed intake without a specific correction for genetic differences. This assumption remains to be validated in animals with larger genetic variation and heavier weights.
Acknowledgments
The authors would like to thank N. Ouellet for his technical support, S. Méthot for his help with the statistics, and the swine complex staff for taking care of the animals. This study was funded by Agriculture and Agri-Food Canada’s Canadian Swine Research and Development Cluster initiative. The automatic precision feeders were provided by the University of Lleida, Spain, and partly financed by the Spanish Ministry of Science and Education.