Introduction
Injuries are a leading cause of morbidity and mortality, both worldwide and in the United States.Reference Hulland, Chowdhury, Sarnat, Chang and Steenland 1 , Reference Lim, Vos and Flaxman 2 In the United State alone, 180,811 people (59.6 per 100,000 persons) died due to injury in 2010, putting accidental injuries at the fifth leading cause of death in the United States. 3 An additional 31,575,978 people (10.3 per 100,000 people) experienced non-fatal injuries in that same year. 4 Injuries are costly in not only life-years lost and in decreased quality of life, but also in monetary losses. The estimated cost of all fatal and non-fatal injuries in the United States in 2000 was over US$406 billion dollars, most of which was attributed to motor vehicle accidents and falls.Reference Hoyert, Arias, Smith, Murphy and Kochanek 5 A recent publication estimated that traffic accidents and falls rank fifth and 29th, respectively, in the number of disability-adjusted life years lost to disease and injuries in the US in 2010.Reference Lim, Vos and Flaxman 2
Previous research has demonstrated that the risk of fatal injuries among US employed adults varied sharply by socioeconomic status (SES). Using death certificate data for 260,000 US employed adults age 18-64 form 1984-1997, Steenland et al.Reference Finkelstein, Corso and Miller 6 showed strong gradients of increased risk with lower SES as measured by household income (adjusted for family size) for all injury mortality, after adjusting for race and gender. These gradients occurred for motor vehicle accidents, suicides, homicides, and all other injuries grouped together, and were most clearly present for men rather than women. Men had much higher injury mortality rates in general. Cubbin et al.Reference Steenland, Halperin, Hu and Walker 7 used mortality data linked to the National Health Interview Survey (NHIS) in 1987-1994 for 550,000 US working-age adults with 1,350 deaths. These authors found a strong positive gradient with SES for higher injury mortality for all injuries, motor vehicle accidents, homicide, and all other injuries combined. For suicide, there was a similar positive gradient for men, but among women, the wealthier were more likely to commit suicide. Men had much higher injury mortality in general, and SES gradients were more pronounced for men than women for homicide and other injuries combined, but not for motor vehicle fatalities nor suicide.
These findings for US injury mortality (strong inverse gradient with SES, more pronounced for men, present for all injuries and all specific injury categories) also have been shown in several other countries (Canada, Europe, and Korea).Reference Cubbin, LeClere and Smith 8 - Reference Gotsens, Mari-Dell’Olmo and Perez 10
There are far fewer data regarding SES for non-fatal injuries among adults. In the only US report, Cubbin et al.Reference Steenland, Halperin, Hu and Walker 7 analyzed self-reported, non-fatal injuries (n=4,189) from the NHIS. All non-fatal injuries combined were analyzed as data were not available by injury type. There was little pattern by SES for all non-fatal injuries. However, when analyzed by injury severity (days off work following injury), a pattern emerged that low SES was modestly associated with more severe injuries. Also noteworthy were data showing that blacks had lower injury rates than whites, adjusted for SES, which the authors suggested may be due to blacks being less likely to seek or have access to medical care than whites.
Two other older reports on non-fatal injuries came from England. McKee et al.Reference Lee, Lee, Noh and Khang 11 analyzed emergency department (ED) patients across England and found no association between all non-fatal injuries and SES, while Gorman et al.Reference McKee, Gleadhill and Watson 12 studied ED visits in one hospital and found an inverse relationship between all non-fatal injuries and SES.
Other reports on non-fatal injuries have been done for children and were recently reviewed.Reference Gorman, Ramsay, Wilson and Freeland 13 These do not show a consistent association between all non-fatal injuries and SES.
To further investigate the relation of SES to non-fatal adult injuries, the present study examined over 1,308,892 adult injury ED visits in 10 Atlanta (Georgia USA) hospitals from 2001-2004, of which 347,866 were due to injuries. For these years, addresses were available for those injured, enabling researchers to assign the injured to census blocks, and hence, assign SES. This enabled an assessment of the effects of age, gender, and race, adjusting for SES (median household income), precipitation, and temperature, as well as the effect of SES, adjusting for race (white/non-white), gender, age, precipitation, and temperature. More recent ED data (2010-2013) also were analyzed for injuries in the same 10 Atlanta hospitals to see if the same patterns held for race, gender, and age, controlling as well for temperature and precipitation. However, addresses were not available for the recent data, and hence, SES was not available.
Methods
Individual-level ED visit data were obtained from electronic billing records requested from 10 acute care hospitals within the 20-county Atlanta metropolitan area for the period 2001-2004. These data were originally collected as part of the Study of Particles and Health in Atlanta (SOPHIA); SOPHIA has collected ED visit data from 20-county Atlanta area hospitals (n=42) since the 1990s.Reference Alexandrescu, O’Brien and Lecky 14 - Reference Metzger, Tolbert and Klein 16 During 2001-2004, residential addresses were available for each person who was injured and went to the ED for 10 hospitals. The names of the hospitals are withheld due to data use agreement. Rigorous qualitative and quantitative measures of quality assessment are applied to these data. Briefly, data from each hospital are run through a standard cleaning procedure and the daily counts for all visits are evaluated for unusual day-to-day variability. Any within hospital trends that appear inconsistent are invalidated, particularly if no reasons for such trends are identified. The list of invalidations and an overall hospital entry/exit listing is then utilized in the epidemiologic modeling component of the project to help account for time trends in the outcome data.
The study was approved by the Emory Institutional Review Board (Atlanta, Georgia USA). The analysis was restricted to those aged 18 and above. Each record was geocoded to the census-block group level based on the patient’s address and the Census 2000 block group boundaries. The geocoding success rate was 81%. Missing geocodes were due to some addresses which were P.O. Boxes, and to address matches with less than 50% match probability. Race (white versus nonwhite) was missing for approximately 15% of the ED records. If the ED record was geocoded to a census-block group with ≤5% or ≥95% white, the missing race was assigned to be non-white or white, respectively. This reduced missing race to eight percent of the data. Daily average temperature and total precipitation were obtained from the monitor located at the Hartsfield-Jackson Atlanta International Airport. These variables were of interest as potential confounders, as higher temperature and higher precipitation significantly increased risk of all non-fatal injuries and were significantly associated in one direction or another with five out of seven specific injury types.
All ED visits due to non-fatal injuries were identified using primary and secondary International Classification of Diseases 9th Revision (ICD-9) diagnosis codes E800 to E999. Injuries were grouped into 15 categories: assault (E960-E969), suicide (E950-E959), surgery complication (E878, E879), motor vehicle accidents (E810-E819), falls (E880-E888), struck by objects (E916-E919), burns (E924), over-exertion (E927), drug reaction (E930-E949), bites (E906), foreign body (E910-E915), venom (E905), bike injuries (E826), accidental drug (E849-E858), and other.
The median household income for each census-block group was used as a measure of SES. Education and household income are two commonly used indices of SES, which were both available in census data. Each has advantages and disadvantages.Reference Sarnat, Klein and Sarnat 17 Household income was used as the measure of SES because of the a priori assumption that current injuries were more likely to be associated with current household income than education, which is fixed during young adulthood.
The odds of injury ED visits among all ED visits, and of six specific injury types, were first analyzed via logistic regression in relation to age, race, and gender, adjusted for census-block group level SES (ie, median household income, in quartiles), precipitation, temperature, and indicator variables for hospital entry/exit. The six specific injury types (assault, suicide, motor vehicle accidents, falls, struck by objects, and burns) were chosen because they were well-defined specific categories, and because of either their large event counts or high a priori interest. In these analyses, the odds of each specific injury type were compared to the odds of all other ED visits (controls). These analyses also provided the odds of all non-fatal injuries and specific injury types for the SES quartiles. Finally, SES effects stratified by gender and race were analyzed to examine potential effect modification in SES results by these variables. All analyses were performed using SAS Version 9.3 (SAS Institute; Cary, North Carolina USA).
All ED visits for the same 10 Atlanta hospitals for the years 2010-2013 also were analyzed, for ages 18-64, to see if these data could confirm the patterns observed in the 2001-2004 data by race, gender, and age; these data were acquired from the Georgia Hospital Association (Marietta, Georgia USA). However, residential addresses were not available for these ED visits, and hence, the more recent data for SES could not be analyzed. The same logistic model was used for the analyses of the data from 2010-2013, analyzed the same injury categories, and again included data on age, gender, race, temperature, and precipitation, categorized in the same way as the analyses of the 2001-2004 data. There were 1,694,516 ED visits in these data from 2010-2013, of which 501,579 (23%) were for injuries.
Results
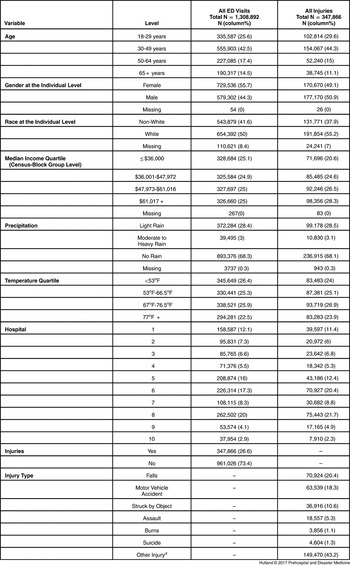
Table 1 shows descriptive statistics for all non-fatal injuries and all ED visits. Falls, motor vehicle accidents, and being struck by objects were the most common injuries, followed by assault, suicide (attempts), and burns. These categories represented 68% of all non-fatal injuries and were the subject of more detailed analysis.
Descriptive Statistics, ED Visits 2001-2004

Abbreviation: ED, emergency department.
a Other injuries were not analyzed as a separate category; they included surgical complications, and a number of very general categories, such as accidental poisonings, overexertion, drug reaction, and foreign bodies; these five categories accounted for 87% of the other injuries.
The study population of injured subjects was similar to the general population of greater Atlanta regarding gender, race, and age. In 2001-2004, the injured population was 49% women, 59% white, and 11% were over age 65. In 2010-2013, the injured population was 52% women, 49% white, and 15% were over age 65. Based on 2010 census data for the 10-county greater Atlanta area (Cherokee, Clayton, Cobb, DeKalb, Douglas, Fayette, Fulton, Gwinnett, Henry, and Rockdale counties; population four million), from which the injured population was largely derived, the percent women were 51% women, 59% white, and 11% were over age 65.Reference Shavers 18
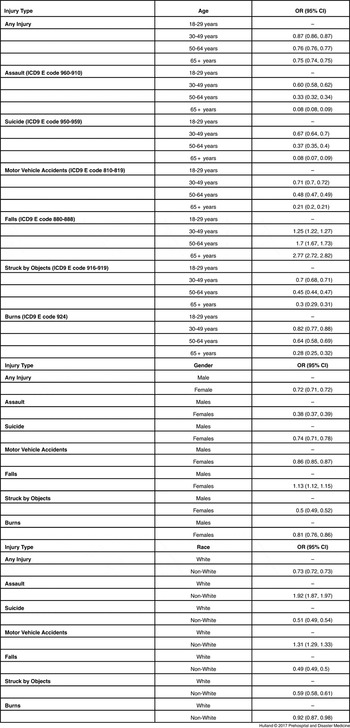
Table 2 shows results by age and gender and race, each adjusted for all other covariates in the model. For all non-fatal injuries combined, Table 2 shows that all non-fatal injuries combined were more common among males, whites, and younger ages. Table 2 also shows that assaults, suicide, motor vehicle accidents, being struck by objects, and burns were strongly associated with younger age, while the opposite was true for falls. Male gender was associated with assault, motor vehicle accidents, burns, and being struck by objects, while females had higher risk of suicide and falls. Table 2 also shows data by race. Non-white race was associated with assault and motor vehicle accidents, while white race was associated with suicide, falls, and being struck by objects.
Age and Gender and Race: Odds Ratios by Injury Type, ED Visits 2001-2004

Abbreviations: ED, emergency department; ICD9, International Classification of Diseases, 9th Revision.
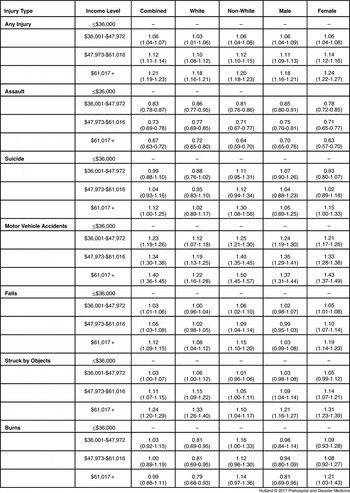
Table 3 shows the model results for SES for all non-fatal injuries and specific injury types, as well as results for SES by race and gender. For all non-fatal injuries, suicide, motor vehicle accidents, falls, and being struck by objects, those with more income had a higher risk with the strongest gradients seen for motor vehicle accidents and being struck by objects. For assault, those with less income had higher risk. Burns showed no relation to SES. Patterns for SES by gender and race were generally similar. However, for suicide, the gradient for SES was particularly apparent for non-whites, where those with the most income had a 30% increased risk. For burns among whites and males, higher income was protective, whereas among non-white and females, higher income increased risk. Overall, patterns by SES were modest with the highest or lowest SES categories having an excess risk of 40%-50% at most; however, trends generally were monotonic and excess risks tended to be statistically significant due to the large sample size.
Income Quartile Odds Ratio by Injury Type, ED Visits 2001-2004

Abbreviation: ED, emergency department.
As noted earlier, more recent ED visit data also were analyzed (2010-2013) in the same 10 Atlanta hospitals, albeit without SES data which were unavailable for these years. This analysis was done to confirm that the same patterns were present by race, age, and gender, for specific injury categories, as had been seen in 2001-2004. Table 4, when compared to Table 2, shows that the patterns by race, age, and gender were similar in 2010-2013 as in 2001-2004. For all injuries, risk dropped sharply by age. Men were at higher risk than women, and whites were at higher risk than non-whites. There were some exceptions to these patterns for all injuries when looking at specific injury categories. Non-whites were observed to have had a higher risk than whites for assault and motor vehicle accidents, while whites had lower risks for other categories. The lack of adjustment for SES in the 2010-2013 results may explain some of the differences from 2001-2004 results, although the 2001-2004 data were re-analyzed without SES adjustment (data not shown) and results were similar to those seen in Table 2, indicating that in most instances, SES was not a major confounder for the other variables in the model.
Age and Gender and Race: Odds Ratios by Injury Type, ED Visit 2010-2013

Abbreviations: ED, emergency department; ICD9, International Classification of Diseases, 9th Revision.
Discussion
These results differ markedly from prior results for adult mortality from injuries. Steenland et al.Reference Finkelstein, Corso and Miller 6 found that lower income was associated with mortality from all injuries and all specific injury types analyzed (motor vehicle accidents, homicides, suicides, and all other injuries), and that in general, fatal injuries were more common among men. Cubbin et al.Reference Steenland, Halperin, Hu and Walker 7 found similarly that low income increased risk of all injury fatalities, and for homicide, motor vehicle accidents, suicide (men only), and other injuries. However, Cubbin et al.Reference Steenland, Halperin, Hu and Walker 7 noted that among women, the gradient for suicide was reversed such that women had a higher risk.
Studies of fatal injuries from other countries all show consistent patterns of increased risk for lower income.Reference Cubbin, LeClere and Smith 8 - Reference Gotsens, Mari-Dell’Olmo and Perez 10
Some of these differences in the present analyses from the prior US studies may result from the fact that all adults were studied while Steenland et al.Reference Finkelstein, Corso and Miller 6 and Cubbin et al.Reference Steenland, Halperin, Hu and Walker 7 studied adults aged 18-64. However, in most cases, the age difference is unlikely to be a major cause of different findings for SES as the majority (89%) of injuries in the present study occurred among adults age 18-64. More likely, the difference from these mortality findings stem from studying non-fatal injuries.
These results suggest that non-fatal US injuries show a different pattern than fatal US injuries. All non-fatal injuries, motor vehicle accidents, suicides, falls, and being struck by objects were more common among those with higher incomes (contrasting with fatal injuries), while those with lower income were more at risk for assault (similar to fatal injuries). Overall, these contrasting results for fatal versus non-fatal injuries suggest that while all non-fatal injuries are more common among those with higher income, injuries (all types combined) are more fatal for those with less income. As Cubbin et al.Reference Steenland, Halperin, Hu and Walker 7 have suggested, it is possible that those with lower income who injure themselves are less likely to seek treatment in EDs (and hence, not enter the study) because of possible expenses or difficulty in reaching the ED.
For specific injuries, the results showing more ED visits for motor vehicle injuries with higher income may suggest that while people with higher household income are more likely to drive than those with less income (who may take public transportation), 19 their motor vehicle accidents are less fatal. This could occur, for example, because cars of those with higher income are newer and better maintained, and hence safer, or because of different driving behaviors. There are data, for example, which indicate those with higher SES are more likely to use seatbelts.Reference Pucher and Renne 20
The results for attempted suicide similarly suggest that those with higher income are more likely to attempt suicide (although the effect is modest) while prior data from studies of suicide death indicate the less wealthy are far more likely to succeed. These findings concur with a review of studies of attempted suicide which found that most of these studies found a positive relationship between higher SES and attempted suicide, including some US studies.Reference Strine, Beck, Bolen, Okoro, Dhingra and Balluz 21 It is possible that the methods of attempted suicide tend to be more unsuccessful among those with more income; US data from 2001, for example, indicate that firearms are 85% successful, falls are 31% successful, while poisonings are only two percent successful.Reference Burrows and Laflamme 22 However, no literature on how methods of suicide attempts differ by income was found in literature searches.
No trends of burn injuries in relation to income were observed in the present analyses. In a recent review, PeckReference Vyrostek, Annest and Ryan 23 cites evidence from several US studies which have shown the severe burns resulting in hospitalization are associated with lower SES. Again, results of the current analyses may reflect that lower income people do not seek medical care for minor burns compared to upper income people. Modest positive trends for more falls and being struck by objects with higher income were seen. Other studies of US adults where these outcomes were analyzed by SES also were not found on literature searches.
It is notable that assault was the only injury category associated with lower income. This result makes intuitive sense, as assault is more common in low income neighborhoods.Reference Peck 24 Furthermore, these results concur with the strong effects of low income on this outcome in the previously cited injury mortality studies, as well as mortality studies of homicide.Reference Harrell, Berzofsky, Couzens and Smiley-McDonald 25
Finally, it is worth noting that factors associated with race continue to play a role in all non-fatal injuries and specific injuries, even when adjusting for income. Like the finding by Cubbin et al.,Reference Steenland, Halperin, Hu and Walker 7 the present analyses demonstrated that non-whites have a lower risk of all injury visits to the ED than whites, which may reflect worse access to care or less willingness to seek care, even after adjusting for income. For specific injuries, racial differences remain in these data after adjusting for income. Non-whites have higher risks of assault and motor vehicle accidents after adjusting for income. Non-whites have lower risks of falls, being struck by objects, and a markedly lower risk of suicide after adjustment for income.
Limitations
A major limitation of this work is the lack of data on injury severity, or whether patients were eventually hospitalized. The extent to which these findings are generalizable outside of Atlanta is not clear. Other limitations include the inability to match addresses to census-block groups for 29% of addresses, the lack of race data for 15% of the observations (although race was assigned confidently for one-half of these given that the census blocks of residences were ≥95% either white or black), possible inaccuracies in recorded ED data, and inference of household income based on residence in a census-block group. Furthermore, the present study was done using data from EDs in hospitals and may not represent patters for non-fatal injuries in other non-ED settings, such as private offices, clinics, and urgent care centers.
Another limitation is that these data are somewhat dated, coming from 2001-2004. As noted earlier, more recent data did not include individual addresses, and hence, they were not amenable to analysis as the data for SES was derived from addresses. However, more recent ED data from the same 10 hospitals (2010-2013) without SES were analyzed. Very similar patterns by race, age, and gender in 2010-2013 were seen as in 2001-2004. This gives some confidence, via indirect evidence, that patterns seen by SES in 2001-2004 are also likely to persist in the 2010-2013, although of course there can be no guarantee that this is so. In particular, similar patterns by race in the more recent data, which is correlated with SES, support the idea that SES patterns in more recent years are likely to be similar to those seen in 2001-2004.
Finally, this was an observational study which cannot establish causality but only can observe an association. Repetition of these findings for injuries in EDs in other cities would help establish the validity of the associations that were observed. A prospective design with interviews to ascertain non-fatal injuries might also offer advantages which would overcome some of the limitations of the present study.
Conclusion
The present study of 1,308,892 adult ED visits in 10 Atlanta hospitals from 2001-2004 indicates that for most non-fatal injuries, those with higher income had more risk, although the opposite was true for assault. The data from 2001-2004, as well as more recent data from 2010-2013, show that whites had higher odds for any injury, but non-whites had higher odds for assault and motor vehicle accidents. Males were generally at higher risk of injury, with the exception of suicide and falls. Future work on SES and adult injuries should include measures of injury severity.