The consequences of the latest financial crisis have caused (future) pensions of Dutch people to become less generous. Financial risks have increasingly shifted from pension providers to individuals (Krijnen et al., Reference Krijnen, Breugelmans and Zeelenberg2014). Policymakers reacted to the recent changes by passing the Pension Information Act in 2015, which requires clear and effective pension communication from the side of pension providers. This act introduced mandatory disclosure by pension providers in order to guarantee an environment that enables people to appropriately plan for retirement (Autoriteit Financiële Markten, 2018). While pension funds and insurers are thus mandated to provide accurate information, their clients are under no obligation to delve into their own pension situation. People do not seem to feel the urgency to read pension documents and they postpone planning for retirement (Krijnen et al., Reference Krijnen, Breugelmans and Zeelenberg2014). One of the main trends in the discussion surrounding the pension system is freedom of choice. In a Netspar Brief on freedom of choice in pensions, van Dalen and Henkens (Reference van Dalen and Henkens2016) conclude that people actually prefer to outsource the majority of choices regarding their pensions to a pension fund.
Nevertheless, individuals find it important to retain a certain degree of freedom of choiceFootnote 1. More choice also means that it becomes essential to delve into information surrounding those choices. People do not seem to be so keen on diving into the ocean of information, however: they are routinely swamped with information on a myriad of financial products and they find that making a well-thought-out financial decision can be more challenging than expected. Lee and Lee (Reference Lee and Lee2004) show in their work that information overload results in ‘less satisfied, less confident, and more confused consumers’ (p. 159) who make poorer decisions.
The general question that arises is whether we can induce people to acquire information about their pension such that they are able to make (financially) wise decisions. In order to grapple with the problem of incentivising people to delve into their pension situation, this paper combines insights from economics on the nature of financial decision making with insights from the fields of communication science and social psychology on tailoring information pieces. We contribute to the literature by conducting a randomised controlled experiment on the effectiveness of tailoring pension communication. The effectiveness is measured by monitoring pension information behaviour (PIB hereafter), which includes clicking on a link to a (personal) pension information website, logging in to this website (which requires a username and password) and spending time on this website.
The main goal of our study is to assess whether tailoring invitations to individuals in order to trigger them to delve into their pension information results in a higher probability to do so. For this assessment, we sent email invitations to all employees of an insurance company to use an online tool, referred to as the Pension check, to learn more about their personal pension situation. Half of the employees were randomly assigned to receive tailored invitations; the other half received non-tailored invitations. We tailored the invitations based on age and gender. The non-tailored (or generic) invitations were gender- and age-neutral. Age and gender are characteristics of customers that are a priori known by their pension plan provider. Conceptually, the main dependent variable is the behaviour of individuals after they received different invitation versions – in short, their PIB. We identify three traceable dimensions of PIB: (1) clicking behaviour, (2) login behaviour and (3) the time spent in the Pension check.
In economic terms, individuals aim at smoothing consumption over their lifetime. During their working life, they accumulate wealth and make investment decisions using the information available to them so that they can maintain their desired consumption level after retirement. This is the basic idea behind life-cycle models, which are used to explain lifetime consumption patterns of individuals and households (for more background, see Deaton, Reference Deaton1992, Chapter 2 and Deaton and Muellbauer, Reference Deaton and Muellbauer1980, Chapter 12). In the ideal case, individuals have access to full information, which they may use in order to make optimal financial decisions. However, individuals are not always well-informed about complicated financial matters such as pension systems. This might be due to a lack of intrinsic motivation or simply an inability to grasp financial concepts. Due to compulsory pension plan participation, pension premiums are deducted automatically. Pension benefits are received in the future. This creates a setting in which time preference plays a crucial role in how individuals make investment decisions concerning their pension. Inconsistent time preferences are typically modelled by a hyperbolic discount function – with ‘high discount rates over short horizons and relatively low discount rates over long horizons’ (Laibson, Reference Laibson1997, p. 445). Individuals keep on postponing their decision to invest, as the expected returns (the pension payments) lie relatively far in the future. Though not explicitly modelled in our study, the concept of time preferences helps us to understand the mechanisms behind making financial decisions with benefits that can be reaped in the future. Naturally, the time horizon of the expected benefits varies with the individual's age.
Tailoring information according to personal characteristics has received attention in health communication as a way to get people interested in health information (Kiesler and Auerbach, Reference Kiesler and Auerbach2006; Hawkins et al., Reference Hawkins, Kreuter, Resnicow, Fishbein and Dijkstra2008). Binge drinking (Chiauzzi et al., Reference Chiauzzi, Green, Lord, Thum and Goldstein2005), nutrition (Brug et al., Reference Brug, Steenhuis, van Assema and de Vries1996; Oenema et al., Reference Oenema, Brug and Lechner2001) and smoking (Dijkstra et al., Reference Dijkstra, De Vries, Roijackers and van Breukelen1998; Etter, Reference Etter2005; Strecher et al., Reference Strecher, Shiffman and West2005) are some examples within the domain of health communication where tailoring has been found effective to induce awareness and promote healthier behaviour.
Hawkins et al. (Reference Hawkins, Kreuter, Resnicow, Fishbein and Dijkstra2008) define tailoring as ‘a number of methods for creating communications individualized for their receivers […]’ (p. 454). In their discussion on communication strategies for enhancing information relevance, Kreuter and Wray (Reference Kreuter and Wray2003) conclude that programs that ‘succeed in making information relevant to their intended audience will be more effective’ than non-tailored information materials (p. 227). In their systematic review on (computer-) tailored behavioural interventions, Lustria et al. (Reference Lustria, Cortese, Noar and Glueckauf2009) suggest several tailoring criteria, such as demographic information (age and gender), individual characteristics or health information needs. Examples of research on tailoring information (in smoking cessation programs) based on demographics are Etter (Reference Etter2005) and Cobb et al. (Reference Cobb, Graham, Bock, Papandonatos and Abrams2005). Etter (Reference Etter2005) compared the efficacy of two Internet-based, computer-tailored smoking-cessation programs. Both programs were tailored based on personal characteristics, attitudes towards smoking and other variables. Etter found that for the original program, smoking abstinence rates were higher than for the modified program, which contained a counselling letter as an intervention. Cobb et al. (Reference Cobb, Graham, Bock, Papandonatos and Abrams2005) conducted a study in which he evaluates a well-known smoking-cessation website (QuitNet) that provided targeted and tailored information to each user based on personal characteristics such as age, gender, quitting history and prior usage patterns within the site. This study found that sustained use of the website was associated with higher abstinence. Both studies analysed programs that did not tailor information on the basis of demographics alone but also on individual preferences. Putting this into practice concerning pension information is far from straightforward. A start can be made by focussing on a few easily observable characteristics: tailoring on demographic information rather than on individual preferences allows a relatively clear-cut segmentation that does not require a great deal of effort from the relevant information providers.
As we have seen, the effectiveness of tailoring in changing behaviour has been documented in several research domains. To offer a complete picture, we should consider a strand of literature from social psychology that questions the effectiveness of communication with a persuasive intent. Several studies discuss a phenomenon known as the forewarning effect (see McGuire and Papageorgis, Reference McGuire and Papageorgis1962; Petty and Cacioppo, Reference Petty and Cacioppo1979; Kamalski et al., Reference Kamalski, Lentz, Sanders and Zwaan2008), which could counteract the desired effects from offering information with a persuasive intent. With forewarning, recipients of a message would be ‘motivated to counterargue the message in order to reassert their freedom’ (Petty and Cacioppo, Reference Petty and Cacioppo1979, p. 173). Kamalski et al. (Reference Kamalski, Lentz, Sanders and Zwaan2008) provide experimental evidence in favour of a forewarning effect when processing an informative text. Tailored communication has a persuasive intent, that is, people should get involved with their pension situation. When recipients recognise that they are being persuaded to act upon the tailored invitation, their intrinsic motivation to do so might be crowded out: they develop resistance and it becomes harder, or even impossible, to persuade them.
Several pension funds and insurers are already experimenting with providing layered information or creating individual profiles for their clients. Nell et al. (Reference Nell, Lentz and Pander Maat2016) conducted a study on the effectiveness of providing layered pension information. They tested whether participants who were subjected to a layered pension document showed a better understanding of the situation than those who had to read a pension document without layers. The study found no evidence for an overall effect of layering. Another relevant study on the topic of pension communication is that of Eberhardt et al. (Reference Eberhardt, Brüggen, Post and Hoet2016). They developed a conceptual model (the retirement belief model) and identified different segments of pension plan participants with certain characteristics. Our study builds upon their findings, following their call to research ‘how different target groups react to different types of framing information’ (Eberhardt et al., Reference Eberhardt, Brüggen, Post and Hoet2016, p. 44).
A study by Bauer et al. (Reference Bauer, Eberhardt and Smeets2017) found that financial incentives were more effective than social norms in motivating participants to look into their personal pension planner. In a controlled field experiment, they sent invitation letters conveying a social norm or a financial incentive as a nudge to pension plan participants to look into their personal pension planner. Whereas our design of the quotes aimed at motivating participants directly to look into their pension situation, Bauer et al. (Reference Bauer, Eberhardt and Smeets2017) formulated the social norms in terms of (in)sufficient pension income. Other interesting studies use individual retirement income projections to measure the effect on retirement savings: See Dolls et al. (Reference Dolls, Doerrenberg, Peichl and Stichnoth2018) for a natural experiment in the German pension context, Goda et al. (Reference Goda, Manchester and Sojourner2014) for experimental evidence on the U.S. and Fuentes et al. (Reference Fuentes, Lafortune, Riutort, Tessada and Villatoro2017) for a randomised control trial in Chile. Those studies focused on measuring the impact of personalised information on financial incomes. Furthermore, individual projections on pension income were used as the base of personalising information rather than – as in this study – tailoring information on key characteristics like age and gender.
In this study, we investigate whether we can induce individuals to acquire information about their pension situation. This is a crucial first step towards informed pension decision making; people need to be motivated to abandon their state of inertia and to become more involved pension planners. We distinguish between three different phases that are at the heart of acquiring information about one's pension situation. The first phase is the trigger phase, followed by the navigation phase and, subsequently, the content phase. In the trigger phase, individuals are stimulated to access a particular website by either following a link or logging into their individual customer page of their pension plan provider. Usually, individuals receive an invitation by (e)mail or in the digital environment of their pension plan provider. The second phase is when people have already been triggered to seek more information about their pension situation and they need to navigate through the myriad of information pieces that are available. This phase refers to the design and presentation of choices, that, according to Prast and Van Soest (Reference Prast and van Soest2016), is ‘a complementary way [to financial education and pension knowledge] to improve decisions on pension preparation’ (p. 113). The third phase concerns the processing of the content of the information provided.
This article focuses on the triggering phase: we manipulated the invitation (or the trigger) for individuals to delve into their pension situation. Our aim is to explore the effect that the intervention had on the subsequent behaviour of the participants in our field experiment.
The remainder of this article is structured as follows: Section 1 outlines the experimental design. Section 2 describes the data collected, followed by two sections describing, respectively, the estimation procedure and the empirical results. The last section provides a discussion of our findings and an outlook towards future research.
1. Experimental design
The experiment was carried out in collaboration with a pension insurance company. The participants in our study are insurance company employees, all of whom automatically participate in the pension scheme provided by their employer and have access to the Pension check. Note that because of the nature of our research population, we are restricted in generalizing our results beyond employees of the financial sector.
The Pension check is an online tool that enables participants to check whether they have accrued enough pension income for their old age. When logging into the Pension check, participants must use their digital identity code (DigiD). This identity code, provided by the Dutch government to access personal online information, is needed, among other things, for filing income tax. In the Pension check, users are asked to upload their salary and pension-specific details from a website administered by the Dutch pension sector. With this tool, participants see current accrued pension income, split into state pension and occupational pension income, and their projected pension income. This projection is being contrasted with the pension income required to meet people's consumption needs. We show some screenshots of the Pension check in the online Appendix.
We sent the tailored email invitations to perform the Pension check to all employees (N = 3,298) of the insurance company. One week later, we sent a reminder for the invitation (using the same wording as the initial email) to those who had not taken any action. We tailored the invitation to participate in the Pension check on two variables: age and gender. We based our choice on the findings of Hershey et al. (Reference Hershey, Jacobs-Lawson and Neukam2002), who found that there were age and gender differences in goals individuals hold for retirement.
We defined three age categories: 18–34, 35–54 and 55 years and older. The youngest age group encompasses the part of the population that is at the beginning of their working career. They are typically more concerned with saving for their first car, their first house or the next vacation rather than for retirement. The middle-aged group typically has more working experience and starts accumulating savings to buy a larger house or car and to settle down. Financially, middle-aged individuals are expected to have a buffer to start saving for retirement. The 55+ group is a heterogeneous group of individuals ranging from those who still have some working years left (and can still make important financial decisions concerning their future pension entitlements) to those who are about to retire (and who cannot do much to change their pension entitlements). The idea was that the sense of urgency and possible actions differ for the three age groups. For the young group, although retirement is still far away, it would still pay off to have an overview of the pension situation, although the benefits might not be immediate. The earlier that people are confronted with the fact that they need to be aware of their pension situation, the more time they have to digest any practical information on this topic. This could save them some time and stress in the future when the urgency increases. For the middle group, respondents should be aware that their retirement is approaching and that they should take action well in advance. For the senior group, it is crucial to be aware of their pension situation; in some cases, it may still not be too late to improve matters.
The motivation to tailor on gender is provided by Graham et al. (Reference Graham, Stendardi, Myers and Graham2002), who investigated gender differences in investment strategies from an information-processing perspective. The study concluded that there are gender-based information-processing differences, as men and women select different ‘cues from the environment when processing information’ (idem, p. 19). Females tend to process information more comprehensibly, considering also subtle bits; males typically do not process all available information. Furthermore, Graham et al. point out several important implications regarding ‘the marketing of financial services to male versus female customers’ (idem, p. 9). We acknowledged those conclusions in our decision to tailor the email invitation also on gender.
Having defined three age groups and two gender groups, we ended up with six separate groups for a tailored approach. We randomly assigned each individual to one out of four conditions. In the first condition, participants received an invitation tailored on age and gender. In the second condition, participants received a version tailored on gender; in the third condition, they received a version tailored on age. The fourth condition entailed receiving a generic version that contained no tailoring. The four conditions we designed enabled us to trace back whether the causal effect of tailoring on participant behaviour is due to the tailoring solely on age or gender, or due to the tailoring simultaneously on both variables.
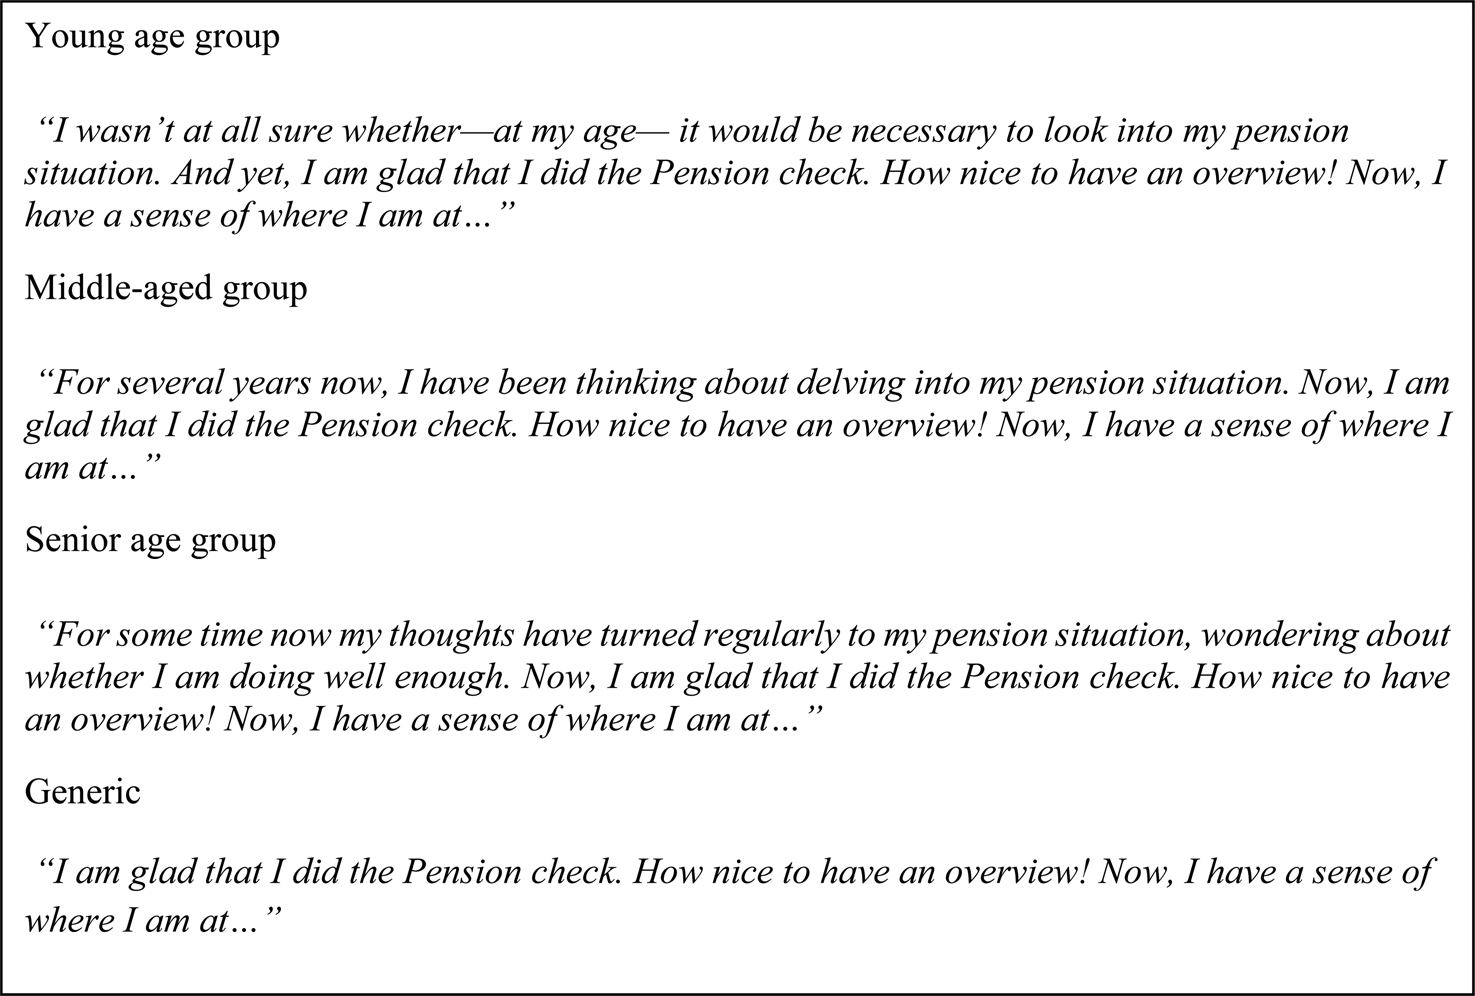
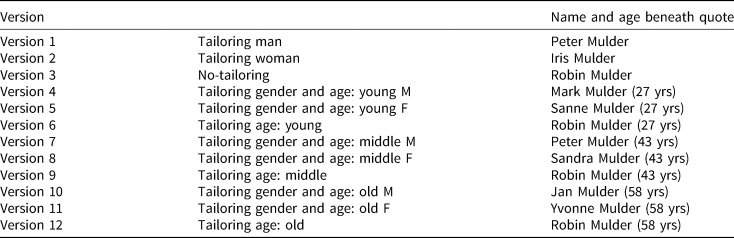
We tailored the mail invitation as follows: (1) we included a quote by a fictional persona in the preamble of the email, indicating also the gender and age of the persona and (2) we included a couple of tailoring sentences that differed in their content (urgency and possible action), depending on the age group. We developed four different quotes, depending on which version the participant would receive, with the content of the quote differing for each age category. Additionally, we provided a different quote for the version that did not contain tailoring based on age. The quote contains a reflection made by a fictional persona after performing the Pension check. Underneath every quote, we added a name that is typical for that specific age group and gender with a fictional age between brackets (this is how we tailored on gender). Note that for the versions in which we did not tailor on gender, we chose the name Robin, a gender-neutral name in the Netherlands. See Figure 1 for an overview of the quotes and Appendix A for an overview of the names and ages used for the personas appearing below every quote.
Overview of the quotes at the beginning of the email invitations.

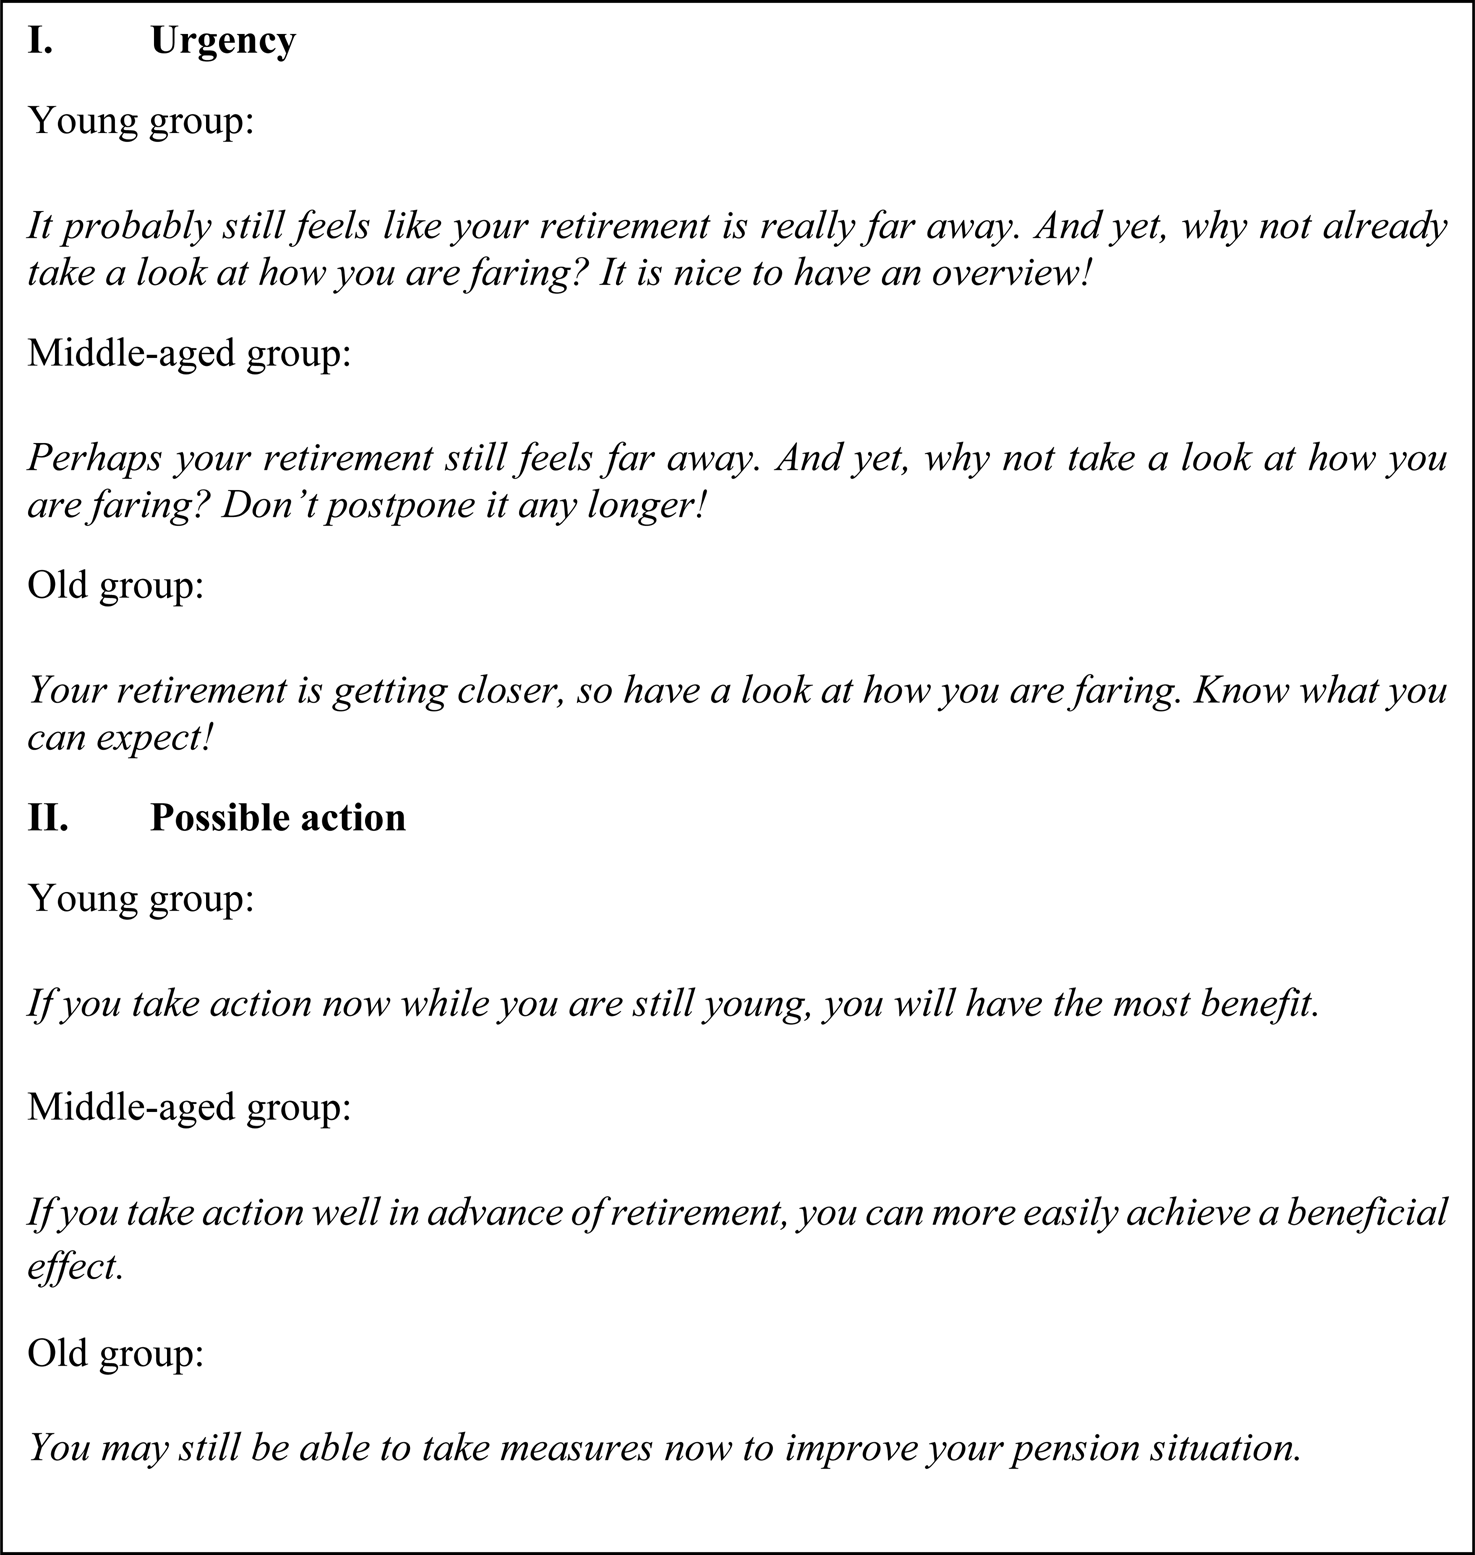
Apart from the quotes, we also developed two types of tailoring sentences in the invitation letter: one group of sentences that referred to the urgency for people of a particular age group to inform themselves about their pension situation and a second group of sentences that focussed on encouraging participants to take action. Figure 2 shows the exact wording of the tailored sentences (in Dutch) and their English translation. For a detailed overview of the complete mailings, please refer to the online Appendix. The formulation of the tailored passages was to offer action perspective to participants of different age groups and to convey a sense of urgency to each age group. By action perspective we mean that, for instance, young people can still wait but it is good to know what saving for retirement means; senior people should already take concrete measures to make sure they have a sufficient level of future income.
Overview of tailored sentences.

2. Data description
The invitations to perform the Pension checks were sent out to all employees of the insurance company. Twelve employees did not receive the email invitation, due to technical reasons, which left us with a sample of 3,286 individuals. We collected data about (1) the mailing version each participant received, (2) clicking behaviour on the link in the email invitation, (3) logging in to the Pension check environment (and how often), (4) time spent per session (converted to seconds), (5) at which page of the Pension check participants aborted the session and (6) completion of the Pension check.
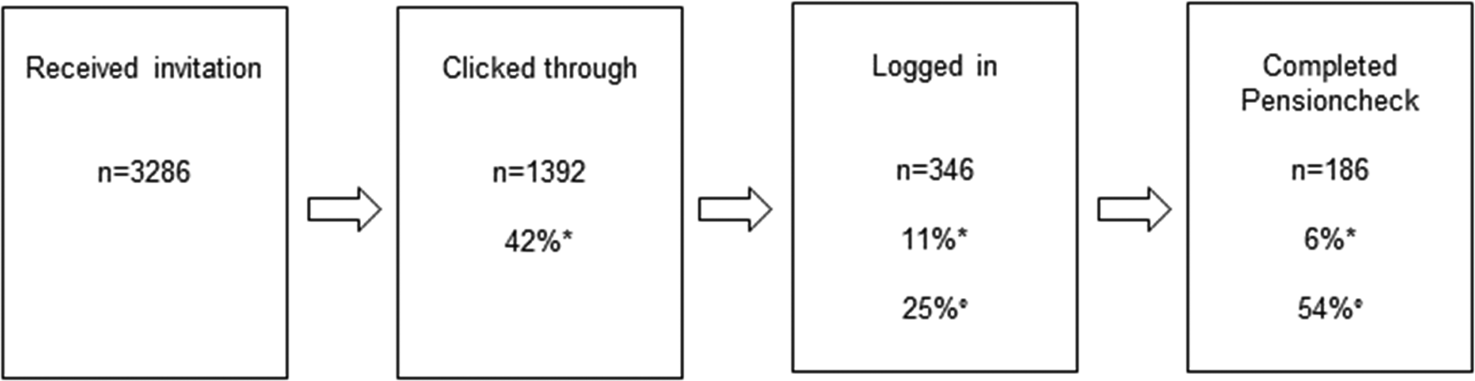
The average age of the participants is 45 years and the share of female employees is 33%. Figure 3 provides an overview of (sub-)sample sizes at the different stages of the experiment. In total, 42% of the individuals who received the email invitation clicked on the link in the invitation. Of those who clicked through, 25% logged in on the Pension check. This is equivalent to 11% of all participants in this experiment. Once logged in, more than half of the participants completed the Pension check. This is an indication that the login stage is the largest hurdle relative to clicking through and completing the Pension check.
Structure of dataset. Notes: *Denotes a percentage of the total sample and °denotes a percentage of the subsample of the previous stage.

The majority of the respondents logged in on the Pension check once, and about 10% of respondents logged in twice or more. The maximum of login attempts was six. Per individual, we took the longest attempt into consideration when analysing the time spent on the Pension check. The average time spent on the Pension check was 800 seconds (roughly 13 minutes). The page responsible for 60% of the respondents quitting the Pension check was the page about the composition of the accrued pension amount.
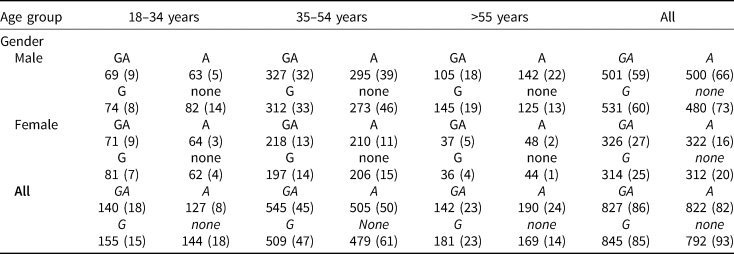
For an overview of the distribution of the number of participants per segment and condition for our dependent variables, see Table 1. The largest segments are middle-aged men and women and senior men. As only a small fraction of the total sample did the Pension check, the number of observations of the time spent in the Pension check is very low. The sum of the four numbers in the right bottom corner is equal to 3,286 (i.e., the total number of participants); and 346 (11%) of them spent time on the Pension check.
Number of participants by segment and tailoring type

GA, tailoring on gender and age; A, tailoring on age; G, tailoring on gender; none, no-tailoring.
Column and row totals are in italics. Regarding young males, for instance, 69 received an invitation tailored on age and gender, and nine out of these spent some time in the Pension check.
In parentheses is the number of participants who spent time on the Pension check.
3. Estimation strategy
3.1 Restricted models
First of all, we are interested in the effect of tailoring on PIB without taking into account any interaction between tailoring types, age categories or gender. In other words, we separately estimate three restricted models with three different dependent variables: clicking behaviour, login behaviour and the time spent in the Pension check. Those three dependent variables fall under PIB. For brevity, equation (1) summarises the three restricted models with PIB i referring to clicking behaviour in the first, login behaviour in the second and the time spent (in logs) in the third model. Clicking and login behaviour is measured by a binary variable set equal to 1 if the participant clicked through (logged into the Pension check). We also estimated the model explaining login behaviour for a sub-sample of participants who clicked through. The aforementioned estimations make use of the linear probability modelFootnote 2. Finally, we estimate equation (1) using ordinary least squares with the logarithm of time as a dependent variable. $t_{age_i}$ , $t_{g_i}$
 and $t_{ageg_i}$
 are dummy variables and refer to the tailoring type (age, gender, age and gender, respectively); no-tailoring is the reference category. young i and senior i are dummy variables that refer to the age categories (the middle-aged category is the reference) and ξ i is an error term.

We continue our analysis by estimating models that take into account differences in the effect of tailoring on PIB within and across age groups and gender.
3.2 First model: clicking behaviour
We use a linear probability model to estimate the effects of tailoring on the probability to click (see equation (2)). clicked i is a binary dependent variable which is set to 1 if someone clicked through.

Let I( ⋅ ) be an indicator function equal to 1 if individual i is in group j, and 0 otherwise. For consistency with the experimental setup, we distinguish between six segments (based on the three age categories and gender) in our empirical models. We constructed interactions between segments and tailoring dummies in line with the cells presented in Table 1. The groups are based on the six segments, i.e., age A ɛ {young, middle, old} in combination with gender G ɛ {male, female}, and the four tailoring types T ɛ {none, age, gender, age and gender}, which allows us to distinguish 24 groups. β j is the probability to click through for individuals of a group j. In total, we estimate 24 probabilities, one for each group. ɛi is an error term. Random assignment of the tailored invitations across all age and gender segments eliminates selection bias (Angrist and Pischke, Reference Angrist and Pischke2008). This allows us to interpret the difference for each segment between the estimated coefficient for any tailored invitation and the coefficient for the generic invitation as the causal effect of tailoring on PIB.
3.3 Second model: entering the Pension check
We continued our analysis to investigate whether the participant actually logged in and started the Pension check. We estimated the effects of tailoring on the probability to log in to the Pension check using equation (3). The binary dependent variable is login i, which is set to 1 if someone logged into the Pension check.

The 24 groups are based on age (young, middle, old), gender (male, female) and tailoring condition (none, age, gender, age and gender). γ j is the probability to log in for individuals belonging to group j and ν i is an error term. We also estimated a specification using conditional probabilities (conditional on having clicked through). That is, we also estimated equation (3) on a subsample of participants who clicked through (42% of the sample).
3.4 Third model: time spent in the Pension check
The final model we estimated is the time (measured in seconds) used to perform the Pension check. As already mentioned, we took the longest session spent on the Pension check into account when constructing the dependent variable. Considering the total of all attempts did not change the estimation results. We estimated equation (4) using ordinary least squares, with the dependent variable being the logarithm of time. We distinguish between the same age categories and tailoring conditions as in the other models. Due to the small variation for women, we pooled the data across gender, which left us with 12 sub-groups (including the base category). δ j is the estimated percentage change in the time spent on the Pension check relative to the reference category of middle-aged employees who received the generic email invitation. We included a direct gender effect denoted by α 1.

4. Results
4.1 Tailoring effects
4.1.1 General effects (restricted models)
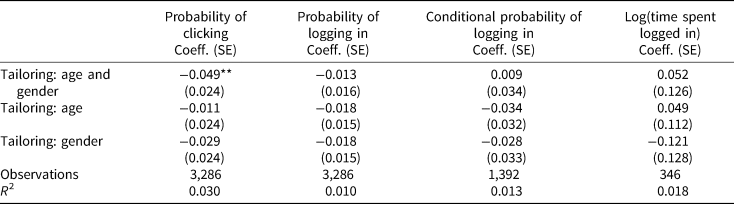
We start our analysis by estimating the restricted models summarised by equation (1). Table 2 shows the estimated differences in clicking probabilities, login-probabilities and the time spent (in %, due to logarithmic transformation) in the Pension check for the type of tailoring relative to the no-tailoring condition. The first three columns in Table 2 show the estimated probabilities to click through and to log in to the Pension check relative to the reference category of no-tailoring. The probability to click (column 1) is 4.9 percentage points lower for respondents who received the invitation tailored on age and gender than for respondents who received the generic invitation. Regarding logging in (unconditional and conditional on having clicked) and time spent, we found no differences between the tailored and non-tailored (generic) versions. We continue our analysis by inspecting tailoring effects within each segment.
Estimated tailoring effect on clicking and logging in, and estimated percentage difference in time spent on the Pension check

Heteroscedasticity-consistent standard errors in parentheses. ***p < 0.01, **p < 0.05, *p < 0.1
Reference category: no-tailoring. Log(time) refers to the logarithm of time (measured in seconds) and the coefficients are percentage shares. We controlled for gender and age in all specifications. In column three, the results were obtained for a subsample of respondents who logged in.
4.1.2 Tailoring effects by segments
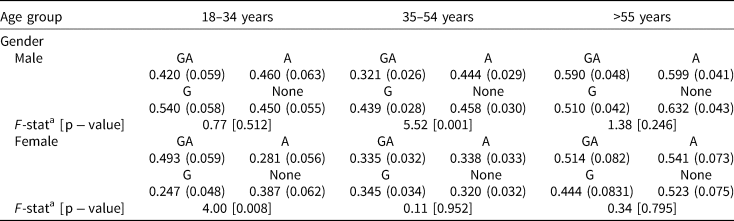
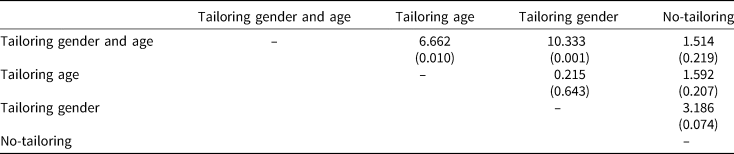
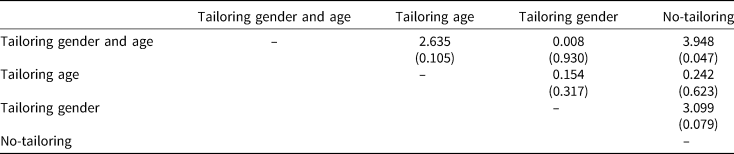
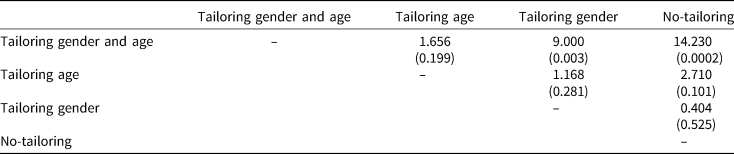
Table 3 presents the estimated probabilities to click through from the email invitation for each of the six segments based on equation (2). Within each segment, we distinguished between the tailoring type that was accorded to each respondent. We also tested for significant differences between the estimated probabilities within each segment. We computed the size of the tailoring effect for the segments for which we detected significant differences. See Tables A2–A6 in the Appendix for a detailed overview of the pairwise comparisons within particular segments. The results of the F-tests in Table 3 show that there are significant differences between the estimated probabilities to click for the segments of young women and middle-aged men. In other words, at least one probability within that particular segment is significantly different from the other probabilities.
Estimated probabilities of clicking on the link to the Pension check (n = 3,286)

GA, tailoring on gender and age; A, tailoring on age; G, tailoring on gender; None, no-tailoring.
Heteroscedasticity-consistent standard errors in parentheses.
a H0: all estimated probabilities within a segment are equal to each other.
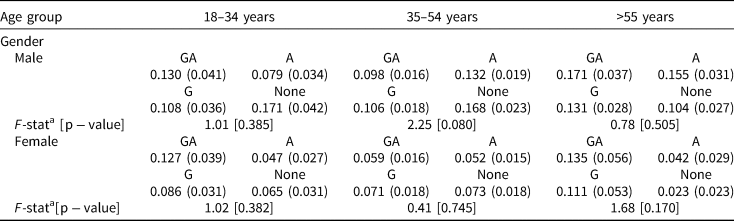
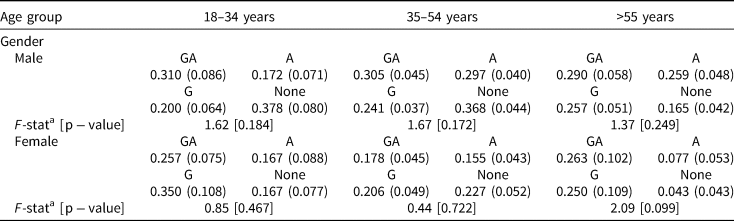
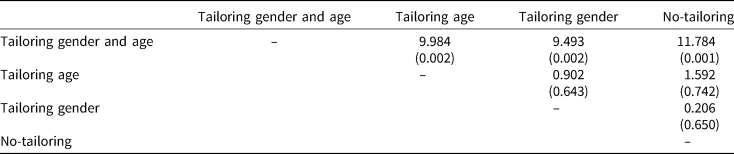
The greatest hurdle to delving into one's pension information was, for the participants in this experiment, logging in to the Pension check environment using the digital identity code. The estimation of equation (3) is shown in Table 4. The segment of middle-aged males is the only segment where at least one estimated probability to log in is significantly different from the other estimated probabilities to log in (p-value of the corresponding F-test is 0.080). To be able to compare the results for clicking and login behaviour, we repeated the analysis of login behaviour and estimated probabilities to log in, conditional on having clicked through. That is, we estimate equation (3) on a subsample of participants who clicked through. See Table 5 for the conditional probabilities. We only found significant differences at the 10% level between the probabilities to log in for the senior women segment due to tailoring.
Estimated probabilities of logging in into the Pension check (n = 3,286)

GA, tailoring on gender and age; A, tailoring on age; G, tailoring on gender; None, no-tailoring.
Heteroscedasticity-consistent standard errors in parentheses. Probabilities here are not conditioned on having clicked.
a H0: all estimated probabilities within a segment are equal to each other.
Estimated probabilities of logging in into the Pension check (conditional on having clicked, n = 1,392)

GA, tailoring on gender and age; A, tailoring on age; G, tailoring on gender; None, no-tailoring.
Heteroscedasticity-consistent standard errors in parentheses. Probabilities here are conditioned on having clicked.
a H0: all estimated probabilities within a segment are equal to each other.
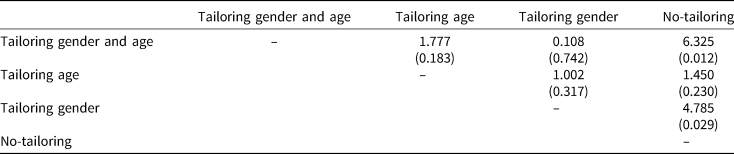
Finally, we look at the effort exerted in the Pension check, measured as time spent in seconds during the longest session in the Pension check. The estimation results of equation (4) are presented in Table 6. As discussed in Section 3, due to low numbers of observations for this analysis, we aggregated the segments of men and women. Middle-aged participants who received a generic invitation are the base category who, on average, spent 13 minutes per session in the Pension check. Only within the young age category were significant differences in the time spent on the Pension check between respondents who received the invitation tailored on age and gender and respondents who received the generic version and the tailored version on gender, respectively. We discuss the findings for every tailoring type separately.
Estimated percentage difference in time spent (relative to the base middle generic) on the Pension check (n = 346)

GA, tailoring on gender and age; A, tailoring on age; G, tailoring on gender; none, no-tailoring.
Heteroscedasticity-corrected standard errors in parentheses. ***p < 0.01, **p < 0.05, *p < 0.1. We controlled for gender in our model. We obtained the effects presented below by using the logarithmic transformation formula$\;100\% ( {exp^{\beta_j}-1} )$ , where β j is the estimated coefficient and exp ( ⋅ ) is a general exponential function.
a H0: all estimated probabilities within a segment are equal to each other.
Concerning the condition of tailoring based on age alone, we found no evidence of a tailoring effect. This implies that there were no differences in clicking and login behaviour or in the time spent in the Pension check between participants who received the invitation tailored on age and participants who received the generic invitation.
We found a negative tailoring effect of tailoring based on gender amounting to 14 percentage points for young females on the probability to click. Furthermore, we found a negative tailoring effect for middle-aged males of 6 (13) percentage points on the probability to log in (conditional on clicking). For senior women, we observed a positive gender-tailoring effect of 20 percentage points (though only at the 10% level) on the conditional probability to login. We did not find a gender-tailoring effect regarding the time spent in the Pension check.
As to the third tailoring type, tailoring on age and gender, we obtained the following results. We found a negative tailoring effect amounting to 13 percentage points on the probability to click for middle-aged males. Considering login behaviour, we found a negative tailoring effect of 7 percentage points for middle-aged males. For senior women, we found a positive tailoring effect of 26 percentage points regarding login behaviour conditional on having clicked through. Lastly, when looking at the time spent in the Pension check, we found a large positive tailoring effect for young respondents: those with a tailored version spent about 79% more time on the Pension check than those who did not receive a tailored invitation. The effect is conditional on having logged in. It is likely that a selective group has logged in to the pension check. For this reason, caution is warranted when interpreting the results on the time spent.
4.2 Gender and age effects
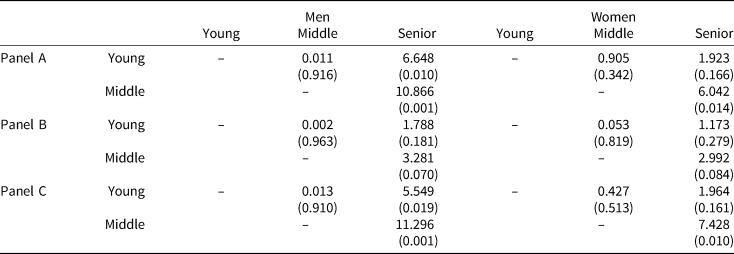
Our results enabled us to compare clicking, login behaviour and the time spent in the Pension check between men and women per age category and across age groups. For this, we compared the estimated coefficients for the generic invitation; that is, we only look at those who did not receive a tailored invitation, across age categories and gender. See Tables A7 and A8 for pairwise comparisons across age categories and gender.
For the youngest age group, we found no evidence of a significant difference between men and women regarding the probabilities to click. The same holds for the oldest age group. For the middle-age group, we found a statistically significant difference between men and women: middle-aged men were more likely to click through than their female counterparts were, by 13 percentage points. Regarding login behaviour (conditional and unconditional on having clicked through), men were consistently more likely to log in than women were for every age category. The differences amount to around 10 percentage points (15 percentage points, if the probabilities are conditioned on having clicked through). Since we pooled our observations for men and women, we cannot make any observations about gender differences in the time spent.
Across age groups, older men are more likely to click through than young or middle-aged men. The differences amount to 18 percentage points for young versus old and 17 percentage points for middle-aged versus old. Similarly, women from the 55+ category clicked through (on average) more often than women from the younger and middle-age categories. The percentage-point difference is 13 and 20, respectively.
Regarding login behaviour, middle-aged men were more likely (by 7 percentage points) to log in than men belonging to the senior category. The difference in estimated login probabilities between middle-aged women and 55+ women is around 7 percentage points. Repeating this analysis for login behaviour conditional on having clicked, we find results that are similar, although not in magnitude, to the case with absolute probabilities: middle-aged women had a 23 percentage-point higher probability to log in than did senior women. Senior men were significantly less likely to log in than were young (21 percentage points) or middle-aged men (20 percentage points). Respondents from the young category who received a generic invitation spent, on average, 45% less time in the Pension check than respondents from the middle category with a generic invitation. There were no significant differences in the time spent in the Pension check between middle-aged and older participants.
5. Conclusion and discussion
We conducted an experiment amongst employees of an insurance company in order to test whether tailoring affects their decision to gain more information about their pension situation. Employees were sent randomly assigned tailored email invitations encouraging them to perform an online check of their individual pension situation, the Pension check. The invitations were tailored based on age and gender, which resulted in three different tailoring types.
We found no evidence of an age-tailoring effect and predominantly mixed evidence of a gender-tailoring effect and a gender- and age-tailoring effect: There was evidence for a negative gender-tailoring effect and a negative gender- and age-tailoring effect for young females and middle-aged males concerning clicking behaviour. The results for login behaviour are mixed. Additionally, we found a large positive conditional age- and gender-tailoring effect for young participants regarding the time spent in the Pension check: Young respondents with a tailored invitation spent about 79% more time on it than did young respondents with a generic invitation, all conditional on having logged in. However, the low number of observations on which this latter result is based warrants caution: for instance, only 18 participants in the generic version of this segment (Table 1).
In general, we found that the control invitation letter proved to be more effective than the tailored letters. One possible explanation can be the forewarning effect (Petty and Cacioppo, Reference Petty and Cacioppo1979; Kamalski et al., Reference Kamalski, Lentz, Sanders and Zwaan2008). The participants' intrinsic motivation may have been crowded out by the persuasive intent of the tailored invitations. We also checked for the possibility that the generic invitation was more effective due to its conciseness relative to the tailored invitations. To address this concern, we tested whether the invitations differed in comprehensibility using the rationale that a longer text could be less comprehensible to the reader. A scan of all invitations through a language testing tool developed by the Humanities faculty of our research entity called LiNT (readability instrument for Dutch texts) showed that all texts score low on complexity and high on readability. For more details on this readability instrument, we refer to the dissertation of Kleijn (Reference Kleijn2018).
We also found evidence that tailoring could have a positive effect on the time spent in delving into one's pension situation conditional on having logged in. We should keep in mind, however, that only one out of four participants logged in to the Pension check after clicking through and that merely a small fraction of the entire sample (6%) completed the Pension check. We cannot rule out that the participants who are most interested in their pension situation self-selected into completing the Pension check. Attributing the positive time effect to tailoring the invitation to log in might be too ambitious given the overall negative tailoring effects on clicking behaviour.
We also found interesting results on age- and gender effects on PIB. Older men and women were most likely to click through, compared to their middle-aged and young counterparts. These results may indicate that the older generation recognises the urgency of looking into one's pension situation more than the young and middle-aged groups do. This signals the importance of considering carefully how best to reach the young and middle-aged (as they are still facing many important financial decisions) in order to help them realise that, also for them, there is some urgency to act. Another finding was that women consistently logged in less often than men did. This result could be explained by the fact that women might use their digital identification code less often in their daily life than men do: an indication of a certain task division within couples. In a classic scenario, men are more likely to be the household member who usually takes care of financial matters in the household.
We can conclude that in this setting, tailoring did not achieve the desired effect. In general, we found negative to zero tailoring effects. More experimental evidence, preferably with a different research population and various tailoring approaches, is needed in order to identify which mechanisms push people away and which pull them towards engaging in their pension situation.
Another explanation for our results can be tied to the tailoring methodology. It is up for discussion whether the tailoring approach we applied is strong enough and occurs in the right phase of the pension communication process. Perhaps tailoring in the navigation phase or in the content phase of pension information documents might be more effective.
Approaching various age groups in a different manner is a step in the right direction, as it provides a clear-cut division that also requires a minimum effort by pension plan providers. Taking life-events into account could be one possible approach, as was done by Blakstad et al. (Reference Blakstad, Brüggen and Post2017). Differentiation according to gender proved to be more difficult to put into practice, as it was hard to determine how to approach men and women differently and to incorporate gender-based differentiation in the design of the materials. Tailoring according to gender using metaphors that create familiarity with a financial topic like pensions among men and women is an interesting venue for future research. Boggio et al. (Reference Boggio, Fornero, Prast and Sanders2015) and Prast et al. (Reference Prast, Sanders and Leonhard2018) are two interesting studies exploring the role of metaphors in investor communication. We recognise that alternative ways to implement tailoring into a pension information document could have yielded different results.
It should also be kept in mind that the population we analysed in this study has a higher affinity with financial planning (due to their employment in the insurance sector). Hence, we refrain from generalising our findings to the Dutch population. As already noted, it is crucial to collect experimental evidence for different (and more representative) populations. As well, we should mention that the generic invitation is shorter than the tailored invitations. A valid concern is whether we measured the impact of tailoring or rather the phrasing of the benchmark. It is an utterly challenging task to keep the length of the invitations identical and at the same time to tailor to personal characteristics. We chose to add information in the shape of quotes or certain key sentences in the tailored documents, necessarily increasing their length a bit.
We are confident to be the first to have devised and conducted an experiment on tailoring pension communication – an experiment that enables us to identify causal effects, be they restricted to our research population. Segmenting into groups, as was done in Eberhardt et al. (Reference Eberhardt, Brüggen, Post and Hoet2016), was a first crucial step in finding ways to activate pension plan participants. We set a second step by actually intervening in the information provided and testing those effects.
The challenge for future research is to identify per segment what the optimal approach is to get people to master the technical barriers of obtaining pension information (e.g., to log in) and to spark their interest in the content of the information provided. The importance of the trigger phase in the analysis of PIB should not be underestimated. Identifying which groups one would like to reach and finding key characteristics in order to define those groups is a good start. The next step should include formulating more specific aims per group rather than pursuing the goal of informing everyone uniformly about their pension situation. When trying to realise those aims in the development of, for instance, the navigation structure of a website, or the content of information materials, insights gleaned from other sectors and fields (think of the tourism sector and marketing strategies) can be of tremendous value. Taking account of other personal and behavioural characteristics than age and gender can enrich the understanding of what drives people towards or deters them from deepening their knowledge of their own pension situation. Future research could, for instance, be directed at eliciting attitudes and preferences about (pension) information and saving behaviour. The extent to which people value future consumption relative to present consumption, or the extent to which people appreciate complete or concise information, could be alternative key variables that go beyond common key characteristics. If we can identify individuals who prefer the short term over the long term, we may be able to target them in such a way that their long-term mind-set is activated.
Recent developments that can be observed around the use of Big Data may also be pertinent for future research on tailoring pension communication. Discovering patterns in browsing behaviour and social media activity of customers creates opportunities for companies to offer products that they deem to be more suitable for their customers. This development may also have (as yet undiscovered) benefits for non-commercial research on consumer behaviour. A paper that has been the main output of the Netspar Pension Innovation Programme 2015–2016 (Bode et al., Reference Bode, Gijsen, van Ewijk and van de Grootevheen2016) calls for pension plan providers to reap the benefits of the rise of Big Data (a recommendation that is accompanied by a word of caution). The authors, observing that insights from Big Data are already being used in the insurance sector, envisage opportunities for the pension sector to benefit from the availability of Big Data. Pension plan providers could then collect data on risk attitudes and the financial situation of their clients and use these to tailor pension information to the needs of their clients while complying with their duty of care.
Supplementary material
The supplementary material for this article can be found at https://doi.org/10.1017/S1474747220000141
Acknowledgement
We gratefully acknowledge financial support by Netspar for Large/Medium vision projects for the following project: Preparing for Retirement: Tailoring, Literacy and Effective Pension Communication (LMVP2014.02). Furthermore, we thank Rob Alessie, Wiebke Eberhardt, Franziska Heinicke and Hans Bloemen for their valuable comments, and the participants of the Netspar Pension Day 2016 in Utrecht, the International Netspar Pension Workshop 2017 in Leiden and the participants of the Netspar Pension Workgroup in October 2017 and February 2018, for a lively and fruitful discussion. We thank Henk Pander Maat for valuable comments and for helping with the text analyses with the LiNT-tool (a tool for readability of Dutch texts).
Appendices
A. Tailoring
The table below provides the names and corresponding ages that were displayed underneath each quote as a means of tailoring based on gender.
Name and age beneath every quote, per version

B. Pairwise comparisons supplementing the estimation results
Pairwise comparisons of the probabilities to click within the young female segment (F-statistic and p-value between brackets)

Pairwise comparisons of the probabilities to click within the middle-aged male segment (F-statistic and p-value between brackets)

Pairwise comparisons of the probabilities to log in within the middle-aged male segment (F-statistic and p-value between brackets)

Pairwise comparisons of the probabilities to log in (conditional on clicking through) within the senior female segment (F-statistic and p-value between brackets)

Pairwise comparisons of the percentage time spent in the Pension check within the young segment (F-statistic and p-value between brackets)

Pairwise comparisons across age categories (F-statistic and p-value between brackets) by gender

Pairwise comparisons across gender by age categories (F-statistic and p-value between brackets)