I. INTRODUCTION
CuInSe2 (CIS) and related compounds have attracted much attention as photovoltaic devices because of their strong light absorption and appropriate band gap for absorbing solar radiation.Reference Shay, Tell, Kasper and Schiavone1, Reference Herberholz, Nadenau, Rühle, Köble, Schock and Dimmler2 An advantage of solar cells made from polycrystalline thin films is that the thickness of the CIS absorption layer is one-hundredth that of crystalline silicon solar cells.Reference Höring, Neumann, Sobotta, Schumann and Kühn3–Reference Jaffe and Zunger5 Efficiencies of 19.9 and 13.5% have been reported for small-scale and large-scale CIS-based solar cells, respectively.Reference Repins, Contreras, Egaas, DeHart, Scharf, Perkins, To and Noufi6, Reference Green, Emery, Hshikawa and Warta7 The CIS absorber usually exhibits p-type conductivity because of the formation of a Cu-poor CIS thin film.Reference Schmid, Ruckh, Grunwald and Schock8 In addition, a thin layer of n-type CuIn3Se5 exists on the surface of a Cu-poor CIS-based absorber. Schmid et al.Reference Schmid, Ruckh, Grunwald and Schock8 first reported that the p-type conductivity of the CIS absorber layer and the p-n junction between the p-type CIS and n-type CuIn3Se5 play important roles in enabling high-efficiency CIS solar cells. A number of structural studies on Cu-poor CIS compounds have been carried out in the last few decades.Reference Palatnik and Rogacheva9–Reference Paszkowicz, Lewandowska and Bacewicz18 However, the structural details of Cu-poor CIS compounds are still under discussion.
Several phases have been identified in the Cu2Se–In2Se3 pseudobinary system.Reference Hönle, Kühn and Boehnke10, Reference Boehnke and Kühn19 CIS (Cu/In = 1.0) assumes a chalcopyrite structure (α phase). The chalcopyrite structure, which is close to the zincblende structure, has a tetragonal unit cell with space group I4(−)2d. A key feature of chalcopyrite CIS is that both Cu and In atoms are surrounded by four Se atoms, and the Se atom is coordinated with two Cu and two In atoms. The α phase extends to the composition of Cu0.82InSe1.91 (Cu/In = 0.82) in the Cu-poor region. Numerous efforts have been made in structural studies of the Cu-poor α phase to investigate the relationship between electrical properties and defects.Reference Tell, Shay and Kasper20–Reference Noufi, Axton, Herrington and Deb23 The chalcopyrite CIS can have variety of defects, such as vacancies, interstitials, and defect pairs. These native defects contribute to the p-type conductivity in CIS. Over the past decade, density functional calculations have shown that the formation energy for the Cu vacancy (V Cu) is small in comparison with other types of vacancies.Reference Zhang, Wei and Zunger24–Reference Maeda and Wada26 The p-type conductivity of the Cu-poor α phase is thus assumed to be due to the formation of acceptor levels from V Cu. However, no reliable identification of the defect structure has been obtained experimentally and a systematic structural analysis for Cu-poor CIS compounds at the α phase is needed.
In the Cu2Se–In2Se3 pseudobinary system, the β phase extends from the composition of CuIn2Se3.5 (Cu/In = 0.50) to near CuIn5Se8 (Cu/In = 0.20). For the CuIn5Se8 (Cu/In = 0.20) phase, two different crystal structures have been reported.Reference Kohara, Nishiawaki, Negami and Wada27 The first is the β phase consisting of tetragonal CuIn3Se5. The other is the γ phase with a hexagonal-layered structure. The β phase structure is similar to the chalcopyrite structure. Since this structure contains many defects, it is difficult to determine the actual structure. Hönle et al.Reference Hönle, Kühn and Boehnke10 reported that CuIn3Se5 in the β phase has a space group of P4(−)2c. This model is supported by Merino et al.Reference Merino, Mahanty, Leon, Diaz, Rueda and Vidales16 because the interatomic distances obtained by x-ray Rietveld analysis resemble realistic values. However, electron diffraction analysis shows that the space group of CuIn3Se5 is I4(−)2m, as reported by Hanada et al.Reference Hanada, Yamana, Nakamura, Nittono and Wada15 They also proposed that an appropriate structural model for CuIn3Se5 is a stannite-like structure with V Cu and In vacancies (V In). Recently, Paszkowicz et al.Reference Paszkowicz, Lewandowska and Bacewicz18 proposed another model for CuIn3Se5 with a space group of I4(−)2m from the Rietveld refinement of x-ray diffraction (XRD) data. These structural models were obtained using only Rietveld refinement of XRD data, and so further studies using other analytical methods are necessary to verify the validity of the models.
X-ray absorption fine structure (XAFS) is a powerful method to investigate the local structure surrounding the absorbing atom, including the valence state. X-ray absorption near-edge structure (XANES) provides information on the electric structure and the structural symmetry surrounding the absorbing atom. Extended x-ray absorption fine structure (EXAFS) also gives information on the local structure of the absorbing atoms; in particular, the coordination number (CN) and bond distance between the absorbing atom and neighboring atoms can be estimated by curve fitting analysis of the EXAFS. Some XAFS studies on Cu-poor CIS compounds have been reported to analyze the defect structure.Reference Chang, Wei, Johnson, Zhang, Leyarovska, Bunker and Anderson17, Reference Bacewicz, Wolska, Lawniczak-Jablonska and Sainctavit28–Reference Merino, Díaz-Moreno, Subías and Leön30 Most studies have focused on the structure of the CuIn3Se5 (β phase), and so studies on the structure of the Cu-poor α phase are limited. In addition, structural studies on CuIn3Se5 have been generally conducted using only EXAFS, without a concurrent XANES analysis. Lewandowska et al.Reference Lewandowska, Bacewicz and Fillipowicz31 reported EXAFS study of Cu–In–Se system. However, they did not analyze the In K-edge XAFS. Merino et al. reported the relationship between the bond length of Cu–Se and In–Se and the Cu/In ratio. However, they did not analyze the Se K-edge XAFS. Chang et al.Reference Chang, Wei, Johnson, Zhang, Leyarovska, Bunker and Anderson17 analyzed Cu K-, In K-, and Se K-edges and obtained a self-consistent set of local structural parameters. However, some of the parameters, such as Debye–Waller factors, were fixed for their analysis of Se K-edge data. Debye–Waller factors influence the CNs and bond lengths. Therefore, it is necessary to fit the CNs and the bond lengths of both Cu–Se and In–Se without fixing Debye–Waller factors. Furthermore, XANES studies were not performed. Bacewicz et al. and Wolska et al. studied Se K-edge XANES for the Cu-poor CIS compounds and proposed that the Cu defects were formed by a decrease in the Cu/In ratio.Reference Bacewicz, Wolska, Lawniczak-Jablonska and Sainctavit28, Reference Wolska, Bacewicz, Fillipowicz and Attenkofer29 However, they did not analyze the local structures of the other atoms (Cu and In).
In this study, we recorded the Cu K-, In K-, In L3- and Se K-edges’ XAFS spectra of Cu-poor CIS compounds (α phase: CuInSe2, Cu0.9InSe1.95, and Cu0.82InSe1.91; a mixture of α phase and β phase: Cu2In3Se5.5; and β phase: CuIn3Se5 and CuIn5Se8) and analyzed the local structures of these compounds. From the XANES spectra, the local structures surrounding each atom were estimated by comparison with reference samples with known structures. EXAFS analyses were performed using models consistent with the XANES analyses to obtain structural parameters such as the CN and bond length. Finally, we determined the defect structures of both the α and the β phases by comparison of the obtained structural parameters with some defect models of CIS.
II. EXPERIMENTAL
A. Preparation of CIS and reference samples
Cu–In–Se compounds were prepared by mechanochemical and sintering processes. Six different Cu2Se–In2Se3 pseudobinary compositions (CuInSe2, Cu0.9InSe1.95, Cu0.82InSe1.91, Cu2In3Se5.5, CuIn3Se5, and CuIn5Se8) were synthesized from elemental powders of Cu, In, and Se.Reference Wada, Kinoshita and Kawata32 The elemental powders were mixed according to objective molar ratios. The weighed powders were mixed by a planetary ball mill (Fritsch P-7) in a N2 atmosphere. The ball mill performed the mixing at a speed of 500 rpm for 20 min. The CIS compounds were obtained by heating the mixed powder at 500 °C for 30 min in a N2 atmosphere. Reference samples such as ZnIn2Se2, In2Se3, GeSe2, and Ga2Se3 were also synthesized by the aforementioned method. The phases of the synthesized samples were analyzed by powder XRD.
B. X-ray absorption spectroscopy
X-ray absorption spectra at the Cu K-, In K-, and Se K-edges were taken at the BL01B1 beamline at the SPring-8 facility of the Japan Synchrotron Radiation Research Institute (proposal no. 2010A1197). An Si(111) two-crystal monochromator was used for the incident beam for the Cu K-edge XAFS measurements. The Se K and In K edges’ XAFS spectra were recorded using a Si (311) setting for the two-crystal monochromator. The Se K-edge EXAFS spectra for the reference samples were taken at beamline BL-9A in Photon Factory (proposal no. 2009G132). An Si(111) two-crystal monochromator was used. All spectra were recorded in transmission mode, and ion chambers were used for the I 0 and I detectors. The samples, diluted in boron nitride (BN), were placed between the ion chambers. Energy calibration was carried out using a Cu foil for the Cu K-edge and Se K-edge measurements and an In foil for the In K-edge measurement. In L3‐edge, XANES spectra were taken using total electron yield with an Si(220) two-crystal monochromator setting at the BL-10 beamline in the SR center of Ritsumeikan University (proposal no. S21-11). The Cu K-, In K-, and Se K-edges’ XAFS spectra, except for the Se K-edge EXAFS spectra of the reference samples, were recorded in the quick scan mode. The Se K-edge EXAFS of the reference samples and In L3-edge XANES were recorded in step scan mode. Data reduction was carried out using the program REX2000 Ver.2.5.9 (Rigaku Co.). The EXAFS analysis was performed as described later. The χ spectra were extracted by removing the atomic absorption background using a cubic spline and were normalized to the edge height. The k3-weighted χ spectra (χ spectra) were Fourier transformed (FT) into r space, using the Fourier transformation range 3.0–15 Å−1. Curve fitting analysis was performed for the first shell (Cu–Se for the Cu K-edge, In–Se for the In K-edge, and Se–M (Cu or In) for the Se K-edge). The passive electron factor (S 02) of 1 was used in this study in the curve fitting analysis. The phase and amplitude functions were extracted from CIS, which has a chalcopyrite structure (I4(−)2d) by calculation using FEFF8.Reference Ankudinov, Ravel, Rehr and Conradson33
III. RESULTS
A. Powder XRD
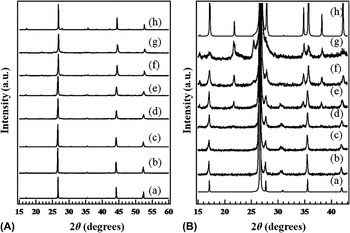
Figure 1(A) shows XRD patterns for a series of Cu-poor CIS compounds together with the simulated XRD patterns for CuInSe2 [Inorganic Crystal Structure Database (ICSD) no. 70051, I4(−)2d] and CuIn3Se5 (I4(−)2m, Ref. Reference Paszkowicz, Lewandowska and Bacewicz18). The CIS phase exhibited an XRD pattern consistent with the chalcopyrite structure (space group: I4(−)2d). Similar XRD patterns were obtained for Cu0.9InSe1.95 and Cu0.82InSe1.91. In the Cu2Se–In2Se3 system, the structure of Cu-poor CIS compounds with Cu/In ratios from 1.00 to 0.82 was found to be the chalcopyrite α phase with space group I4(−)2d. The structures of the Cu0.9InSe1.95 and Cu0.82InSe1.91 samples synthesized in this study corresponded to those reported in the literature. It has been reported that the lattice constants decrease with decreasing Cu/In ratio.Reference Boehnke and Kühn19 The change in lattice constant with decreasing Cu/In ratio was negligible. Therefore, no distinct diffraction peak shift could be observed in this study.
(A) X-ray diffraction (XRD) patterns of (a) simulation of CuInSe2 [Inorganic Crystal Structure Database (ICSD no. 70051)], (b) CuInSe2, (c) Cu0.9InSe1.95, (d) Cu0.82InSe1.91, (e) Cu2In3Se5.5, (f) CuIn3Se5, (g) CuIn5Se8, and (h) simulated pattern of CuIn3Se5 (Ref. Reference Paszkowicz, Lewandowska and Bacewicz18). (B) Expanded XRD patterns of (a) simulated CuInSe2 (ICSD no. 70051), (b) CuInSe2, (c) Cu0.9InSe1.95, (d) Cu0.82InSe1.91, (e) Cu2In3Se5.5, (f) CuIn3Se5, (g) CuIn5Se8, and (h) simulated CuIn3Se5 (Ref. Reference Paszkowicz, Lewandowska and Bacewicz18).

The XRD patterns of the Cu2In3Se5.5, CuIn3Se5, and CuIn5Se8 samples [Fig. 1(A)] were similar to those of CuInSe2, Cu0.9InSe1.95, and Cu0.82InSe1.91 and were consistent with the chalcopyrite structure. Extended XRD patterns [Fig. 1(B)], however, showed that the Cu2In3Se5.5, CuIn3Se5, and CuIn5Se8 samples had new diffraction peaks at 21.8°, 34.7°, and 38.0°, respectively. It has been reported that the XRD pattern of the CuIn3Se5 (β phase) has these diffraction peaks. The space group of CuIn3Se5 is I4(−)2m as determined by an electron diffraction.Reference Hanada, Yamana, Nakamura, Nittono and Wada15 In the case of Cu2In3Se5.5, the diffraction peak at 31.7° attributed to the α phase remained. Therefore, Cu2In3Se5.5 can be thought of as a mixture of the α phase with space group I4(−)2d and the β phase with space group I4(−)2m. The CuIn3Se5 and CuIn5Se8 samples are found to be β phase because the characteristic diffraction peak of the α phase at 31.7° was absent. Moreover, the diffraction peak positions in the CuIn3Se5 and CuIn5Se8 samples gradually shifted to higher angles with decreasing Cu/In ratio. This shift is attributed to a contraction of the lattice constants. This lattice contraction would seem to be related to the formation of defects in the structure. However, no information on structural defects is provided from the XRD patterns shown in Fig. 1.
B. Cu K-edge XANES
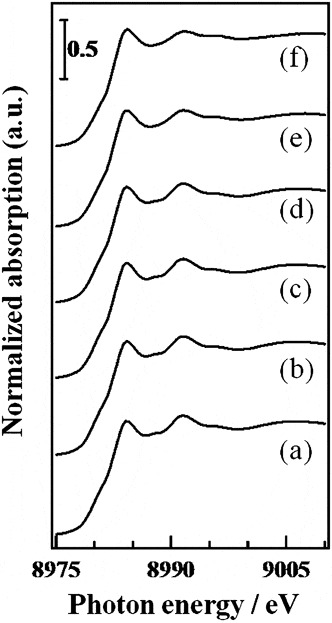
Figure 2 shows the Cu K-edge XANES spectra of several Cu-poor CIS compounds. All samples had the same absorption edge energy, and no pre-edge peak in the range of 8975–8980 eV characterized by the 1s→3d forbidden transition of Cu2+ species was observed.Reference Kosugi, Tokura, Takagi and Uchida34–Reference Sano, Komorita and Yamatera36 Since the only oxidation state of Cu is Cu+ in CIS, the valence of the Cu atoms in Cu-poor CIS compounds is monovalent and does not affect the Cu/In ratio. The XANES spectra of Cu0.9InSe1.95, Cu0.82InSe1.91, and Cu2In3Se5.5 corresponded to that of CIS. Therefore, not only the oxidation state but also the local structure of the Cu atom in Cu0.9InSe1.95, Cu0.82InSe1.91, and Cu2In3Se5.5 resemble that of CuInSe2. Although the XANES spectra of CuIn3Se5 and CuIn5Se8 were also similar to that of CuInSe2, the intensity of the absorption band appearing at 8992 eV was observed to slightly decrease with decreasing Cu/In ratio. In the Cu oxides, the bands appearing in the XANES region derive from the 1s→4p electron transition and the energy positions and the intensities of the bands are sensitive to the local structure of the Cu species.Reference Kosugi, Tokura, Takagi and Uchida34, Reference Sano, Komorita and Yamatera36 Therefore, the decrease in the band intensity observed at 8992 eV in CuIn3Se5 and CuIn5Se8 is due to a change in the local structure about the Cu atom relative to that in CuInSe2. It is clear from the XRD patterns shown in Fig. 1 that the CuIn3Se5 and CuIn5Se8 samples have a crystal structure different from CuInSe2, Cu0.9InSe1.95, and Cu0.82InSe1.91. The local structure of Cu atoms in CuInSe2, Cu0.9InSe1.95, and Cu0.82InSe1.91, for which XRD shown were consistent with the space group of I4(−)2d, does not change with decreasing Cu/In ratio. Structural changes around Cu were observed for the CuIn3Se5 and CuIn5Se8 samples for which XRD demonstrated a space group of I4(−)2m. Therefore, the Cu/In ratio affects the local structure of Cu atom in Cu-poor samples.
Cu K-edge x-ray absorption near-edge structure (XANES) spectra of (a) CuInSe2, (b) Cu0.9InSe1.95, (c) Cu0.82InSe1.91, (d) Cu2In3Se5.5, (e) CuIn3Se5, and (f) CuIn5Se8.

C. Cu K-edge EXAFS
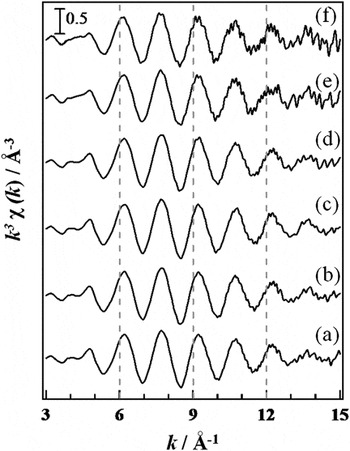
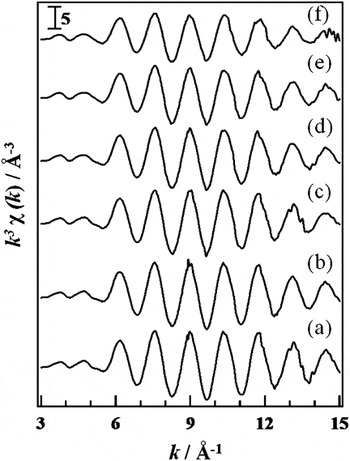
The Cu K-edge χ spectra of several Cu-poor CIS compounds are shown in Fig. 3. The χ spectra of Cu0.9InSe1.95, Cu0.82InSe1.91, and Cu2In3Se5.5 were similar to those of CuInSe2. On the other hand, a relative decrease in the amplitude of the χ spectra of CuIn3Se5 and CuIn5Se8 could be observed with decreasing Cu/In ratio. In addition, the χ spectra range of 3–5 Å−1 for CuIn3Se5 and CuIn5Se8 were slightly different from those of the other samples. Therefore, it is assumed that a difference in the structural environment around the Cu atom exists between chalcopyrite-type CuInSe2, Cu0.9InSe1.95, Cu0.82InSe1.91, and Cu2In3Se5.5, and the others. This result corresponds to that obtained from the Cu K-edge XANES.
Cu K-edge χ spectra of (a) CuInSe2, (b) Cu0.9InSe1.95, (c) Cu0.82InSe1.91, (d) Cu2In3Se5.5, (e) CuIn3Se5, and (f) CuIn5Se8.

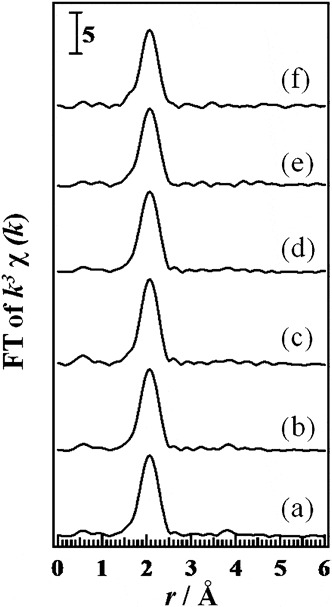
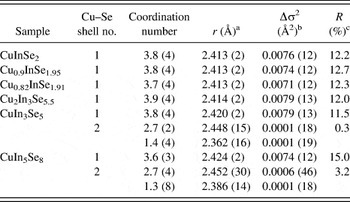
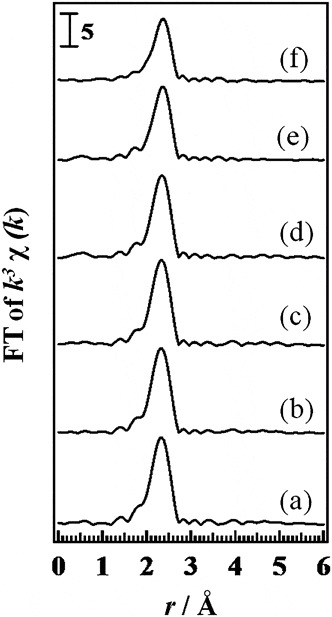
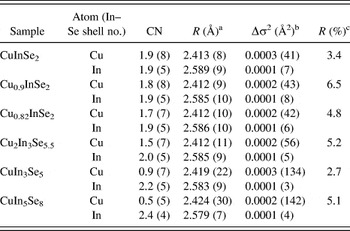
Figure 4 shows the FT spectra of the χ spectra shown in Fig. 3. The peak appearing at ∼2.0 Å in all spectra is attributed to the Cu–Se bonds. Although the peak intensity of CuIn3Se5 and CuIn5Se8 at ∼2.0 Å was slightly smaller than that of other compounds (CuInSe2, Cu0.9InSe1.95, Cu0.82InSe1.91, and Cu2In3Se5.5), we could not find any remarkable difference among the FT spectra of the samples. We performed fitting analysis against the peak at 1.6–2.4 Å in Fig. 4, which is attributed to the Cu–Se bonds, to obtain the structural parameters of the Cu–Se coordination shells. The structural parameters of the Cu–Se coordination shells are shown in Table I. All samples could be fitted with one unique Cu–Se coordination shell. The CIS sample, which assumes the chalcopyrite structure, showed four Cu–Se bonds with a bond length of 2.413 Å. The average local structure of the Cu atom in CIS as determined by XRD is that Cu has tetrahedral CuSe4 structure with a Cu–Se bond length of 2.414–2.436 Å.Reference Knight12, Reference Parkes, Thomlinson and Hampshiere21, Reference Spiess, Haeberln, Brandt, Räuber and Schneider37–Reference Frolow, Chernyak, Cahen, Hallak, Gabboun, Kvick and Graafama40 The structural parameters determined by EXAFS are in good agreement with those determined by XRD. The CN of all samples is ∼4. The bond length of Cu–Se bonds was nearly constant in all samples. The decrease in the amplitude of the χ spectra in the CuIn3Se5 and CuIn5Se8 samples, however, cannot be explained by the bond length. Moreover, the R factor [R factor = (Σ(χ data − χ fit)2/Σ(χ data)2)1/2, here χ data is measured χ data and χ fit is fitted χ function] of the CuIn5Se8 sample (15%) was slightly high. Therefore, the fitting analysis for the peak in the FT spectra corresponding to the Cu–Se bonds of CuIn3Se5 and CuIn5Se8 in Fig. 4 was conducted using two Cu–Se coordination shells. The results are shown in Table I. We can fit them with low R factors. Both samples have a shorter Cu–Se bond with a CN of ∼1.3 and a longer bond with a CN of ∼2.7, and thus the total CN of Cu–Se is 4. If Cu–Se bonds with different bond lengths exist, the amplitude of the EXAFS oscillation will be reduced. In addition, the Cu K-edge XANES spectra of the CuIn3Se5 and CuIn5Se8 samples were different from those of the CuInSe2, Cu0.9InSe1.95, Cu0.82InSe1.91, and Cu2In3Se5.5 samples. These differences can be explained by the formation of a different Cu–Se bond length in the CuIn3Se5 and CuIn5Se8 samples; therefore, we proposed that these samples have four-coordinated CuSe4 species with two different Cu–Se bond lengths.
Fourier transformed (FT) spectra of Cu K-edge χ spectra of (a) CuInSe2, (b) Cu0.9InSe1.95, (c) Cu0.82InSe1.91, (d) Cu2In3Se5.5, (e) CuIn3Se5, and (f) CuIn5Se8.

Curve fitting results for the Cu–Se shells of Cu-poor Cu–In–Se compounds.

R fitting range is 1.6–2.5 Å and k fitting range is 3.0–15 Å−1.
a Bond distance.
b Relative Debye–Waller: Δσ 2 = (σ sample − σ reference)2.
c R factor: (Σ(χ data − χ fit)2/Σ(χ data)2)1/2.
D. In K-edge and In L3-edge XANES
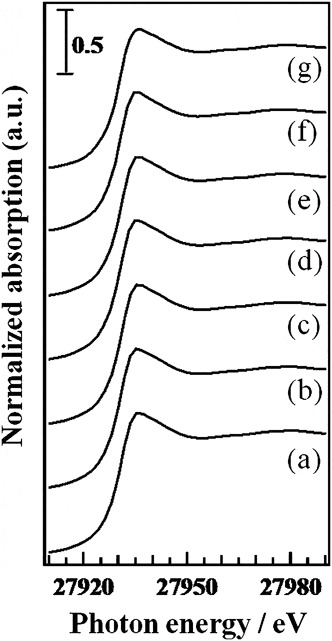
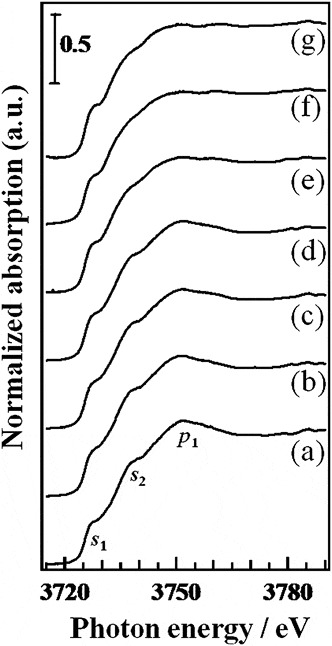
Figure 5 shows In K-edge XANES spectra for the samples. All samples exhibited similar XANES spectra, and the In K-edge XANES gave no information on the structural difference in the local structure about the In atom in Cu-poor CIS compounds. On the other hand, the In L3-edge XANES yielded more structural information on the Cu-poor CIS compounds. Figure 6 shows the In L3-edge XANES spectra of the various CIS samples. The CIS XANES spectrum is composed of two shoulders and a peak labeled s 1, s 2, and p 1, respectively. A broadening in the s 1 and s 2 peaks and a reduction of p 1 could be observed with decreasing Cu/In ratio in comparing CuInSe2 with Cu0.9InSe1.95. The s 1, s 2, and p 1 peaks are attributed to the electron transition from the 2p orbital to vacant s- or d-like orbitals of the absorbing In atom, and their shape and intensity depend on the local structure about the In atoms.Reference T-Thienprasert, Nukeaw, Sungthong, Porntheeraphat, Singkarat, Onkaw, Rujirawat and Limpijumnong41 Therefore, a decrease in the Cu/In ratio from 1.0 to 0.9 influences the local structure about In atom. The features, s 1, s 2, and p 1, did not significantly change in the Cu0.9InSe1.95, Cu0.82InSe1.91, and Cu2In3Se5.5 samples. This result indicates that the local structure around the In atom does not change for Cu/In ratios between 0.9 and 0.67(2/3). Further reduction in the Cu/In ratio (below 2/3) results in broadening of s 1 and s 2 and a gradual decrease in p 1. The drastic change of the In L3-edge XANES spectra from Cu2In3Se5.5 to CuIn5Se8 obviously signifies a structural change around the In atoms. The In L3-edge spectrum of a ZnIn2Se4 reference sample is also shown in Fig. 6. There have been two reports about the ZnIn2Se4 structure reporting that it has a defective stannite structure.Reference Gastaldi, Simeone and Viticoli42, Reference March and Robinson43 The first report stated that ZnIn2Se4 has three kinds of In sites and the other report stated that ZnIn2Se4 has two types of In sites. All In atoms in both structures are tetrahedrally coordinated by Se, e.g., InSe4. The differences between the different InSe4 environments lie in the Se–In–Se angle. The XANES spectrum of ZnIn2Se4 resembles that of CuIn5Se8. Therefore, it is expected that some InSe4 species with different Se–In–Se angle exist in CuIn5Se8, according to ZnIn2Se4.
In K-edge XANES spectra of (a) CuInSe2, (b) Cu0.9InSe1.95, (c) Cu0.82InSe1.91, (d) Cu2In3Se5.5, (e) CuIn3Se5, (f) CuIn5Se8, and (g) ZnIn2Se4.

In L3-edge XANES spectra of (a) CuInSe2, (b) Cu0.9InSe1.95, (c) Cu0.82InSe1.91, (d) Cu2In3Se5.5, (e) CuIn3Se5, (f) CuIn5Se8, and (g) ZnIn2Se4.

E. In K-edge EXAFS
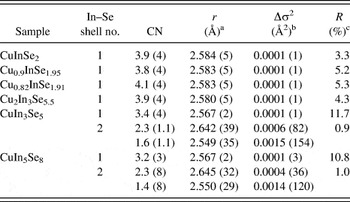
Figure 7 shows the In K-edge χ spectra of the samples. The oscillation patterns of the Cu-poor CIS samples are similar to that of CIS. Although the amplitude of the oscillations in the CuInSe2, Cu0.9InSe1.95, Cu0.82InSe1.91, and Cu2In3Se5.5 samples was almost the same, as that in CuIn3Se5 and CuIn5Se8, the amplitude was observed to gradually decrease with decreasing Cu/In ratio. The reduction in the amplitude can be clearly seen in the FT spectra, as shown in Fig. 8. The peak appearing at 2.0–2.3 Å is attributed to the In–Se bonds. The peak intensities of CuIn3Se5 and, especially, CuIn5Se8 were smaller to those of the other samples, CuInSe2, Cu0.9InSe1.95, Cu0.82InSe1.91, and Cu2In3Se5.5. The reductions in the amplitude of the χ spectra and the peak intensity of the FT spectra in CuIn3Se5 and CuIn5Se8 samples are due to the change in the local structure of the In atom. The main causes for these reductions are the decrease in the CN around In atom and the formation of the In species with different local structure. In light of the results of the In L3-edge XANES spectra, the presence of structurally different InSe4 coordination is more likely in CuIn3Se5 and CuIn5Se8 samples. We have fit the FT from 2.0 to 2.3 Å as shown in Fig. 8 to obtain the structural information about In–Se bonds. The structural parameters of the In–Se coordination shell are shown in Table II. The CuInSe2, Cu0.9InSe1.95, Cu0.82InSe1.91, and Cu2In3Se5.5 samples can be fit using a single In–Se coordination shell. Chalcopyrite CIS showed the four In–Se bonds with a bond length of 2.584 Å. It has been reported from XRD analyses that the local structure about an In atom in CIS can be characterized by InSe4 tetrahedral building blocks with a In–Se bond length of 2.558–2.602 Å.Reference Knight12, Reference Parkes, Thomlinson and Hampshiere21, Reference Spiess, Haeberln, Brandt, Räuber and Schneider37–Reference Frolow, Chernyak, Cahen, Hallak, Gabboun, Kvick and Graafama40 The structural parameters obtained in this study are in good agreement with values reported in the literature. The CN and the bond length of the In–Se bonds in the Cu0.9InSe1.95, Cu0.82InSe1.91, and Cu2In3Se5.5 samples nearly match those of CuInSe2. This result corresponds to the result of In L3-edge XANES spectra. The CuIn3Se5 and CuIn5Se8 samples can be fitted with one In–Se shell. However, the CN of In–Se shell was close to 3 and the R factor became larger than in other samples. In the In L3-edge XANES, we demonstrated that the local structure of the CuIn5Se8 resembles that of the ZnIn2Se4. The ZnIn2Se4 has some four-coordinated InSe4 structures. Thus, we carried out the fitting analysis using two In–Se coordination shells for the CuIn3Se5 and CuIn5Se8 samples. Obtained data are shown in Table II. Although the CN of the shorter In–Se shell is smaller than that of the longer one in both samples, the total CN is ∼4. The In L3-edge XANES and the In K-edge EXAFS spectra indicate that two kinds of InSe4 coordination polyhedron with different local structures are present in the CuIn3Se5 and CuIn5Se8 samples. Therefore, a fitting analysis would indicate that an [InSe4]long ([InSe4]long: longer In–Se bond) and an [InSe4]short ([InSe4]short: shorter In–Se bond) coordination polyhedron exist with the abundance ratios ([InSe4]long:[InSe4]short) of 2.3:1.6 and 2.3:1.4 in the CuIn3Se5 and CuIn5Se8 samples, respectively. These ratios are important for determining the structure of the Cu-poor CIS compound with space group of I4(−)2m. A detailed discussion of the structure follows later.
In K-edge χ spectra of (a) CuInSe2, (b) Cu0.9InSe1.95, (c) Cu0.82InSe1.91, (d) Cu2In3Se5.5, (e) CuIn3Se5, and (f) CuIn5Se8.

FT spectra of In K-edge χ spectra of (a) CuInSe2, (b) Cu0.9InSe1.95, (c) Cu0.82InSe1.91, (d) Cu2In3Se5.5, (e) CuIn3Se5, and (f) CuIn5Se8.

Curve fitting results for the In–Se shells of Cu-poor Cu–In–Se compounds.

R fitting range is 1.8–2.6 Å and k fitting range is 3.0–15 Å−1.
a Bond distance.
b Relative Debye–Waller: Δσ 2 = (σ sample − σ reference)2.
c R factor: (Σ(χ data − χ fit)2/Σ(χ data)2)1/2.
F. Se K-edge XANES
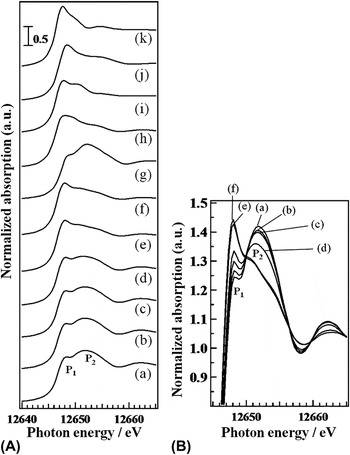
Figure 9(A) shows the Se K-edge XANES spectra of the samples. The CIS sample showed a small post-edge peak at 12,648.2 eV (P1) and a large and broad post-edge peak at 12,651.8 eV (P2). Decreasing Cu/In ratio results an increase in the intensity of the P1 peak and a gradual decrease in the intensity of the P2 peak with isosbestic points [as shown in Fig. 9(B)] in CuInSe2, Cu0.9InSe1.95, Cu0.82InSe1.91, Cu2In3Se5.5, and CuIn3Se5. This implies that the structural differences around Se occurred with decreasing Cu/In ratio. On the other hand, the XANES spectrum of CuIn5Se8 is close to that of CuIn3Se5. Therefore, changes in the local structure about Se for samples with Cu/In ratios between 0.20 and 0.33 are not negligible. Wolska et al. reported that the P1 and P2 peaks correspond to the In(s, p)–Se(p) antibonding orbital and the Se p-like density of states hybridized with Cu(s) and In(p) states, respectively.Reference Bacewicz, Wolska, Lawniczak-Jablonska and Sainctavit28, Reference Wolska, Bacewicz, Fillipowicz and Attenkofer29 These peak intensities depend on the symmetry around the Se atoms. Studies of Se K-edge XANES are limited.
(A) Se K-edge XANES spectra of (a) CuInSe2, (b) Cu0.9InSe1.95, (c) Cu0.82InSe1.91, (d) Cu2In3Se5.5, (e) CuIn3Se5, (f) CuIn5Se8, (g) CuGaSe2, (h) ZnIn2Se4, (i) In2Se3, (j) Ga2Se3, and (k) GeSe2. (B) Superimposed Se K-edge XANES spectra of (a) CuInSe2, (b) Cu0.9InSe1.95, (c) Cu0.82InSe1.91, (d) Cu2In3Se5.5, (e) CuIn3Se5, and (f) CuIn5Se8.

To further understand the Se K-edge XANES, we recorded XANES spectra of some reference compounds (CuGaSe2, In2Se3, GeSe2, Ga2Se3, and ZnIn2Se4) whose structures have already been determined. The XANES spectra of the reference compounds are also shown in Fig. 9(A). In the XANES spectrum of CuGaSe2, which has the chalcopyrite structure (space group: I4(−)2d, ICSD no. 28737), the P1 peak intensity is as small as that of CIS. This is because the local structure about the Se atom (Se bonds with two Cu atoms and two In atoms in a tetrahedral arrangement) in CIS is close to that in CuGaSe2, in which Se bonds with two Cu and two Ga atoms. On the other hand, the P1 peak intensities of ZnIn2Se4 and In2Se3 are similar to those of CuIn3Se5 and CuIn5Se8. The crystal structures of ZnIn2Se4 and In2Se3, confirmed by XRD measurements, are I4(−) (ICSD no. 40798) [or I4(−)m (ICSD no 68216)] and P61 (ICSD no. 1376), respectively. The local structure around Se in ZnIn2Se4 is characterized by a nominally threefold coordinated Se atom, whereas In2Se3 has two types of threefold coordinated Se sites. Ga2Se3 (space group: Cc, ICSD no. 35028) has 2- to 3-fold coordinated Se atoms with a larger P1 peak intensity than that of In2Se3. Moreover, GeSe2 (space group: P21/c, ICSD no. 614), which has only twofold coordinated Se atoms, showed the largest P1 peak intensity among all the samples. These results clearly showed that the CN between the Se atom and the neighboring atoms affects the P1 peak intensity and also showed that the decrease in the CN of the Se atom leads to an increase in the P1 peak intensity. Wolska et al.Reference Wolska, Bacewicz, Fillipowicz and Attenkofer29 reported that the symmetry of the tetrahedral SeM4 (M = Cu and In) structure, including the V Cu and the incorporation of the In atom in V Cu (InCu), influences the P1 peak intensity and distortions from T d symmetry and defects, such as V Cu and InCu in the tetrahedral SeM4 structure, enlarge the P1 peak intensity in the Cu–In–Se system including CIS. This relationship between the local structure of Se and the P1 peak intensity may extend to the other Se compounds as the P1 intensity of CIS is larger than that of CuGaSe2 whose Se structure is closer to T d symmetry than that of CIS. Therefore, the relationship between the increase in P1 intensity to a reduction in the CN of Se obtained in this study agrees with Wolska’s results.Reference Wolska, Bacewicz, Fillipowicz and Attenkofer29
In Fig. 9(A), it can be seen that the P1 intensity of CuIn3Se5 and CuIn5Se8 correspond to that of ZnIn2Se4 and In2Se3 with threefold coordinated Se atoms. Therefore, the CN of the Se atoms falls with decreasing Cu/In ratio. This implies the formation of cation vacancies such as V Cu. Moreover, the correspondence of the P1 peak intensities of CuIn3Se5 and CuIn5Se8 to those of ZnIn2Se4 and In2Se3 indicates that the Se atoms in the CuIn3Se5 and CuIn5Se8 have threefold coordinated structure. In this way, the P1 peak intensity is important for analyzing the local structure of Se atom in the metal selenide.
G. Se K-edge EXAFS
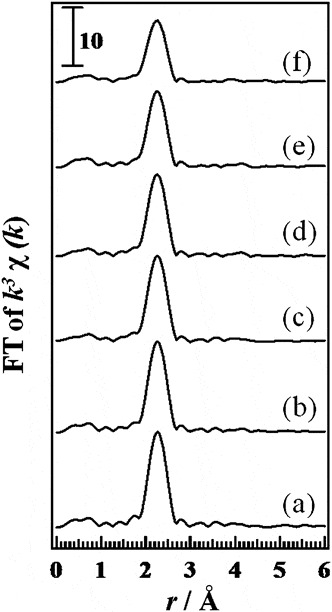
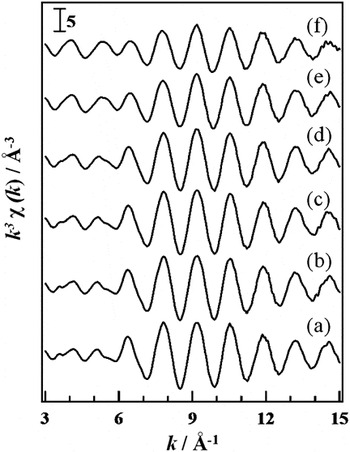
Figure 10 shows the Se K-edge χ spectra of a series of Cu2Se–In2Se3 pseudobinary compounds. The Cu-poor CIS samples exhibited a similar oscillation pattern to CIS. However, the amplitude of the oscillations was gradually reduced by decreasing the Cu/In ratio. Considering the results obtained by the Se K-edge XANES spectra, the reduced amplitude is likely due to a decrease in the CN of Se atoms. The FT spectra of the Se K-edge χ spectra are shown in Fig. 11. The peak appearing at 2.0−2.6 Å is attributed to the Se–M (M = Cu and/or In) bond. The peak intensity at 2.0−2.6 Å was gradually reduced with the decrease in the Cu/In ratio, according to the behavior of the amplitude in the Se K-edge χ spectra. A curve fitting analysis of the Se–M peak of the FT spectra was carried out to obtain structural information of the samples. All samples could be fitted with an Se–Cu shell and an Se–In shell. The obtained parameters of the samples are shown in Table III. In the case of CuIn3Se5 and CuIn5Se8, the obtained parameters are the average of two Cu–Se bonds and two In–Se bonds. The Se atom in the CIS sample had a four-coordinated structure with two Se–Cu bonds and two Se–In bonds. The bond lengths of the Se–Cu and Se–In bonds were 2.413 and 2.589 Å, respectively. Both bond lengths correspond to those obtained by the fitting analysis of the Cu K-edge EXAFS and the In K-edge EXAFS, as shown in Tables I and II. The chalcopyrite CIS has a tetrahedral Se species surrounded by two Cu and two In atoms. The reported bond lengths of the Se–Cu and Se–In bonds are 2.414−2.436 Å and 2.558−2.602 Å, respectively.Reference Knight12, Reference Parkes, Thomlinson and Hampshiere21, Reference Spiess, Haeberln, Brandt, Räuber and Schneider37–Reference Frolow, Chernyak, Cahen, Hallak, Gabboun, Kvick and Graafama40 The obtained parameters in the fitting analysis are close to the reported values. The bond lengths of Se–Cu and Se–In and the CN of the Se–In shell do not change with decreasing Cu/In ratio. The CN of the Se–Cu shell, however, was found to gradually decrease with decreasing Cu/In ratio. This means that the Cu-poor CIS in the Cu/In range from 1 to 2/3 have V Cu and InCu concentrations are not detectable. On the other hand, not only do the number of Se–Cu bonds decrease but there is also a corresponding increase in the number of Se–In bonds in CuIn3Se5 and CuIn5Se8. The total CN of both samples was ∼3. Therefore, the replacement of the In atoms on V Cu sites may occur in CuIn3Se5 and CuIn5Se8. The Se K-edge XANES spectra provide information on the local structure around the Se atom. An analysis of the XANES spectra suggests that the CN of Se falls with decreasing Cu/In ratio. The results from a fitting analysis yielded a CN of Se that was in excellent agreement with the results obtained from a XANES spectra analysis. The bond length behavior of the Se–Cu and Se–In bonds as a function of the Cu/In ratio resulting from a curve fitting analysis of the Se K-edge EXAFS demonstrates the same tendency as that obtained from a fitting analyses of the Cu K-edge and In K-edge EXAFS.
Se K-edge χ spectra of (a) CuInSe2, (b) Cu0.9InSe1.95, (c) Cu0.82InSe1.91, (d) Cu2In3Se5.5, (e) CuIn3Se5, and (f) CuIn5Se8.

FT spectra Se K-edge χ spectra of (a) CuInSe2, (b) Cu0.9InSe1.95, (c) Cu0.82InSe1.91, (d) Cu2In3Se5.5, (e) CuIn3Se5, and (f) CuIn5Se8.

Curve fitting results for the Se–M (M = Cu, In) shells of Cu-poor Cu–In–Se compounds.

R fitting range is 1.8–2.7 Å and k fitting range is 3.0–15 Å−1.
a Bond distance.
b Relative Debye–Waller: Δσ 2 = (σ sample − σ reference)2.
c R factor: (Σ(χ data − χ fit)2/Σ(χ data)2)1/2.
IV. DISCUSSION
A. A structural model for the α phase of CuInSe2, Cu0.9InSe1.95, and Cu0.82InSe1.91
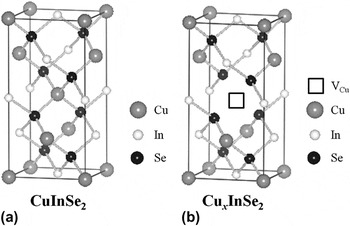
The CuInSe2, Cu0.9InSe1.95, and Cu0.82InSe1.91 samples have a chalcopyrite structure (I4(−)2d), as determined from the XRD pattern shown in Fig. 1. XAFS analysis showed that CIS has four-coordinated CuSe4, InSe4, and SeM4 (M = 2Cu and 2In) polyhedra. The bond lengths of Cu–Se and In–Se, determined by the Cu K-edge and In K-edge EXAFS analyses, were 2.413 and 2.584 Å, respectively, and these values corresponded to those obtained by an analysis of Se K-edge EXAFS data. Figure 12(a) shows the conventional unit cell for the chalcopyrite structure with space group of I4(−)2d.Reference Spiess, Haeberln, Brandt, Räuber and Schneider37 The CNs of Cu, In, and Se and the shell lengths of Cu–Se and In–Se, obtained in this study, are in good agreement with reported values.Reference Knight12, Reference Parkes, Thomlinson and Hampshiere21, Reference Spiess, Haeberln, Brandt, Räuber and Schneider37–Reference Frolow, Chernyak, Cahen, Hallak, Gabboun, Kvick and Graafama40 Therefore, the results of the XAFS analyses in this study are reliable. A decrease in the Cu/In ratio from 1 to 0.82 results in a reduction in the CN of the Se–Cu shell for the Se-centered tetrahedron, as obtained by an analysis of Se K-edge data. Other structural parameters, such as the CN of the Cu-centered Cu–Se shells, the In-centered In–Se shells, Se-centered Se–In shells, and all the bond lengths, did not change. These results clearly indicate an increase in V Cu in the chalcopyrite structure with decreasing Cu/In ratio, as shown in Fig. 12(b). It has been reported that V Cu and a complex defect involving InCu are easily formed in the CIS chalcopyrite structure based on first principle studies of defect formation energies for CIS.Reference Zhang, Wei and Zunger24–Reference Maeda and Wada26 Since the CN of the Se-centered Se–In shell does not change with decreasing Cu/In ratio, the InCu complex defect cannot exist in the Cu0.9InSe1.95 and Cu0.82InSe1.91 samples. The presence of V Cu is in good agreement with the results obtained by first principle studies. Moreover, it is known that the Cu-poor CIS thin film shows p-type conductivity, a fact critical for the efficiency of CIS solar cells.Reference Schmid, Ruckh, Grunwald and Schock8 The origin of the p-type conductivity is thought to be due to the formation of V Cu. The formation of a V Cu creates a hole, and this hole acts as a carrier giving rise to p-type conductivity. From the above mentioned results, the structural model of the α phase with a space group of I4(−)2d and the Cu/In ratio ranging from 1 to 0.82 is the chalcopyrite structure with a V Cu, as shown in Fig. 12(b).
(a) Structure of chalcopyrite CuInSe2 and (b) proposed crystal structure of Cu-poor Cu–In–Se compounds (0.82 < Cu/In < 1.0).

B. Structural model of β phase, CuIn3Se5, and CuIn5Se8
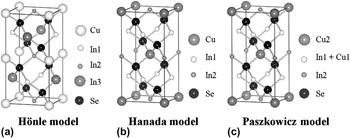
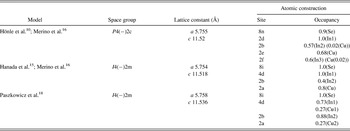
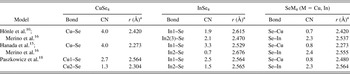
An analysis of the XRD patterns of CuIn3Se5 and CuIn5Se8 demonstrated that they crystallized in the β phase. The β phase has a similar structure to the chalcopyrite structure. Hönle et al.Reference Hönle, Kühn and Boehnke10 reported that CuIn3Se5 has the space group P4(−)2c, and this model is sup-ported by Merino et al.Reference Merino, Mahanty, Leon, Diaz, Rueda and Vidales16 The Hönle model is shown in Fig. 13(a), and the structural parameters obtained by an XRD analysis are shown in Table IV. This structure has one Cu atom site and three In (In1, In2, and In3) atom sites. The average local structures of Cu, In, and Se are also shown in Table V. The Cu atom has a tetrahedral CuSe4-coordinated environment with a Cu–Se bond length of 2.420 Å. The local structure about In is characterized by a In2–Se bond length equal to that of In3–Se. Therefore, an average tetrahedral InSe4 fragment possesses two kinds of In–Se bonds, namely an In1–Se bond with a length of 2.615 Å with a CN of 1.9 and an In2(3)–Se shell with a length of 2.470 Å and a CN of 2.1. The average local structure of an Se atom has a CN of about 0.7 and 2.3 for Se–Cu (2.420 Å) and Se–In (2.537 Å), respectively. An XAFS analysis of the CuIn3Se5 sample of the local structure about the Se atom is consistent with that of the Hönle model. However, the local structure about the Cu atom and the CNs of the long (In1–Se) and short (In2(3)–Se) In–Se shells differ from the Hönle model. Moreover, an electron diffraction analysis showed that CuIn3Se5 has the space group I4(−)2m. Therefore, this model is inconsistent with the CuIn3Se5 structure. There are two high integrity models for the CuIn3Se5, proposed by Hanada et al.Reference Hanada, Yamana, Nakamura, Nittono and Wada15 and Paszkowicz et al.Reference Paszkowicz, Lewandowska and Bacewicz18
Crystal structures of (a) Hönle, (b) Hanada, and (c) Paszkowicz models of CuIn3Se5.

Structural parameters of different CuIn3Se5 models.

Average structures of CuSe4, InSe4, and SeM4 (M = Cu, In) fragments in different CuIn3Se5 models.

a Bond distance.
Figure 13(b) shows the Hanada model as refined by Merino, which is a stannite-like structure with V Cu and In vacancies (V In).Reference Hanada, Yamana, Nakamura, Nittono and Wada15, Reference Merino, Mahanty, Leon, Diaz, Rueda and Vidales16 In this model, there is one kind of CuSe4 polyhedron and there are two kinds of InSe4 polyhedron (In1 and In2). Structural parameters such as the lattice constant, crystallographic site, and occupancy are shown in Table IV. The average local structure about Cu, In, and Se atoms using the Hanada model is shown in Table V. The Cu atom bonds to four Se atoms with a bond length of 2.273 Å. The average tetrahedral InSe4 has two kinds of In–Se bonds since the occupancies of the In1 site (4d site) and the In2 (2b site) site are 1 and 0.4, respectively. Therefore, the average structure of the InSe4 fragments in the Hanada model have CNs of 3.3 for In1–Se (bond length = 2.529 Å) and 0.7 for In2–Se (2.676 Å) (average bond length of In–Se is 2.555 Å.). The local structure of the Se atom has CNs and bond lengths of 2.4 and 2.555 Å for Se–In and 0.8 and 2.273 Å for Se–Cu, respectively. Compared with the structural parameters of CuIn3Se5 obtained from the present XAFS analysis (Table I), the CNs of In–Se shells for the In site are quite different. Although the CNs of the short and long In–Se shells determined by the present XAFS analysis are 1.6 and 2.3, respectively, CNs from the Hanada model are 3.3 and 0.7, respectively. Moreover, the bond length of the Cu–Se bonds determined by the XAFS analysis (2.424 Å) is much larger (>0.1 Å) than that estimated from the Hanada model (2.273 Å). Therefore, the results of the XAFS analysis are inconsistent with the Hanada model.
Paszkowicz et al.Reference Paszkowicz, Lewandowska and Bacewicz18 proposed another structure model of the CuIn3Se5 based on the I4(−)2m space group using Rietveld refinement of powder XRD data, as shown in Fig. 13(c). This model is similar to the Hanada model; however, the occupancies of the Cu and In atoms for each site are different. The structural parameters for the Paszkowicz model are shown in Table IV. Two type of Cu sites (Cu1 and Cu2) and two types of In (In1 and In2) sites exist in this model. In the light of the occupancies of the atoms, the average local structure about Cu atom is a four-coordinated CuSe4 polyhedron consisting of Cu1–Se with a CN of 2.7 and a bond length of 2.564 Å and Cu2–Se with a CN of 1.3 and a bond length of 2.304 Å, as shown in Table V. In also has a four-coordinated InSe4 structure. The average InSe4 structure has two different bonds, the first with a coordination number of 2.5 and a bond length of 2.564 Å and a second with coordination number 1.5 and a bond length of 2.565 Å. The average Cu–Se and In–Se bond lengths are 2.480 and 2.564 Å, respectively. The local structure about Se has a Se–Cu coordination number of 0.8 with a bond length of 2.480 Å and a Se–In coordination number of 2.3 with a bond length of 2.564 Å. Compared with the local structures about the Cu, In, and Se atoms in CuIn3Se5 obtained by an XAFS analysis (Tables I–III), the bond lengths of Cu1–Se and Cu2–Se in the Cu-centered CuSe4 polyhedron and those of In1–Se and In2–Se in the In-centered InSe4 polyhedron are slightly different (<0.12 Å). However, the coordination numbers of these shells in the Paszkowicz model are in accord with the results of the Cu K-edge and In K-edge XAFS analysis (2.7 for Cu1–Se, 1.4 for Cu2–Se, 1.6 for In1–Se, and 2.3 for In2–Se, in Tables I and II). Moreover, the coordination numbers and the bond lengths of Se centered Se–Cu and Se–In polyhedron mostly correspond to those obtained from a Se K-edge XAFS analysis. The XRD pattern reflects average periodic long-range atomic order. The XRD analysis yields the location of crystallographic sites and their occupancies. The bond lengths are determined by the distance between the crystallographic sites. In contrast, XAFS indicates the average local structure around the target atom. Local structures such as symmetry, bond lengths, and coordination numbers are well determined by the XANES and EXAFS data. However, the XAFS data does not include information on long-range order. The difference in the bond lengths (<0.12 Å) between the XRD analysis in the Paszkowicz model and the XAFS analysis is due to the differences in the measuring methods. On the other hand, the coordination numbers determined by the occupancies of the Cu, In, and Se atoms in the Paszkowicz model closely agree with those determined by the XAFS analysis. The correspondence of the coordination numbers obtained by the analysis of the long-range order and the local structure indicates that the Paszkowicz model is a reliable candidate structure for CuIn3Se5.
Zhang et al.Reference Zhang, Wei and Zunger24, Reference Zhang, Wei and Zunger25 and Maeda and WadaReference Maeda and Wada26 showed that the defect pairs such as (2V Cu + InCu) have particularly low formation energies for Cu-poor Cu–In–Se compounds. In the Paszkowicz model, the defect pairs of (2V Cu + InCu) are formed with decreasing Cu/In ratio. In addition, V In and CuIn (substitution of Cu for In site) defects are also formed in the Paszkowicz model. Although this calculation revealed that the formation energies of V In and CuIn are higher than those of V Cu and InCu, it is possible that the formation energy of a complex defect such as (3V Cu + V In + 2InCu + CuIn) is lower than that of the defect pair of (2V Cu + InCu) in Cu-poor Cu–In–Se compounds. It is difficult to calculate the formation energy of a complex defect because of the computational demands associated with the need to use a large supercell. The Paszkowicz model, at least, does not contradict the calculation results.
In the Se K-edge EXAFS analysis, the coordination number of the Se–Cu shell was found to decrease while that of the Se–In bond increased with decreasing Cu/In ratio from CuIn3Se5 to CuIn5Se8. However, the coordination numbers of Cu1–Se and Cu2–Se, obtained by a Cu K-edge EXAFS analysis, and those of In1–Se and the In2–Se, obtained by a In K-edge EXAFS analysis, exhibited negligible change with decreasing Cu/In ratio. These results clearly showed that the molar ratios of Cu1/Cu2 and In1/In2 do not change and that only the Cu (sum of Cu1 and Cu2)/In (sum of In1 and In2) ratio changes with decreasing Cu/In ratio. Using the molar ratio of Cu, In, and Se atoms in CuIn5Se8, we can estimate reasonable occupancy values for Cu1, Cu2, In1, and In2 (17%, 17%, 78%, and 93%, respectively) in the Pazkowicz model in Fig. 13(c).
V. CONCLUSION
We recorded XAFS spectra of a series of Cu2Se–In2Se3 pseudobinary compounds and analyzed them in detail to elucidate the underlying crystal structure. An analysis of the Cu K-edge XANES and EXAFS spectra showed that the local structure about the Cu atom in the CuInSe2, Cu0.9InSe1.95, Cu0.82InSe1.91, and Cu2In3Se5.5 samples had a CuSe4 tetrahedral character with the same Cu–Se bond length in spite of differing Cu/In ratios. However, a further decrease in the Cu/In ratio led to a change in the local structure about the Cu atom, and the CuSe4 polyhedron was found to have two types of Cu–Se bonds in the CuIn3Se5 and CuIn5Se8 samples. Similar results for the local structure about the In atom were obtained from an analysis of the In K-edge XANES and EXAFS spectra, while the CuIn3Se5 and CuIn5Se8 samples exhibited an InSe4 tetrahedral structure with differing In–Se bond lengths. From the results of a Se K-edge XANES analysis, it was expected that the coordination number of the Se–M (M = Cu or In) shell would decrease gradually with decreasing Cu/In ratio. A curve fitting analysis of the Se K-edge EXAFS showed that the coordination number of the Se–Cu shell decreased with decrease in Cu/In ratio. Moreover, the coordination number of the Se–In shell increased with decreasing Cu/In ratio over the range of 1/5 < Cu/In < 2/3. From these XAFS results, we can determine the structure of the Cu-poor Cu–In–Se compounds. In the range 0.82 < Cu/In < 1, the Cu-poor α phase assumes a chalcopyrite structure characterized by V Cu. This is because only the coordination number of the Se–Cu in the local structure of the Se atom decreased with decreasing Cu/In ratio, while the other structural parameters resembled those in the CuInSe2, Cu0.9InSe1.95, and Cu0.82InSe1.91 samples. For the case of the β phase compounds, CuIn3Se5 and CuIn5Se8, we compared the results obtained by an XAFS analysis with three postulated models. We conclude that a stannite-like structure with some cation (Cu and In) defects as shown in Fig. 13(c) can explain the XAFS results; in particular, the coordination numbers of all atoms have an influence. Since the model in Fig. 13(c) has the space group I4(−)2m structure, this model does not contradict the structure determined from an electron diffraction analysis. Moreover, the structure of CuIn5Se8 can be estimated using the model shown in Fig. 13(c) and the analytical results of CuIn5Se8 obtained by XAFS. We conclude that the β phase structure of CuIn3Se5 and CuIn5Se8 is a stannite-like structure with some cation (Cu and In) defects as shown in Fig. 13(c).
ACKNOWLEDGMENTS
We thank Mr. Junya Kubo, Masaki Fukada, and Ms. Erika Tokumoto for their help in the XAFS measurement. We also thank Dr. Paul Fons of National Institute for Advanced Industrial Science & Technology for his critical reading of the manuscript. This work was in part supported by the Incorporated Administrative Agency New Energy and Industrial Technology Development Organization under the Ministry of Economy, Trade and Industry. This work was also supported in part by a grant from the High-Tech Research Center Program for private universities from the Japan Ministry of Education, Culture, Sports, Science and Technology.