Introduction
The correct interpretation of past patterns of biodiversity is fundamental to our understanding of how life responds to environmental change and provides a valuable context for the current biodiversity crisis (Urban Reference Urban2015; Blowes et al. Reference Blowes, Supp, Antão, Bates, Bruelheide, Chase, Moyes, Magurran, McGill and Myers-Smith2019). Biodiversity can be subdivided broadly into three main partitions: alpha, beta, and gamma diversity (Whittaker Reference Whittaker1960). Alpha is diversity at the finest scale—the point sample—and gamma is diversity at the largest scale of observation (Patzkowsky and Holland Reference Patzkowsky and Holland2012). Beta diversity represents spatial variation of species among sites at the scale of observation, and in a sense it links alpha and gamma diversities (Anderson et al. Reference Anderson, Crist, Chase, Vellend, Inouye, Freestone, Sanders, Cornell, Comita and Davies2011). The spatial scale of observation is contextual, and gamma diversity may reflect diversity at relatively small to global scales. Alpha and gamma diversity are, in theory, directly measurable in ecology, that is, through exhaustive investigation, whereas beta diversity reflects a derived quantity. Beta diversity is a fundamental partition of biodiversity and is central to many macroecological phenomena (Lennon et al. Reference Lennon, Koleff, GreenwooD and Gaston2001). It has been shown to be a significant contributor to gamma diversity in ecological (Lennon et al. Reference Lennon, Koleff, GreenwooD and Gaston2001; McKnight et al. Reference McKnight, White, McDonald, Lamoreux, Sechrest, Ridgely and Stuart2007; Veech and Crist Reference Veech and Crist2007) and paleoecological studies (Holland Reference Holland2010; Na and Kiessling Reference Na and Kiessling2015) and an important factor in understanding the drivers of biodiversity (Aberhan and Kiessling Reference Aberhan, Kiessling and Talent2012; Patzkowsky and Holland Reference Patzkowsky and Holland2012; Hofmann et al. Reference Hofmann, Tietje and Aberhan2019). Previous studies within the fossil record have highlighted that there is a need for analyses at finer spatial and geographic scales (Aberhan and Kiessling Reference Aberhan, Kiessling and Talent2012; Patzkowsky and Holland Reference Patzkowsky and Holland2012), particularly at the regional scale, which has been identified as a biogeographically important scale for understanding macroevolutionary patterns (Vermeij and Leighton Reference Vermeij and Leighton2003). Studies of beta diversity at the regional scale are relatively limited, and even scarcer are studies on the spatial dependence of beta diversity (Barton et al. Reference Barton, Cunningham, Manning, Gibb, Lindenmayer and Didham2013). This is particularly important in the fossil record, where temporal variation in spatial distribution of fossil localities is a known and pervasive bias (Vilhena and Smith Reference Vilhena and Smith2013; Close et al. Reference Close, Benson, Upchurch and Butler2017, Reference Close, Benson, Saupe, Clapham and Butler2020a,Reference Close, Benson, Alroy, Carrano, Cleary, Dunne, Mannion, Uhen and Butlerb).
Previous studies of beta diversity in the fossil record at large spatiotemporal scales have allowed for spatial variability in sampling by combining collections based on either a grid system (Crampton et al. Reference Crampton, Foote, Cooper, Beu and Peters2011; Brocklehurst et al. Reference Brocklehurst, Day and Fröbisch2018; Penny and Kröger Reference Penny and Kröger2019) or a specified distance (He et al. Reference He, Kreft, Lin, Xu and Jiang2018). However, these approaches do not necessarily account for temporal variation in spatial distribution or area, and time series of beta diversity may be affected by this. Broadly speaking, beta diversity is commonly measured by the direct relationship between alpha and gamma components, true beta diversity sensu stricto (see Tuomisto Reference Tuomisto2010a,Reference Tuomistob), or by measuring compositional dissimilarity between point samples (Anderson et al. Reference Anderson, Crist, Chase, Vellend, Inouye, Freestone, Sanders, Cornell, Comita and Davies2011). Conceptually and in ecological terms, assuming a fixed grain size (the spatial scale of individual units of observation) and variable extent (the spatial scale encompassing all units of observation), we would expect beta diversity, measured from the direct relationship of alpha and gamma, to increase with increasing area (Barton et al. Reference Barton, Cunningham, Manning, Gibb, Lindenmayer and Didham2013). The rate of increase is expected to decline from local to regional scales as fewer new species are encountered and one approaches total regional (gamma) diversity, in the manner shown by the triphasic species–area relationship (Rosenzweig Reference Rosenzweig1995). Intuitively, this would be applicable to the fossil record, as we anticipate the same relationship (Sclafani and Holland Reference Sclafani and Holland2013). The relationship between spatial scale and compositional dissimilarity is, however, more complex and dependent on taxa and grain and extent size (Barton et al. Reference Barton, Cunningham, Manning, Gibb, Lindenmayer and Didham2013) and is still debated in current ecological research (Barton et al. Reference Barton, Cunningham, Manning, Gibb, Lindenmayer and Didham2013; Antão et al. Reference Antão, McGill, Magurran, Soares and Dornelas2019).
Quantifying spatial scales in the fossil record is further complicated by uneven sampling and uncertainties in paleogeographic configuration. Thus, spatial distribution of the sampled fossil record may be a result of uneven sampling—patchy preservation of the rock record and sampling of that record, for instance—or true changes in the spatial structuring of environments, such as increase, decrease, or changing location of continental shelf area or landmass. To complicate matters, the confounding effects of sampling and the quality of the fossil record may have been simultaneously affected by latent common-cause factors (Smith Reference Smith2001; Crampton et al. Reference Crampton, Foote, Cooper, Beu and Peters2011; Peters and Heim Reference Peters and Heim2011). Understanding the spatial variation in beta diversity provides a unique perspective on this problem.
To our knowledge, no studies have previously focused on or corrected for spatial scaling of beta diversity in the fossil record. However, recent studies on the species–area effect in the fossil record have shown that there is a conspicuous difference in measures of global richness once standardization to spatial regions of equal size is used (Close et al. Reference Close, Benson, Upchurch and Butler2017, Reference Close, Benson, Saupe, Clapham and Butler2020a,b). These studies employ spatial standardization based on the summed minimum spanning tree (MST) length, defined as the shortest possible total distance of segments that connect a set of fossil localities (Close et al. Reference Close, Benson, Upchurch and Butler2017). Here we focus primarily on testing the spatial dependence of different measures of beta diversity at the regional scale and species level using the exemplary, well-studied, and relatively complete fossil record of Cenozoic mollusks from New Zealand (Crampton et al. Reference Crampton, Foote, Beu, Cooper, Matcham, Jones, Maxwell and Marshall2006a,Reference Crampton, Foote, Beu, Maxwell, Cooper, Matcham, Marshall and Jonesb, Reference Crampton, Foote, Cooper, Beu and Peters2011). In addition, we provide a spatially standardized time series of beta diversity using the same data.
Material and Methods
Material
This study focuses on New Zealand's rich record of Cenozoic marine mollusks (bivalves, gastropods, and scaphopods), using occurrence data derived from the Fossil Record Electronic Database (FRED). FRED is a collection-based compilation of fossil occurrences within New Zealand, and it is well described elsewhere (Clowes et al. Reference Clowes, Crampton, Bland, Collins, Prebble, Raine, Strogen and Marianna2020). Data relating to Cenozoic Mollusca were downloaded from FRED in September 2018 and subsequently revised with a newly updated version of the synonymy list (employed by Crampton et al. Reference Crampton, Foote, Beu, Maxwell, Cooper, Matcham, Marshall and Jones2006b, Reference Crampton, Foote, Cooper, Beu and Peters2011; Womack et al. Reference Womack, Crampton and Hannah2020), modified to take account of relevant recent literature (Beu et al. Reference Beu, Alloway, Pillans, Naish and Westgate2004; Beu Reference Beu2006, Reference Beu2011, Reference Beu2012; Beu and Raine Reference Beu and Raine2009). Analyses within this study are reported at the species level, excluding subspecies. Ambiguous identifications were removed from the dataset (including removal of taxa with the prefixes “cf.” and “aff.”). An additional cleaning protocol was employed to remove fossil occurrences recorded outside their known biostratigraphic ranges as documented in the synoptic dataset (Beu and Maxwell Reference Beu and Maxwell1990; Crampton et al. Reference Crampton, Beu, Cooper, Jones, Marshall and Maxwell2003, Reference Crampton, Foote, Beu, Cooper, Matcham, Jones, Maxwell and Marshall2006a; Cooper et al. Reference Cooper, Maxwell, Crampton, Beu, Jones and Marshall2006; Beu and Raine Reference Beu and Raine2009). The synoptic dataset is separate from FRED and comprises expert interpretations of the biostratigraphic ranges of mollusk species; it is taxonomically highly vetted, having been synthesized from the known fossil record by just two paleontologists (A. G. Beu and P. A. Maxwell) over many years. In contrast, the FRED dataset, although also vetted here, may still contain spurious or erroneous identifications that could bias measures of beta diversity based on dissimilarity.
We restrict our analysis to level-bottom shelf-dwelling taxa to allow for the disproportionately low representation of non-shelfal taxa and environments in the New Zealand Cenozoic stratigraphic record (Beu and Maxwell Reference Beu and Maxwell1990). Shelfal taxa are defined here as those inferred to have been confined to, or to have ranged into, shelf water depths (< ~200 m water depth) (Crampton et al. Reference Crampton, Foote, Beu, Maxwell, Cooper, Matcham, Marshall and Jones2006b). We exclude data from the Chatham Islands due to their large distance from New Zealand's mainland for most of the Cenozoic (> ~700 km). Geological ages are given in terms of New Zealand Cenozoic Stages (Fig. 1), and time bins used within this study are based on individual and combined stages, yielding 13 time bins (Fig. 1, Supplementary Table 1) with average duration of 3.5 Myr. Our analyses are restricted to occurrences from collections restricted in age to a single time bin. The final dataset analyzed here comprises 26,873 occurrences of 1713 species from 4173 collections.
New Zealand Cenozoic timescale (after Raine et al. Reference Raine, Beu, Boyes, Campbell, Cooper, Crampton, Crundwell, Hollis, Morgans and Mortimer2015), with units in Ma. Most analyses are undertaken at the resolution of the highlighted time bins shown here (shaded and unshaded blocks in the right-hand column); a few analyses for the past 5 Myr are undertaken at the resolution of individual New Zealand Plio-Pleistocene stages.

Paleocoordinates
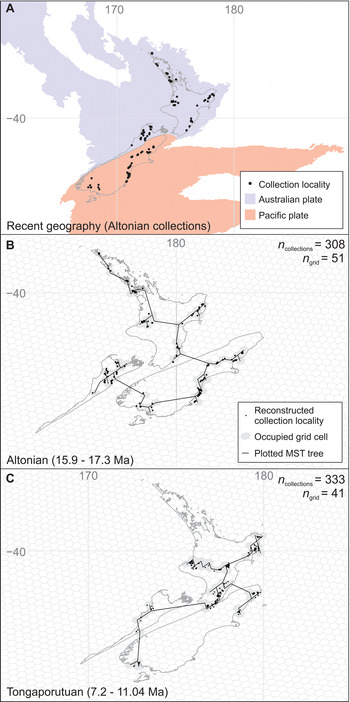
To derive measures of beta diversity that reflect true spatial and temporal variation in biodiversity, we calculated paleocoordinates for individual collections based on their modern latitudes and longitudes. This is particularly important for New Zealand, as it straddles the obliquely convergent boundary between the Pacific and Australian plates, with reconstructions suggesting up to ~800 km of relative plate motion since ~43 Ma and 80°–90° clockwise rotation on the still-active subduction zone on the east coast of New Zealand's North Island since ~20 Ma (Lamb Reference Lamb2011). Paleocoordinates were reconstructed using the software GPlates (Müller et al. Reference Müller, Cannon, Qin, Watson, Gurnis, Williams, Pfaffelmoser, Seton, Russell and Zahirovic2018). Reconstructions were based on a rigid-block model of New Zealand using relative finite rotations, continental polygons, and coastlines (Matthews et al. Reference Matthews, Maloney, Zahirovic, Williams, Seton and Mueller2016) placed in the global paleomagnetic reference frame (Torsvik et al. Reference Torsvik, Van der Voo, Preeden, Mac Niocaill, Steinberger, Doubrovine, Van Hinsbergen, Domeier, Gaina and Tohver2012). The use of a paleomagnetic reference frame for New Zealand has been shown to place strong constraints on both the tectonic evolution of the plate-boundary zone and the dynamical controls of crustal evolution (Lamb Reference Lamb2011). See Figure 2 for examples of modern-day and reconstructed paleocoordinates for the Altonian Stage (18.7–15.9 Ma), and paleocoordinates for the Tongaporutuan Stage (11.04–7.2 Ma); Supplementary Figure 1 shows reconstructed paleocoordinates for all time bins.
Recent and example paleogeographic maps of New Zealand showing fossil collection localities. A, Recent geography of New Zealand showing the position of continental fragments lying on the Australian and Pacific plates and Altonian (Pl) (18.7–15.9 Ma) fossil collection localities. B, C, Reconstructed paleocoordinates with the rotated fragments of the modern New Zealand coastline outline for reference and Altonian (Pl) (18.7–15.9 Ma) (B) and Tongaporutuan (Tt) (11.04–7.2 Ma) (C) fossil collection localities. Maps (B, C) show the equal-area penta-hexagonal grid with occupied grid cells shaded and minimum spanning tree (MST). The example MSTs are based on the central coordinates of all occupied grid cells.

Measuring Spatial Variation
Quantifying spatial variation in beta diversity requires some measure of distance, area, or geographic dispersion. This poses a problem, as different methods emphasize different aspects of the distribution of fossil localities (Close et al. Reference Close, Benson, Upchurch and Butler2017). Principally, we are concerned with variation in area. Previous studies have focused on measuring spatial variation using the area of the convex-hull, great-circle distances, summed MST length (Alroy Reference Alroy2010; Close et al. Reference Close, Benson, Upchurch and Butler2017, Reference Close, Benson, Saupe, Clapham and Butler2020a,b), or a grid-based system (Crampton et al. Reference Crampton, Foote, Cooper, Beu and Peters2011; Penny and Kröger Reference Penny and Kröger2019). Our data represent shelfal fossil communities; ideally, estimates of spatial area should represent shelfal area. Estimating shelfal area for New Zealand is difficult, as there are no spatially or temporally well-resolved, palinspastic paleogeographic maps for New Zealand. Based on the assumption that paleocoordinates for New Zealand shelfal fossil collections approximately fringe the paleocoastline, particularly at larger spatial scales, the area of the convex hull would be biased substantially by the area formerly occupied by land. In addition, the convex hull has been shown to be highly sensitive to sampling size and to consistently overestimate species geographic ranges (Burgman and Fox Reference Burgman and Fox2003). We therefore adopt a grid system as a proxy for spatial area, based on an equal-area penta-hexagonal grid generated using the R (R Development Core Team 2020) package icosa (Kocsis Reference Kocsis2020). Studies of beta diversity in the fossil record at the global scale have opted for a grid of side 111 km (Penny and Kröger Reference Penny and Kröger2019). We adopt a smaller grid of side 23 km, because our data are at the regional scale. The grid system provides a measure of area occupied by collections, but does not capture any information regarding the geographic dispersion of the data—10 grid cells could be contiguous or widely dispersed across a continent. Therefore, we also consider the summed MST length as a measure of paleogeographic dispersion, calculated using the R functions of Close et al. (Reference Close, Benson, Upchurch and Butler2017). Our calculations of summed MST length are based on the central coordinates of the individual grid cells, reducing biases related to clustering of collections in well-sampled areas. Whereas summed MST length may still be partially biased by landmass, it has been shown to correlate well with grid-cell occupation in the fossil record, can approximate complex distribution shapes (e.g., surrounding a landmass), and provides a good compromise in summarizing the spatial distribution of fossil localities based on their coordinates (Alroy Reference Alroy2010; Close et al. Reference Close, Benson, Upchurch and Butler2017).
Measuring Beta Diversity
Measuring beta diversity is a controversial topic, and there exist a plethora of metrics (Koleff et al. Reference Koleff, Gaston and Lennon2003) with no overall consensus on which metrics should be used for addressing particular ecological questions (Anderson et al. Reference Anderson, Crist, Chase, Vellend, Inouye, Freestone, Sanders, Cornell, Comita and Davies2011) or what actually constitutes true beta diversity (Tuomisto Reference Tuomisto2010a,Reference Tuomistob; Anderson et al. Reference Anderson, Crist, Chase, Vellend, Inouye, Freestone, Sanders, Cornell, Comita and Davies2011). Conceptually, the spatial relationship between alpha and gamma diversity is well documented in ecology (Rosenzweig Reference Rosenzweig1995; MacArthur and Wilson Reference MacArthur and Wilson2001; Scheiner Reference Scheiner2003; Drakare et al. Reference Drakare, Lennon and Hillebrand2006) and paleontology (Sepkoski Reference Sepkoski1976; Barnosky et al. Reference Barnosky, Carrasco and Davis2005; Sclafani and Holland Reference Sclafani and Holland2013; Close et al. Reference Close, Benson, Upchurch and Butler2017). Conversely, the spatial dependence of beta diversity is relatively unknown (Barton et al. Reference Barton, Cunningham, Manning, Gibb, Lindenmayer and Didham2013). The problem is compounded when applying beta diversity to the fossil record due to confounding effects of uneven preservation and sampling of the rock and fossil records through time. A full review of beta diversity is out of the scope of this paper, and we follow Anderson et al. (Reference Anderson, Crist, Chase, Vellend, Inouye, Freestone, Sanders, Cornell, Comita and Davies2011) in their broader definition of beta diversity, discussed in the following paragraph.
Beta diversity can be separated into two types, turnover and variation (Vellend Reference Vellend2001; Anderson et al. Reference Anderson, Crist, Chase, Vellend, Inouye, Freestone, Sanders, Cornell, Comita and Davies2011). “Turnover” measures the change in community composition and structure from one sampling unit to another, spatially, temporally, or over an environmental gradient; whereas “variation” is measured among all possible pairs of units, without reference to any particular gradient or direction (Anderson et al. Reference Anderson, Crist, Chase, Vellend, Inouye, Freestone, Sanders, Cornell, Comita and Davies2011). Turnover is often measured as similarity, but is also commonly expressed as dissimilarity (simply 1-similarity or by rearranging the formula; see Koleff et al. Reference Koleff, Gaston and Lennon2003). In addition, turnover can be subdivided into species replacement (commonly termed “spatial turnover”) and nestedness of assemblages (species loss) (Baselga Reference Baselga2010). For example, take two sites of varying species richness. The first site has a higher species richness and the second site is compositionally a subset of the first site's species. The variation in species composition between the two sites is due to differences in species richness, not species replacement, and forms the core concept of nestedness (Ulrich and Almeida-Neto Reference Ulrich and Almeida-Neto2012). Subdividing turnover into species replacement and nestedness components can help reveal underlying drivers of assemblage difference that may be obscured when they are combined (Wright et al. Reference Wright, Patterson, Mikkelson, Cutler and Atmar1997; Penny and Kröger Reference Penny and Kröger2019). We are interested in both the overall variation in beta diversity and the turnover across all shelfal gradients, and therefore both concepts are useful and applicable.
Fossil collection data contained in FRED are generally binary (presence–absence) and are treated as incidence data, and therefore we only discuss methods relevant to this data type. On this basis, we consider three main classes of measures of beta diversity for incidence data and their spatial scaling (see Supplementary Table 2).
1. Classical metrics, which are derived directly from the relationship between alpha and gamma diversity and are more suited to measuring overall variation. We adopt the original multiplicative (βWhit) (Whittaker Reference Whittaker1960) and additive (βAdd) (Lande Reference Lande1996) definitions of beta diversity as measures. Both additive and multiplicative measures of beta diversity have been shown to be effective in the fossil record (Holland Reference Holland2010; Aberhan and Kiessling Reference Aberhan, Kiessling and Talent2012).
2. Pairwise measures, which are based on similarity indices between a pair of sites or an average of all pairs, and quantify turnover (Anderson et al. Reference Anderson, Crist, Chase, Vellend, Inouye, Freestone, Sanders, Cornell, Comita and Davies2011). We adopt pairwise measures of the Sørensen (βSor) and Simpson (βSim) dissimilarity as expressed by Koleff et al. (Reference Koleff, Gaston and Lennon2003).
3. Multiple-site measures, which are derived from multiple-site equivalents of the matching components used in certain pairwise measures and also quantify turnover (Anderson et al. Reference Anderson, Crist, Chase, Vellend, Inouye, Freestone, Sanders, Cornell, Comita and Davies2011). We adopt multisite implementations of the Sørensen (βMSor) and Simpson (βMSim) pairwise dissimilarity measures (Baselga Reference Baselga2010; Baselga and Leprieur Reference Baselga and Leprieur2015).
Sørensen dissimilarity measures compositional differences arising from species replacement and species loss, whereas Simpson dissimilarity measures only species replacement. The nested component of turnover can be calculated simply by subtracting the Simpson dissimilarity measure from the Sørensen dissimilarity measure (βNest for pairwise and βMNest for multisite) (Baselga Reference Baselga2010). Pairwise measures are calculated in R using the package vegan (Oksanen et al. Reference Oksanen, Blanchet, Friendly, Kindt, Legendre, McGlinn, Minchin, O’Hara, Simpson, Solymos, Stevens, Szoecs and Wagner2007) and multisite measures using betapart (Baselga and Orme Reference Baselga and Orme2012). To accommodate for local variation in preservation and sampling of collections and facilitate calculation of area and distribution, we assign collections in each time bin to their corresponding grid cell based on their paleocoordinates. Collections in each grid cell are aggregated and reduced to binary incidence data and treated as a single sample; this protocol reduces the impact of local clustering of data around richly sampled localities.
We run our analyses with all available collections and a resampling procedure to reduce the impact of uneven numbers of collections per time bin. This resampling procedure is based on 40 collections resampled 1000 times, without replacement. The number of collections per trial is based on the minimum number of collections in the most poorly sampled time bin (40 collections in the Whaingaroan Stage [Lwh]: 34.6–27.3 Ma) (see Fig. 3 for a diagram that explains the workflow). No spatial constraints are applied to the resampling procedure, allowing for spatial standardization to be calculated afterward at any chosen level. For each trial, we assign the collections to their grid cells, as described earlier, forming the sampling units. We select one of these grid cells as the focal sample and calculate the geodesic distance to all other sites, and then repeat the process, treating each occupied grid cell as the focal sample in turn. During each iteration, we calculate measures of beta diversity and measures of spatial variation incrementally, moving outward from the focal sample, adding one sample at a time until the most distant of the 40 samples is included. This allows beta diversity to be calculated in reference to a spatial gradient, rather than randomly, thereby avoiding measuring beta diversity for samples where geographic distance and calculated spatial area are essentially decoupled. For each increment, alpha diversity is calculated as the average raw species richness per sample, and gamma diversity as the raw species richness for all samples. Coverage-based subsampling is not applied to alpha and gamma diversity, because we have standardized the number of collections to 40, but could be implemented if spatially standardizing to a fixed spatial scale. Data are reported as the mean and standard error of successful trials out of 1000, based on either number of grid cells or binned summed MST lengths. Successful trials are defined as those that reach the predetermined threshold of grid cells or binned summed MST lengths. Unsuccessful trials occur because larger spatial scales will not be encountered in every resampling trial. Following the resampling procedure, spatial standardization can be achieved by taking the average measures of beta diversity for successful trials within a singular time bin at a fixed number of cells or range of summed MST lengths.
Flowchart highlighting the methodical resampling protocol to produce measures of beta diversity for each time bin at increasing spatial scales. For this study n coll is set at 40. Dashed arrow lines indicate the loop relating to what is in the text referred to as a single trial. *Mean and standard errors are based on the number of successful trials for the spatial scale of interest, that is, larger spatial scales will not be encountered in every resampling trial.

From these calculations we generate spatially and sampling standardized beta-diversity time series. We estimate measures of beta diversity at a fixed number of cells (13) and summed MST range (1000–1100 km). The level of spatial standardization is based on the minimum number of grid cells and minimum summed MST observed across all time bins after standardizing to 40 collections. For comparison, we also calculate unstandardized measures of beta diversity based on all collections and combined collections based on the penta-hexagonal grid system.
Results
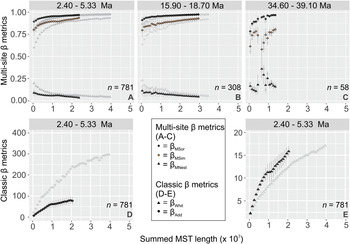
Measures of variation (βAdd and βWhit) generally conform to the a priori expectation that beta diversity increases with increasing spatial scale and that this rate of increase declines at regional spatial scales (Fig. 4, Supplementary Figs. 2, 3). This relationship is also seen in both pairwise (see Supplementary Fig. 4) and multisite measures of average Sørensen dissimilarity (Fig. 4A–C, Supplementary Figs. 5, 6). There is a large disparity between the sampling standardized measures of βWhit and βAdd beta diversity and their counterparts based on all available data, highlighting the importance of sampling and spatial standardization for these metrics (Fig. 4D,E). Overall, we find that the multisite measures of beta diversity (βMSor, βMSim and βMNest) are more stable across spatial scales and are less affected by sample size in comparison to other measures of beta diversity (Supplementary Figs. 2–6). Our results and interpretations are therefore based primarily on the multisite measures of beta-diversity turnover and their derived components. Henceforth, we use the following labels for the different data treatments: “collection-based” for unstandardized data taken at face value; “grid-based” for unstandardized data with collections aggregated by grid cells; and “standardized” for the sampling and spatially standardized data, where spatial standardization is achieved using either a fixed quota of cells or a fixed summed MST distance.
Measures of beta diversity plotted against summed minimum spanning tree (MST) length, for a representative selection of time bins. Unstandardized results are shown in gray, based on all collections (aggregated by grid cells). Error bars are presented for sampling standardized results only and are based on the standard error of successful trials (maximum 1000) aggregated by summed MST length bins used to calculate average beta diversity (where summed MST was aggregated into 100 km bins). See Fig. 3 for detailed method of resampling protocol. A–C, Multisite measures of beta diversity (βMSor, βMSim, and βMNest) for three time bins: A, Mangapanian–Opoitian (Wm-Wo) (5.33–2.4 Ma); B, Altonian (Pl) (18.7–15.9 Ma); and C, Runangan–Kaiatan (Ar-Ak) (39.1–34.6 Ma). Graphs (A, B) highlight time bins with well-ordered data, contrasting with C, where βMSim and βMSor do not conform to a simple logarithmic trend. This is likely a result, at least in part, of geographic clustering of grid cells within this time bin into two confined groups (see Supplementary Fig. 1). D, E, Classic measures of beta diversity: additive (βAdd) (D) and multiplicative (βWhit) (E) plotted against summed MST length for Mangapanian–Opoitian (Wm-Wo) (5.33–2.4 Ma). The number of collections per time bin is denoted by n.

We find that standardized measures of βMSor and βMSim are slightly elevated at smaller spatial scales, and βMNest is slightly smaller compared with grid-based measurements (Fig. 4). This disparity is more pronounced when measuring spatial scales using grid-cell occupancy (cf. Supplementary Figs. 5, 6). Regardless of whether standardization is implemented, both βMSor and βMSim increase with spatial scale, and βMNest decreases (Fig. 4), with the exception of the combined Runangan and Kaiatan (Ak-Ar) time bin (39.1–34.6 Ma), which shows a variable pattern of βMSim and βMNest. Collections in this time bin are split into two distinct geographic clusters (see Supplementary Fig. 1), which are likely to affect the derived spatial measures and components of turnover. The general pattern of decrease in βMNest with increased spatial scale suggests that nestedness is decreasingly important from local to regional spatial scales, and at the regional scale, species replacement (βMSim) is the primary component of compositional dissimilarity.
We experiment with several regression trendlines (linear, power, logarithmic, and general additive model) to interpolate a spatially standardized measure of multi-site beta diversity. A logarithmic trendline shows the best fit for summed MST length and grid-cell occupancy versus average values of βMSor and, to a lesser extent βMSim and βMNest (see Supplementary Figs. 5, 6), based on both fit to the data and visual assessment of the plausibility of the extrapolation. However, this relationship diminishes in older time bins, and given the close match between the logarithmic fits and measured average values of beta diversity in younger time bins at our chosen standardization quotas, we avoid this additional computational step and use the measured values of beta diversity to derive our time series of Cenozoic beta diversity. Likewise, we avoid extrapolation using logarithmic regression, because in some cases, the trendlines yield values of βMSor greater than 1.0, particularly for time bins with low spatial measures and when using grid-cell occupancy as the spatial unit (see Supplementary Fig. 6).
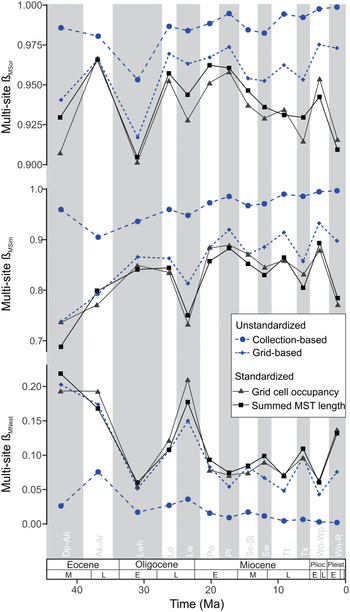
Standardized measures of βMSor, βMSim, and βMNest show substantially greater proportional volatility through the Cenozoic than unstandardized collection-based and grid-based measures (Fig. 5, Supplementary Fig. 7). Collection-based measures suggest beta diversity (βMSor) increases steadily through the Cenozoic, with a similar steady increase in species replacement (βMSim) and decrease in nestedness (βMNest). Conversely, standardized measures suggest a declining trend in beta diversity (βMSor) in the early Miocene and a large increase in βMNest in the Waitakian (Lw) (25.2–21.7 Ma), coinciding with a large decrease in βMSor and βMSim. When spatial and sampling standardization is employed for ungrouped Plio-Pleistocene stages (see Fig. 1), the same downward trend is observed (Fig. 6, Supplementary Fig. 8). Grid-based measures produce results that are more similar to standardized measures than collection-based measures, although there are still notable differences in amplitude in peaks and overall trend. Similar disparities are observed between unstandardized and standardized time series of beta-diversity variation (βAdd and βWhit) (Supplementary Fig. 9).
Cenozoic time series of multisite beta diversity (βMSor, βMSim, and βMNest). We present two unstandardized measures: collection-based and grid-based (collections aggregated by grid cell) (dashed lines); and two spatially and sampling standardized time series using grid-cell occupancy and summed minimum spanning tree (MST) length (solid lines). Analyses are undertaken at the resolution of the highlighted time bins shown here (see abbreviated stage labels and Fig. 1 for reference), and points are plotted at time-bin midpoints (see Fig. 1, Supplementary Table 1). For clarity, standard error bars are omitted; see Supplementary Fig. 7 for plots with error bars.

Plio-Pleistocene time series of multisite beta diversity (βMSor, βMSim, and βMNest). We present two unstandardized measures: collection-based and grid-based (collections aggregated by grid cell) (dashed lines); and two spatially and sampling standardized time using grid-cell occupancy and summed minimum spanning tree (MST) length (solid lines). Analyses are undertaken at the resolution of the Plio-Pleistocene New Zealand Stages shown here (see abbreviated stage labels and Fig. 1 for reference), and points are plotted at time-bin midpoints (see Fig. 1, Supplementary Table 1). For clarity, standard error bars are omitted; see Supplementary Fig. 8 for plots with error bars.

To assess the effect of spatial standardization, we calculate the correlation between time series of multisite beta-diversity turnover and total per–time bin measurements of summed MST length and grid-cell occupancy. Correlations are calculated for three levels of standardization: (1) unstandardized based on raw collections; (2) unstandardized based on collections aggregated by grid cell; and (3) sampling and spatially standardized. We employ Spearman's rank-order correlation coefficient (r s) based on first differences (denoted by the symbol Δ). We find that correlation coefficients are strong and significant for βMSor and moderately strong and significant for βMSim (marginal in the case of grid-cell occupancy) when unstandardized based on collections for both summed MST length and grid-cell occupancy (Table 1). Effect size decreases when collections are aggregated by grid cell, but are still moderately strong and significant for βMSor and moderate for βMSim versus for grid-cell occupancy. When sampling and spatial standardization are employed, effect size is negligible for summed MST length, but still slightly elevated for grid-cell occupancy. This suggests that both methods are suitable for spatial standardization and summed MST length may be more effective.
Correlations between multisite beta diversity versus summed minimum spanning tree (MST) length and grid-cell occupancy. Three standardization methods are considered: (1) unstandardized, based on fossil collection localities and (2) aggregated by grid cell; and (3) sampling and spatially standardized. Correlations are based on first differences denoted by Δ.

It is also possible that beta diversity is dependent, in part, on time-bin duration. Collections in long time bins may be more separated in time compared with those in short time bins, and this might bias measures of dissimilarity. To test this, we calculate the correlation between time series of standardized measures of multisite beta-diversity turnover and time-bin duration, using Spearman's rank-order correlation coefficient based on first differences. We find that all values are nonsignificant and correlation coefficients for βMNest are low and moderate to moderately low for βMSor and βMNest, respectively (Table 2). Whereas correlation coefficients for βMSor and βMNest are slightly elevated, they are nonsignificant and, importantly, show the opposite trend that would be anticipated if time-bin duration biased beta. Therefore, the elevated correlation coefficients are likely a result of spurious correlation. This suggests volatility in beta diversity is not strongly influenced by time-bin duration.
Correlations between standardized multisite beta-diversity and time-bin duration. Correlations are based on first differences denoted by Δ.

Discussion and Summary
All measures of beta diversity (with the exception of βMNest) increase with spatial scale and show declining rates of increase at regional spatial scales. For the New Zealand Cenozoic mollusk data, multisite measures of turnover and their components (βMSor, βMSim, and βMNest) show an approximately logarithmic relationship with summed MST length and grid-cell occupancy, particularly in younger time bins (27.3–0 Ma) (Supplementary Figs. 5, 6). The relationship between spatial scale and beta diversity measured as compositional turnover is complex and dependent on a number of factors, including taxa and grain and extent size, and the metric itself. It is possible that the logarithmic relationship observed may, in part, be related to the species–area relationship, where the decreasing number of new species encountered at increasingly larger spatial scales may limit compositional dissimilarity.
Time series derived by standardizing on summed MST length and grid-cell occupancy reveal similar patterns, but summed MST length is considered to be the superior approach, because it captures the geographic dispersal of the data. For example, in the Altonian (Pl) (17.3–15.9 Ma), collection locations are spread relatively evenly in paleogeographic coordinates, whereas Tongaporutuan (Tt) (11.04–7.2 Ma) collections are clumped predominately in the north (Fig. 2). Both time bins have similar numbers of collections, and the Altonian (Pl) has 19% more occupied grid cells relative to the Tongaporutuan (Tt) (Fig. 2). Based on the average summed MST length and grid-cell occupancy for 40 collections (for all 1000 trials), grid-cell occupancy increases by 17% from the Tongaporutuan (Tt) to the Altonian (Pl), whereas mean summed MST length increases by 28%, a value that captures the observable increase in geographic dispersal. These relative differences in measures of geographic extent explain, in part at least, the differences we see in time series based on the two methods, in particular using βWhit (Supplementary Fig. 9). Studies at larger spatial scales or with less evenly spaced data should consider this potential bias for spatial standardization.
Partitioning turnover (βMSor) into nestedness (βMNest) and species replacement (βMSim) facilitates a greater understanding of patterns in beta diversity. Species replacement (βMSim) is the dominant component of compositional dissimilarity and increases with spatial scale, whereas nestedness (βMNest) decreases. These patterns are logical consequences, in part at least, of environmental and ecological factors that operate at different spatial scales. Hence, as spatial scale increases, climate and environmental contrasts related to latitude will also increase and dispersal limitation of species will become more significant, both factors that are likely to increase species replacement and decrease nestedness.
Patterns of beta diversity should be considered in relation to other standardized components of diversity (alpha and gamma) and measures of environmental heterogeneity (e.g., see Crampton et al. Reference Crampton, Foote, Cooper, Beu and Peters2011), and detailed interrogation of these New Zealand Cenozoic mollusk data will be the subject of a separate paper. Importantly, for the New Zealand Cenozoic mollusk data, time series of beta diversity that employ spatial and sampling standardization reveal different temporal trends and much greater proportional volatility than those based on unstandardized measurements, displaying contrasting results to previous estimates (Crampton et al. Reference Crampton, Foote, Beu, Maxwell, Cooper, Matcham, Marshall and Jones2006b, Reference Crampton, Foote, Cooper, Beu and Peters2011). These standardizations are neglected in many studies of beta diversity, but clearly may have a significant impact on paleobiological interpretations, as illustrated in the following two examples from our data.
Standardized βMSor shows a decline from ~20 Ma, whereas unstandardized measures (particularly collection-based) display an increase (Fig. 5). Given that this period spans the development of the modern plate boundary through New Zealand and also global cooling, one could draw very different conclusions about one or both these factors in driving patterns of beta diversity in standardized versus unstandardized measurements.
Standardized βMSor and βMSim both display a prominent downward excursion in the Waitakian Stage (Lw) (25.2–21.7 Ma) that is not observed in unstandardized measures (Fig. 5). The Oligocene marks the maximum flooding of the Zealandia continent, peaking in the late Oligocene (Waitakian) (Fleming Reference Fleming and Kuschel1975; Cooper and Cooper Reference Cooper and Cooper1995; King et al. Reference King, Naish, Brown, Field and Erdbrooke1999; King Reference King2000). The relationships between sea level, environmental heterogeneity, and beta diversity are of significant interest, and interpretations based on unstandardized measures are likely to be misleading.
We show that beta diversity is spatially dependent at local to regional spatial scales in the Cenozoic shallow-marine molluscan fossil record of New Zealand and that uneven spatial sampling can influence recovered temporal trends in beta diversity. Our results suggest that multisite beta-diversity turnover and components (βMSor, βMSim, and βMNest), standardized spatially using summed MST length, are the most suitable for elucidating patterns of beta diversity in the fossil record.
Acknowledgments
We thank R. A. Close, an anonymous reviewer, and the editor W. Keissling, for their constructive reviews and comments, both of which have helped improve and clarify this article. This work is funded by Victoria University of Wellington through the Commonwealth Scholarship. We acknowledge use of the data in the New Zealand Fossil Record File, administered by the Geological Society of New Zealand and GNS Sciences (http://www.fred.org.nz). H. Seebeck (GNS Science) assisted with the generation of paleocoordinates, and we acknowledge discussions with A. G. Beu (GNS Science) and K. S. Collins (Natural History Museum, London).