1 INTRODUCTION
The União Electrica Portuguesa (UEP) supplied the city of Porto in north Portugal with electricity between 1923 and the 2nd World War. This half-foreign company used the energy from Lindoso, a waterfall near the Spanish border that belonged to Electra de Lima, in the industrialised region of Porto, which includes Braga, Vila-Nova de Gaia and Coimbra. The municipality of Porto had been responsible for the retail service in the city since 1919 when this service was put under municipal ownership and managed by an agency, the Serviços Municipalisados de Gás e Electricidade de Porto (SMGE). The concession to the UEP was granted by consecutive open tenders and its conditions included rates of purchase and quantities of electricity. After 1926, the Portuguese government played an active role in controlling the progress of the electricity sector. However, the regulation of the Portuguese electrical markets was left mainly to local authorities until the early 1940sFootnote 1.
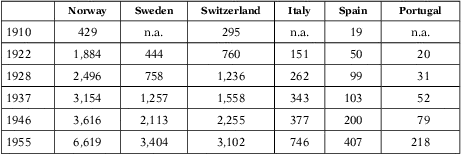
Porto followed an institutional path that was widespread in Europe during the first decades of the 20th century. The distribution service became a municipal responsibility and, at some point, the city agency started to be supplied by a private company while the government did not regulate electricity markets. This pattern of utility regulation followed the French model: municipal concession contracts with a particular administrative court to supervise renegotiations (Gómez Ibáñez Reference Gómez Ibañez2003, p. 34). Porto also followed a common pattern of electrification. The city started to be supplied with hydroelectricity and followed a path of electricity substitutionFootnote 2. Hydroelectricity was linked to commercial electricity, which gradually replaced coal as an energy input in residential uses, transport and manufacture. As can be seen in Table 1, electrification in the European water-powered peripheries proved rapid and intensive. The abundance of water resources in northern countries prompted a sustained electrification based on the comparative advantage of inexpensive electricity, encouraging a wide range of intensive uses of hydroelectricityFootnote 3. In the south, that is, Italy and Spain, water abundance represented a clear relative advantage for these countries, which were poorly endowed with coal. In the early years of the 20th century, the coincidence of relative water abundance and high levels of both income and industrialisation favoured initial substitutability in some regions of Italy, Spain and France. This was basically stimulated by the divergence in the relative prices of coal and hydroelectricity, which went hand in hand with the augmentation of electricity consumption in both residential and manufacturing sectors. Electricity markets subsequently expanded rapidly during the interwar period as economies of scale and network externalities favoured sustained increases in energy consumption in this southern periphery (Segreto Reference Segreto1993)Footnote 4.
ELECTRICITY OUTPUT PER HEAD, 1910-1955 (kWh)
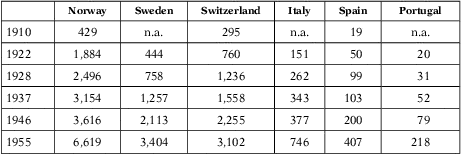
Sources: Etemad and Luciani (Reference Etemad and Luciani1991); http://www.ggdc.net/MADDISON/oriindex.htm.
However, hydroelectricity did not make a great difference in Portugal or in Porto itself. The consumption of electricity per capita in Porto was half the Spanish average during the interwar period whilst the retail prices of electricity relative to coal did not fall as sharply in Porto as they did in Spain until 1938 (Matos Reference Matos2003a, pp. 197, 217)Footnote 5. Actually, the growth of the electricity market in Porto proceeded slowly, as it did in Portugal in general.
The early urban services markets in Porto are reasonably well documented thanks to Matos (Reference Matos2003b) and Matos and Silva (Reference Matos2004). The evolution of the energy supply, the use of energy sources and the flourishing electrical and gas firms are all clearly depicted. Similarly, the early initiatives and the absorption by the municipal authority are well explained, as are the consecutive contracts between the municipality and the companies. Still, it is difficult to obtain a clear idea of what happened between the first contract signed by SMGE and the UEP in 1922 and that of 1938, namely when the town enjoyed the use of hydroelectricity under public rule but previous delays in the electrification process had not been overcome.
This article analyses the origin of the persistently high level of electricity prices, which hampered the expansion of electricity consumption during the interwar period in Porto. The coincidence of unpredictable energy policies at state level and the rent-seeking behaviour of both the supply firm and the City Hall at the local level affected the expansion of the electricity market. A comparative perspective, with a look at the situation in neighbouring areas, that is the Spanish markets, allows us to gauge and illustrate the significance of this phenomenon.
2 «O PROBLEMA ELECTRICO PORTUGUÊS»
The lines of Electra de Lima reached the Porto area in 1922. The high tension (HT) lines of a foreign-owned company transported hydroelectricity to an industrialised region where self-generated energy had previously been prominent. The Porto district was an important centre of manufacturing industry (cotton-textile, pottery and glass factories) where tiny workshops existed alongside huge plants. In 1922, more than 1,000 small electric engines (less than 7.46 kW of capacity) were still in use, while five factories had more than 746 kW at their disposal (Matos Reference Matos2003a, pp. 206-207). In 1928, when the subsidiary thermal station of Freixo was inaugurated in order to support the load peaks of the UEP's system, twenty-eight factories were yet to be linked to the commercial network. Instead, they were still supplied with energy by self-generation equipment, steam and gas converters, with a total capacity ∼3,500 kW (20 per cent of the UEP's total hydroelectric capacity)Footnote 6.
Barcelona, Genoa and Valencia were all urban areas of the southern periphery, centres of industrialised regions where self-powered equipment was prominent before the arrival of hydroelectricity. Since then, electrification expanded rapidly, because hydroelectricity accelerated the substitution process of coal into commercial electricity (Doria and Hertner Reference Doria and Hertner2004, pp. 217-248). However, although some hydroelectricity was available, this was not the case in Porto. For instance, Valencia and Porto had similar populations in 1935 and the manufacturing sector was prominent in both areas. However, the total consumption of electricity per head in Valencia was 241 kWh while in the city of Porto the figure was still only 56 kWhFootnote 7. According to Madureira (Reference Madureira2007, p. 601), electrification proceeded slowly throughout Portugal until the implementation of Salazar's projects in 1944, due to the country's low level of urbanisation and the high percentage of the active population employed in agriculture.
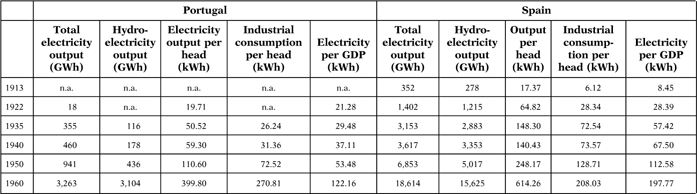
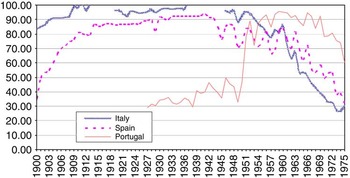
In Spain, the process of electrification expanded earlier and more vigorously than in Portugal. Total electricity output per head and industrial consumption per head diverged clearly and persistently until 1935, although both countries were pursuing not so different patterns of energy use before the 2nd World War, as the evolution of electricity consumption by GDP unit shows (see Table 2). In Portugal, the process of electrification catching up did not start until the 1950s when Salazar's electricity expansion project was introduced. This electrification plan was under the total control of state bodies and included, in the first place, a complete plan to build supply facilities. The state project required the exploitation of water resources but this was to be performed by joint-venture firms, with the contribution of both the private sector and public agencies. Second, the plan included the encouragement of intensive consumers of energy like the electro-chemical and electro-metallurgy sectors. As Figure 1 shows, the electrification take-off was dependent on hydroelectricity in these three countries of the southern periphery, but the timing of the Portuguese rise was delayed until the 1950s. Here, imported coal retained its position as the most important source of electric energy for a long time, while in 1901 water had already become the main primary supply of electric energy in Spain, and in Italy it accounted for more than 80 per cent of the total electricity output.
ELECTRICITY OUTPUT AND INDUSTRIAL CONSUMPTION IN PORTUGAL AND SPAIN
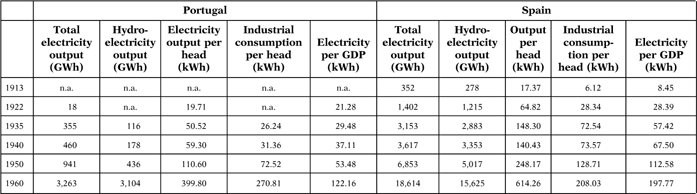
Sources: Madureira and Teives (Reference Madureira and Teives2005), Madureira (Reference Madureira2008, p. Reference Crew and Kleindorfer17), Bastien (Reference Bastien2001); http://www.ggdc.net/MADDISON/oriindex.htm; Bartolomé (Reference Bartolomé2007) and Nicoláu (Reference Nicoláu2005).
HYDROELECTRIC OUTPUT AS A PERCENTAGE OF TOTAL ELECTRICITY OUTPUT IN ITALY, PORTUGAL AND SPAIN
Sources: Giannetti (Reference Giannetti1985), Etedman and Luciani (Reference Etemad and Luciani1991), Madureira and Teives (Reference Madureira and Teives2005) and Bartolomé (Reference Bartolomé2007).

The so-called «problema electrico português», that is the clear delay in the electrification of the urban centres in Portugal during the interwar period was an ongoing concern for politicians and technicians. Two of the most important contemporary engineers, Ezequiel de Campos and José do Nascimento Ferreira Dias, were involved in the discussion and they were main players in the institutional arena, from municipal to state bodiesFootnote 8. Campos was of the opinion that the low level of per capita income would have accounted for the poor level of Portuguese electrification up to the 1950sFootnote 9. In his macroeconomic view, energy independence based on the replacement of coal would contribute to improve the availability of the domestic supply of capital. Campos regarded municipalities and private firms as essential actors in the development of hydropower. In contrast, Ferreira Dias emphasised the responsibility of the companies for the lack of capital investment. He believed that electricity should form part of a project of industrial policy, based on demand side stimulus. The promotion of new manufacturing activities by state organisms, namely intensive manufactures, would accelerate the rationalisation of both generating and transmission cycles of the electricity sector (Madureira Reference Madureira2008, pp. 15-17). Finally, Salazar's plan was put together under the personal direction of Ferreira Dias and dominated by his ideas, but until its implementation the issue remained under discussion.
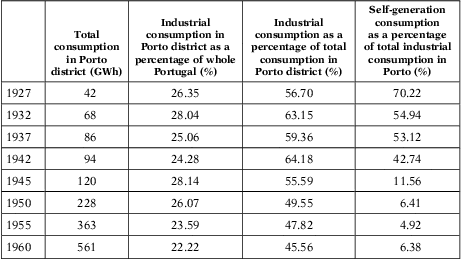
Porto was an important urban and manufacturing district in 1922, where electricity consumption per capita for motive power (24 kWh) was similar to the Spanish average (28 kWh). However, in 1935, the consumption of electricity per capita for industrial purposes had only doubled in Porto whilst it had multiplied threefold in Spain (Direcção Geral 1935; Bartolomé Reference Bartolomé2007, Anexo 1). As can be seen in Table 3, total electricity consumption in the district only accelerated in the early 1930s and during the 2nd World War. During the whole period, the Porto district absorbed an important share of Portugal's total industrial consumption of electricity. However, although commercial electricity advanced in the late 1920s, the percentage of self-powered consumption remained high and steady until 1944 when it rapidly decreased. The number of self-powered plants continued to grow until 1938 and in 1945 there were still 4,708 kW of self-generating equipment in use (Matos Reference Matos2004, pp. 212-213). In the city of Porto in 1933, a decade after the arrival of hydroelectricity, the UEP acknowledged that the substitution process was still in progress and almost 40 per cent of the total annual consumption of electricity was powered by self-generation in the urban centreFootnote 10. The town was served by the municipal agency, whose figures show that the total consumption of commercial electricity per inhabitant grew as slowly as the use per customerFootnote 11.
ELECTRICITY CONSUMPTION IN THE DISTRICT OF PORTO
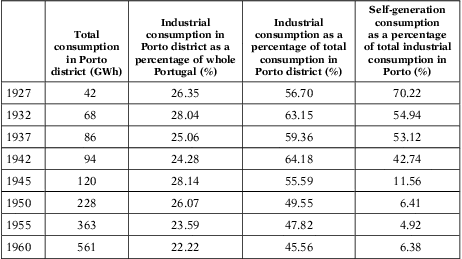
Source: Direcção Geral dos Serviços Eléctricos (1928-1960).
The electrification level is usually correlated to three main factors in the water-powered peripheries: per capita income levels (although differences remained according to the diverse patterns of industrialisation), abundance of water resources and public regulation of electricity markets, namely municipal and state control of both market access and utility ratesFootnote 12.
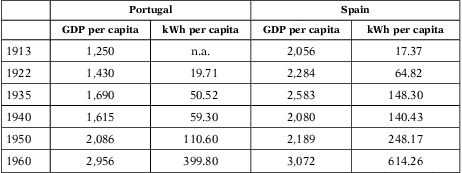
As can be seen in Table 4, the evolution of total consumption of electricity per head after 1922 in both Spain and Portugal was quite independent of the evolution of income levels. The use of electricity per output unit was much more intense in Spain although it was quite similar for both countries in 1922 (see Table 2). This has been correlated to divergence in energy paths in the long term. However, when organic sources of energy are included in the historical statistics for total energy, the role played by the diversity of energy paths tends to minimise (Madureira and Teives Reference Madureira and Teives2005).
PER CAPITA INCOME AND ELECTRICITY OUTPUT PER CAPITA, IN PORTUGAL AND SPAIN
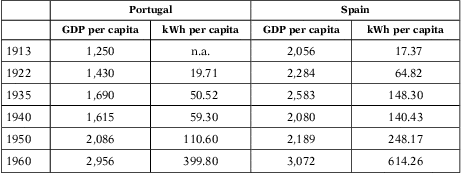
Sources: Same as Table 2.
The hypothesis of the role played by energy deposit abundance in both industrialisation and electrification transitions has a long tradition (Wrigley Reference Wrigley1988; Bardini Reference Bardini1997; Sudrià and Bartolomé Reference Sudrià and Bartolomé2010). Portugal's coal deposits were extremely poor and thus most of the coal in use was imported. The international accounts of hydropower potential in Europe carried out by international agencies as of 1950 have demonstrated its relative abundance in Portugal. The economical use of hydrological potential for obtaining electricity in Portugal per km2 (32 MWh) was similar to that of Italy (36 MWh) and greater than that of Spain (21 MWh) and France (26 MWh; UN 1953). However, these international accounts diverge from those of contemporaries in the 1930s because the technology linked to dam building was still in progress. Actually, the exploitation of hydroelectricity was very costly in Portugal, essentially because there were few waterfalls (like Lindoso) with constant flowing water that were inexpensive to use. Most water locations required an exploitation of hydroelectricity by means of dams and reservoirs. Therefore, coal was relatively cheap, that is, in operational utilities in use in Portugal, there was almost no advantage to using water rather than coal as the primary resource for obtaining electricity in the early 1930sFootnote 13.
Actually, energy prices played their role in early electrifications and proved relevant in Spain where the marked change in the price of hydroelectricity in relation to coal in manufacturing areas accelerated the substitution of energies and the adoption of commercial electricityFootnote 14. Similarly, high electricity prices are linked to low levels of consumption in South America during the 1920s (Tafunell Reference Tafunell2010). In the 1930s in Portugal, commercial electricity for manufacturing was regarded as expensive by foreign technicians, who linked the persistent use of self-generating equipment in the manufacturing industry to the slow shift from steam to hydroelectricityFootnote 15.
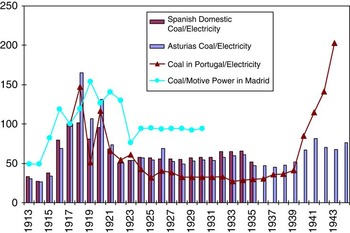
Betrán (Reference Betrán2005, p. 78) has pointed out that the higher the price of hydroelectricity in relation to coal, the less intensive the electrification process during the interwar period. The evolution of relative prices of coal to hydroelectricity in Portugal was not as favourable as it was in Spain during the 1920s. As can be seen in Figure 2, the relative price of coal to electricity changed in both countries during the 1st World War when the price of coal rose due to supply difficulties. Once the war had ended, the relative price of coal to electricity remained high in Spain — when comparing foreign coal it is even higher — while in Portugal it returned to the prewar level. Compared with the data of a city like Madrid, which experienced rapid electrification, the divergence with the evolution in Porto is noteworthy. In contrast, during the 2nd World War, the change in the evolution of the price of coal relative to electricity was more prominent in Portugal and this accompanied the beginning of the electrification processFootnote 16.
THE EVOLUTION OF THE RELATIVE PRICE OF COAL TO ELECTRICITY IN SPAIN AND PORTO (Index of ratios of nominal prices, 1917 = 100).
Sources: Henriques (Reference Henriques2011), Coll and Sudrià (Reference Coll and Sudrià1987, pp. 421-423), Carreras (2005, p. 434), Aubanell (Reference Aubanell2001, p. 609) and Câmara Municipal de Porto (1918-1945).

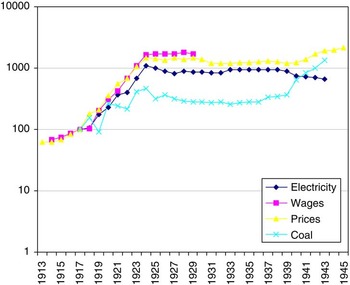
Hence, relative prices were against the shift from steam to electricity in Portugal. As can be seen in Figure 3, electricity prices followed the same path of growth and stagnation as general consumption prices during this period in Portugal, with wages also following the same path. Thus, electrification could not be encouraged by the substitution of work for capital as it was in Madrid (Aubanell Reference Aubanell2001). Furthermore, coal prices did not rise as much as general prices and electricity prices did not experience a similar drop to that of Spain. The change in Portugal was only observed as of 1939.
THE EVOLUTION OF ELECTRICITY PRICES IN PORTO, WAGES, CONSUMPTION PRICES AND COAL PRICES IN PORTUGAL 1913-1945 (Index of nominal prices in a logarithmic scale, 1917 = 100).
Sources: Câmara Municipal de Porto (1918-1945); Bastien (Reference Bastien2001) and Henriques (Reference Henriques2011).

Why did the trend of relative energy prices diverge in Portugal, and more specifically in Porto? As of 1923, the city was served with inexpensive hydroelectricity from Lindoso, a small but adequate waterfall for supplying its developing local market. Natural constraints, then, cannot be said to explain the small impact of hydroelectricity. There may have been institutional origins behind the high level of electricity prices in this city during the 1920s: firms may have avoided competition and the municipality may have played its role in increasing rather than lowering these prices. During the 1930s, persistently high electricity prices may be explained by the Ferreira Dias argument. He posited that capital investments were interrupted when increasing scale economies of generating hydroelectricity and network externalities would have been essential in order to reduce electricity prices throughout the country (Brandão de Brito Reference Brandão de Brito1998, p. 286). His argument fits well with Hausman and Neufeld's findings (Reference Hausman and Neufeld2004). According to them, as electricity networks were extended and transmission lines went well outside city limits, the need for capital investment in the electrical industry grew in tandem with hydroelectric equipment and transmission lines. Economies of scale of durable assets were transferred from the distribution cycle (within a town) to generation and transmission networks (able to serve an entire region)Footnote 17. In north Portugal, this process was interrupted when local markets were not interconnected until the 1940s, but not only by the rapacity of the electricity companies, as Ferreira Dias suggested, but also by the reinforcement of the firms’ defensive policies that both institutions, initially the municipality of Porto and afterwards the Portuguese state accomplished. This stopped supply companies and municipal retailers providing venture capital when it became crucial to increase scale economies and positive network externalities.
3 ELECTRICITY MARKETS AND REGULATORY POLICIES DURING THE INTERWAR PERIOD
Traditional public interest theory has focused on local markets, where electricity provides outstanding examples of natural monopolies during the interwar periodFootnote 18. The case of the city of Chicago has usually illustrated the importance of early regulation of electricity markets in paving the way for electrification. According to this theory, where electricity markets were regulated, both the retail prices of electricity and monopolistic rents were lowered and electrification expanded rapidlyFootnote 19. New Institutional Economics theory has also drawn attention to local markets. Electricity supply industries stood out for the specificity of their long duration and costly assets and they were never organised as competitive markets due to high transaction costs. Electricity companies found it impossible to move or resell their capital, increasing the risk of investing in this industry. According to this view, cities granted companies the rights they needed to build utilities and set up networks using politically administered solutions such as contracts and municipal franchises, as opposed to market-administered solutions. In return, companies agreed to charge limited rates (via a system of price ceilings) and to provide electricity of a specified quality. Additionally, the firms sometimes agreed to pay the city a percentage of their earnings. These were channelled into the municipal accounts and contributed to reducing local taxes (Spiller and Tommasi Reference Spiller and Tommasi2005)Footnote 20. Actually, municipal ownership of utilities was linked to the essential need to raise municipal incomes in emergent manufacturing towns (Millward Reference Millward2004, p. 12).
Disagreement arises when the origin of state regulation is analysed. On the one hand, both Public Interest Theory and rent-seeking approaches emphasised the importance of the appropriation of monopoly rents. The former defended regulation as a way to contend market power; the latter posited that regulatory bodies often acted as agents for producers since entry restriction was likely to generate monopoly rentsFootnote 21. On the other hand, New Institutional Economics has highlighted the importance of the appropriation of quasi-rents, that is, the difference between the value of fixed capital and its value in the best alternative use. In local markets, corruption, involving municipal officers and utility companies, may arise when utilities had to secure municipal franchises. As Troesken (Reference Troesken1996) demonstrated for Chicago's gas industry, the rapacity of the City Hall imposed such low rates for the gas company that the return of sunk costs was impossible. State regulation of the gas industry in Chicago arose as an instrument to avoid municipal corruption and as an alternative to municipal ownership. In regional markets, since quasi-rents grew alongside generation and transmission, state regulation has been linked to the process of building regional markets and the establishment of transmission networksFootnote 22. Neufeld (Reference Neufeld2008, p. 1064) has recently emphasised that the timing of state regulation in the United States was linked to the need for utilities to obtain large investments in transmission. These specific assets created appropriable quasi-rents, which made it difficult for electricity companies to operate in competitive markets or under the contractual franchises that characterised early municipal regulation. In Neufeld's view (Reference Neufeld2008, p. 1066), rent-seeking behaviour on behalf of utility managers should be regarded as protection of quasi-rents, since the loss of quasi-rents would not result in an immediate shutdown, but both the replacement and the augmentation of capital investment would be inhibited. State regulation assured a stable setting in terms of legislation and increased the confidence of future investors in the return of sunk costs.
The case of the Porto electricity market followed a distinct path of regulatory policy. The municipality obtained the exclusive right to retail gas and electricity in 1919 and used the franchise bidding procedure to sign supply contracts with hydroelectric companies in the area by bargaining prices and quantities of energy. The municipality used a special agency, the SMGE, to retain the delivery of low tension services — lighting and manufacture — and established retail electricity prices. From the 1930s, the state gradually assumed network planning and, after 1944, it virtually commanded the progression of the total electricity power capacity and demand needs, although the ownership of the power-generating assets remained in the private sector (Madureira and Bussola Reference Madureira and Bussola2005, p. 63).
As the following pages attempt to demonstrate, this story of Porto's electricity market is in keeping with Neufeld, who combined different approaches in order to explain this transition. As of 1938, state intervention assured not only that electricity prices were lowered, but also the payback of the companies’ sunk costs for building a regional market and increasing the economies of scale of both generation and transmission.
4 THE GOVERNMENT AND THE ELECTRICITY SECTOR: THE HESITANT RULING POLICY
The electricity sector was mainly left under municipal control in Portugal until 1926. Concession agreements were an exclusively municipal prerogative with municipalities awarding contracts of energy distribution to private companies via franchise bidding procedures. Monopoly situations were not formally avoided and municipalities were free to establish rates for the purchase of electricity at local level. The granting of water permissions and the concessions of network tendering were the only prerogatives in state hands. This loose market regulation has usually been argued to be one of the origins of «the miniaturization of the sector» in Portugal, namely making it infeasible to achieve the necessary economies of scaleFootnote 23.
Thereafter, the Lei dos Aproveitamentos Hidráulicos and the Lei da Rede Nacional inaugurated a new phase of transition in state intervention in PortugalFootnote 24. The former reinforced the state's role in the granting of permissions for exploiting waterfalls; the latter was a call for the tendering of outline proposals to set up a national electricity grid and the respective transport lines. Although there were no major outcomes as a result of this legislation, hope for the implementation of a major electrification plan was encouraged in 1931 when Decree No. 20,225 declared the government's intentions to intervene in the electrification of PortugalFootnote 25. The new legislation essentially opened a tender after two solid proposals were received from two foreign electrical conglomerates, Iberian Electric Limited and the Westinghouse Electric International Company. When the tender was closed in January 1932, there were eleven proposals from manufacturing and electric-conglomerates all over the world. A group of Swiss companies won the tender although the government's lack of capital was mentioned as the origin of the project's suspensionFootnote 26. This episode made it clear to companies and municipalities that the forthcoming state intervention would be the main variable of future electrification.
During the 1930s, there was an additional proposal from Westinghouse, the Anglo-American group, with the support of Sofina in Lisbon on the River Zêzere. The UEP, in Cávado-Rabagão and the Douro, also attempted to invest in hydroelectricity in Portugal. However, Ferreira Dias rejected these foreign interventions as he did with the rest of the UEP's expansion projectsFootnote 27. As a result, the growth of the whole electricity system seemed to be threatened by the reluctance of the state bodies to entrust concessions of electrical infrastructures to foreign firms. In 1936, with the constitution of the National Electrification Board, a new era of state regulation was inaugurated. First, local concession contracts started to be controlled and regulated by this organism. Second, attempts were made to avoid local monopolies by the concession of contracts to several supply companies. Finally, electricity rates came under revision and the criterion of favouring larger consumers was implementedFootnote 28.
However, the great changes would come with the rise of coal prices during the 2nd World War. In the transmission cycle, the interconnection of the power stations of northern Portugal was ordered in June 1943 to save on foreign coal and maximise the use of the available hydroelectric powerFootnote 29. At the generating level, in 1944, the Lei 2,002 finally implemented Salazar's plans for the electricity sector. It was based on the collaboration between companies and the government in an electrification process ordered and planned by government organisms. The clauses were rigid but this meant the existence of a consistent project that transmitted confidence to potential investors. It consisted of the establishment of new companies, Hidroeléctrica do Cávado and Hidroeléctrica do Zêzere, to exploit large-capacity hydroelectric power stations on the Zêzere and Cávado-Rabagão rivers, following a joint-venture model, financed by public and private capital. In 1947, a new company, Companhia Nacional de Electricidade (CNE), was also founded. As Madureira (Reference Madureira2008, pp. 14-18) posited, the hard version of electrification, ruled by the state, succeeded in achieving its goals in a climate of supply shortage of energy caused by the world conflict.
5 THE ENERGY COMPANY: THE UEP, A SEMI-PORTUGUESE FIRM
As of 1905, the financial requirements of the electrical industry grew enormously. This process went hand in hand with the internationalisation of electricity companies. The scale of long-distance transmission lines, electrical utilities and the management of electrical systems multiplied, as did their financial needs. More specifically, hydro-electrical firms were capital-intensive and this entailed a continuous and huge flow of capital. Hydroelectric assets were fixed and could not be removed and used for other activities. Investing in hydroelectricity implied sunk costs and the investment did not yield short-term profits. In addition, the need for capital did not stop once the water-power systems were launched. The electrical firms were involved in an endless process of absorbing not only intensive consumers such as chemical industries, but also competitors, that is, smaller electricity companies, so as to build regional monopolies. The role played by the international electrical conglomerates included a sophisticated supply of human capital for building hydro-utilities and running electrical systems (Segreto Reference Segreto1992; Hertner and Nelles Reference Hertner and Nellles2007).
Foreign capital had reached electricity companies in Portugal by means of gas firms. Lisbon was under the rule of the Société Financière de Transports et d'Entreprises Industrielles (SOFINA). This was the Allgemeine Elektricitäts-Gesellschaft's (AEG)'s Belgian holding and it controlled some financing companies in the European periphery. In 1913, SOFINA had acquired a significant share of capital of the Lisbon company, Companhias Reunidas Gás e Electricidade (CRGE); founded in 1891, it was the main energy utility group in Portugal. Although CRGE had obtained an important part of the local delivery company in Porto in 1897, this service was brought under municipal ownership in 1919. Porto City Council bought their investment from the shareholders of the Companhia do Gás e Electricidade do Porto. This firm had held the electricity concession in the city since 1907 when the Sociedade de Energia Eléctrica assigned it to the Companhia and finally purchased the concession in 1912. The Ouro thermal utility had been managed by the Sociedade since 1895 and most of the equipment was out of order when the municipality started to manage the power facility in November 1917 (Matos Reference Matos2003a; Reference Matos2003b, pp. 88-94; Silva and Matos Reference Silva and Matos2004).
The UEP was formed in 1919 as a joint venture of Spanish and Portuguese entrepreneurs for the distribution of hydroelectricity obtained at Lindoso Footnote 30. This water-fall was the main asset of Electra de Lima, a Spanish company which represented the Portuguese branch of the Banco of Vizcaya's electricity holding group (Bartolomé Reference Bartolomé2009, p. 124). The Portuguese counterpart in the UEP was the Pinto e Sotto-Mayor bank (Câmara Reference J. de Sousa da1989). As part of the expansion strategy of the Spanish holding to the west, Electra de Lima planned to supply electricity to the Porto region and it obtained the concession for an HT electricity line from Lindoso to the city in 1921Footnote 31. The Vizcaya's electricity group was not used to organising exploitation in a vertically integrated structure. The corporate strategy developed in some Spanish markets segregated the cycles into two different companies, but the delivery company was controlled by the generating one (Anes Reference Anes2006). Hence, the UEP was set up to distribute energy to the Portuguese urban markets in the north using Iberian capital and entrepreneurship and its Portuguese registration was supposed to pave the way for acquiring licenses and authorizations when necessary. The UEP only served energy from Lima and, in turn, was responsible for thermal support and maintaining the voltage of the electrical system. The energy was to be paid for in golden currency and the retail prices would be fixed by agreement between the companies, Lima would support the UEP in the case of competitionFootnote 32.
The UEP was planned in order to underpin the company's growth over the next 20 years. The voltage was calculated to resist a fourfold increase in installed capacity, a sixfold augmentation in the electricity output and a twenty-eightfold increase in the transmission networksFootnote 33. From the beginning, the company followed an extensive pattern of growth through the implementation of a network of urban centres (point-to-point). The expected density of demand was weak, but this policy of extensive market coverage was also the usual procedure of the Vizcaya group in Spain. However, post 1932, the UEP had to readjust its goals when the government stopped granting tenders of new lines to the company. It had to strengthen secondary branches to supply smaller centres and customers. As can be seen in Figure 4, electricity output (including both hydroelectric and thermal production) grew at 11.57 per cent in the whole period (1923-1945), while lines increased at 13.11 per cent. Between 1924 and 1938, the differences were remarkable: lines expanded at a rate of 18.66 per cent while electricity increased at 15.14, thereby the evolution of the electricity output in the UEP's markets followed the expansion of HT lines, although the rhythm of the network's growth was faster than that of production before 1938.
UEP: ELECTRICITY EXPLOITATION (Electricity, in kWh, on the left; HT lines, in km, on the right).
Sources: Board of Directors Annual Reports. Lima (1924-1945) and UEP (1924-1945).

Initially, financing both the installation of HT transmission lines and the thermal support was a major issue for the UEP. First, it had to pay for the electrical lines connecting Lindoso with Braga and Porto that were installed by Lima Footnote 34. Second, Freixo, a thermal utility in Porto and the UEP's main asset, was planned in 1925 and inaugurated in 1928. Some transmission lines, such as Porto-Coimbra in 1928, were also set up. Later, in 1933, the UEP started buying a company in the Setubal Peninsula, the Sociedade de Electrificação Urbana e Rurale (SEUR) and this process finished in 1941.
Capital was also invested in attempting to expand the electricity market in north Portugal. On one hand, the UEP followed a strategy of acquiring water resources in order to increase the availability of energy when necessary, but the firm was overlooked when the most important waterfall concessions were granted by the governmentFootnote 35. Lindoso had been planned to supply the city of Porto with 60 GWh (the estimated demand), but, although part of its hydro-power capacity remained underused due to the unevenness of the hydroelectric exploitation, it was enlarged several times between 1922 and 1941 (Bartolomé Reference Bartolomé2009, p. 137). On the other hand, the UEP specifically sought to control the supply of the northern electricity markets by two means: the purchase of a portion of the capital stock of rival companies and market agreements.
From the beginning, in the early 1920s, the UEP had to deal with a segmented electricity market in the city of Porto. The municipal agency, the SMGE, had exclusive retailing rights for any customer under the capacity of 50 kW. The Companhia dos Carrís de Ferro do Porto (Carrís) was in charge of delivering energy to the tramway network in the city and had its own thermal utility, Massarelos. Hence, as early as 1920, the UEP attempted to become the majority shareholder of Carrís in order not only to control the city market, but also to exploit its thermal plant, before the thermal production of Freixo was planned. As this manoeuvre was strongly opposed, the Pinto e Sotto-Mayor bank had to sell their portion of the capital stockFootnote 36.
Contemporaneously, the UEP also attempted to expand in the rest of the electricity markets in the north of Portugal by signing contracts with the City Halls of Braga, Vila-Nova de Gaia, Porto and CoimbraFootnote 37. However, in the late 1920s the UEP did not receive further authorisation from the government to extend its transmission lines again in north Portugal and some competitors appeared. The Companhia Electrica de Varosa was founded in 1907, but its two small hydroelectric utilities on the rivers Lamego and Regua were only able to produce energy in 1925 (Chocalho) and in 1929 (Caniços; Matos Reference Matos2003a, pp. 108, 169). The UEP's exclusive control over the provision of hydroelectricity to the city of Porto was under serious threat and became a real difficulty when Varosa signed an agreement in 1927 with Espinho, a municipality in the outskirts of PortoFootnote 38. Similarly, the Companhia Electro-Hidráulica de Portugal (CEHP) was founded in 1918 and it obtained some concessions on the river Ave. Their utilities were Ermal (1932), Guilhofrei (1939) and Ponte Esperança (1943; Matos Reference Matos2003a, p. 120). The aggregate output of both companies did not reach half of the UEP's production, but Varosa and the CEHP ultimately merged and became the Companhia Hidroeléctrica do Norte de Portugal (CHENOP) and this improved its bargaining power with its main competitor, the UEPFootnote 39.
During the 1930s, the UEP followed a new policy of market agreements. The UEP and Varosa signed a 6-year contract for the distribution of electricity in the Porto region in 1931. In line with its power capacity, the important urban centres were assigned to the UEP, while Varosa was responsible for the supply of electricity to smaller towns and villages. The contract prevented any changes in the respective areasFootnote 40. Similarly, the UEP signed a mutual help agreement with Carrís in 1931, which was still valid in 1939Footnote 41.
In 1932, the UEP made a concerted effort to approach the Lisbon market and requested authorisation to study the construction of a HT line from Coimbra to Alcobaça, but the administrative process was promptly interrupted in SeptemberFootnote 42. The UEP was essentially interested in acquiring SEUR, the company in the Setubal Peninsula south of Lisbon and the HT line would have helped reduce the distance between the northern and southern markets. Although SEUR became part of the UEP in 1941, the project for a joint company network never materialisedFootnote 43.
Finally, during the 2nd World War, the UEP signed market agreements in the south with the Companhia do Alto Alentejo for the distribution of electricity in ÉvoraFootnote 44. In the north, new circumstances made the UEP and its competitors interconnect their grids. On one hand, the three companies, Varosa, the CEHP and the UEP, endorsed a new contract for the city of Porto in 1938. On the other, the shortage of fuel led to a compulsory integration of the networks in order to make the system in the north more efficientFootnote 45.
In spite of all the rivalry the UEP had to face, internal evidence reveals that the UEP's returns on investment (ROI) was particularly favourable, while that of Electra de Lima was significantly lower during the whole period and its evolution was uneven. Figure 5 compares the profitability of another Banco de Vizcaya electricity generation company, Hidroeléctrica Española (Hidrola), with its Portuguese counterpart, Lima, and with the evolution of the UEP. The evolution of Hidrola was steady and much better than that of Lima until 1935, but the UEP's situation improved greatly.
THE EVOLUTION OF ROI: ELECTRA DE LIMA, UEP AND HIDROLA, 1924-1944 (%)
Sources: UEP and Lima Board of Directors: Annual Reports (1924-1944). CD-EDP-Fundo UEP. Hidrola: Annual Reports (1924-1940): AHISA, Fondo Hidrola. Notes: ROI: Returns on Investment (Equities and Reserves). Hidrola: Returns on Equities.

The UEP may have achieved this profitable position in two scenarios: either as a consumer or as a provider of electricity. First, Lima might have contributed to the UEP's high ROI if the price paid to Lima for energy was low. This may well have happened in some years. According to internal sources, a low percentage of the UEP's unit income was used to pay for energy from 1926 until 1935. In terms of total unit costs, the percentage for reimbursing energy varied, but was rarely higher than 50 per centFootnote 46. The Spanish managers attempted to increase the Portuguese partner's confidence in the electricity business by means of augmenting the UEP's returns and Lima's financial costs did not begin to be paid back until 1930, when Lima's shareholders finally received some returns on equities (Bartolomé Reference Bartolomé2009, p. 147)Footnote 47.
However, the UEP's good performance could have had an additional component, that is, the average revenues in the exclusive Porto market. By 1938, the UEP was mostly dependent on the income obtained by the sale of electricity to the SMGE of Porto. Although the share of the UEP's total production acquired by the municipal agency declined progressively (as low as 20-25 per cent of the total output of the electricity firm), SMGE was the essential source of the company's income, accounting for 60 per cent of the UEP's revenues until 1939 (see Figure 6).
SHARE OF UEP'S PRODUCTION ACQUIRED BY SMGE AND UEP INCOME SHARE CORRESPONDING TO SMGE PAYMENTS (%)
Sources: UEP Board of Directors, Annual Reports (1923-1943) and Câmara Municipal de Porto (1918-1945).

To recapitulate, during the interwar period, the UEP clearly intended to build a regional electricity market in the north of Portugal, centred in the city of Porto. This was demonstrated by their attempts to capture energy resources, the absorption of adversaries and market agreements. Indeed, this corporate strategy was in line with that of the Vizcaya group as a whole in the Peninsula (Tedde and Aubanell Reference Tedde and Aubanell2006, p. 234). Ferreira Dias, a member of the Junta de Electrificação Nacional, stated that the UEP sought to avoid competition. In a letter to the minister of commerce and public works, he noted that the UEP was extremely interested in maintaining high prices in the open tender for Porto in 1938 in order to recover the cost of «propaganda, contracts and compensations» in its own budgetFootnote 48. In line with his view, internal evidence has demonstrated that the UEP remained a remunerative business during these years and the company was likely to obtain monopoly rents from its main market, the city of Porto, whilst there was no payback for Lima's investors for some years. However, this strategy did not actually help the UEP build an exclusive regional market in the northern area of Portugal in 1938. After 25 years of activity, a diminishing part in the Porto electricity market was under the control of the UEP while successive requests to expand the market — waterpower resources and HT lines — had been denied by the government.
6 THE SERVIÇOS MUNICIPALIÇADOS DE GÁS E ELECTRIDADE (SMGE) AND THE ELECTRICITY MARKET IN PORTO
The SMGE of Porto, dependent on the City Council, assumed the retail service of electricity in 1917. Although SMGE had a thermal utility, the Ouro power station, its machinery was in need of repair. The electricity service in the city was extremely poor: there was huge waste in the distribution system and over 1,000 requests to join the lighting service had been rejected in the previous years due to a lack of available electricity. The gas service was therefore overused despite permanently making a loss and, in 1920, the difficulties in the service persuaded SMGE to take out a considerable loan from Vicente Ribero at 4.5 per cent a year (Câmara 1918, pp. 4, 12; Sindicancia 1921, n. 7). Hence, the company's estimated deficit in 1921 was 2,678,000 escudos, while its assets were assessed at roughly 500,000 escudos (Campos Reference E. de1938, pp. 72, 98). When Ezequiel Campos was appointed manager of SMGE in March Reference E. de1922, the agency's position was weak, but the municipality was reluctant to pay a fee for the urban lighting serviceFootnote 49.
Campos kept the obsolescence of Ouro's machinery secret when he started negotiations with potential suppliers — coal companies, the river Cávado-Rabagão concessionaires and the UEP. Simultaneously, Ezequiel Campos attempted to construct a thermal utility on behalf of SMGE, but coal prices rose significantly and the Portuguese currency fluctuated randomly on the London market. SMGE's hopes of building its own thermal utility finally disappeared when the municipality was unable to obtain funds for the projectFootnote 50. There were still two possible suppliers: Carrís and the UEP. Meetings with Carrís started in May, but Carrís ended negotiations in October 1922 leaving the UEP as the only possible provider (Campos Reference E. de1922, p. 177; Reference E. de1938, p. 106).
Campos wrote a brochure in January 1923 fully explaining how the electricity rates to be paid by SMGE were estimated. Campos made an approximate calculation of the running costs of the company's two divisions: gas and electricity. He also assessed the capital costs of the enlargement of the service and the total costs of the urban consumption of gas and electricity. He then totalled the annual payment of the quota for the redemption of the loan and the whole accumulated deficit. His next step was to gauge the expected amount of electricity sold by SGME in 1923: 5 million kWh. This led to an estimation of the distribution of these capital costs to every kWh retailed: 0.50 escudos per kWh. Although electricity prices in Porto had been increased in August, he believed that 0.910 escudos was the maximum unit price per kWh. The maximum rate to be paid to the electricity supplier should therefore be 0.410 per kWh, or 0.015 escudos-ouro, in gold currency and this was SMGE's offer to the UEP (Campos Reference E. de1922, pp. 134-142; Reference E. de1938, p. 82). Electricity rates maximised the municipality's income while the expansion of electrification in Porto was far beyond the goals of this proposal.
The contract was finally signed on October 31, 1923 and it lasted for 3 years and 8 months until June 1927. The peak load was set at 5,500 kW at 5,000 V. SMGE was in charge of public lighting, commercial retailing of lighting and motive power up to 50 kW, whilst the UEP would serve manufacturing customers. SMGE kept its own thermal utility in use because the UEP's commitment was initially for 8 months a year. The rate paid per kWh delivered to Porto by the UEP was 0.0166 gold escudosFootnote 51. According to Campos, this was a temporary contract whilst waiting for any alteration in the Portuguese hydroelectric scenario (Campos Reference E. de1922, p. 154; Reference E. de1938, pp. 99, 103).
In June 1926, Ouro, the thermal utility, had to be closed down. This new setting impelled Campos to start negotiating a new contract. On one hand, Campos attempted to improve SMGE's position for bargaining with the supply companies. First, he tried to repair Ouro; second, Campos started planning the exploitation of a waterfall on Portugal's river Douro in Bitetos (Campos Reference E. de1938, pp. 110, 123). On the other hand, the companies knew that the scenario had not actually been modified after the last negotiation, although the government had simultaneously begun an era of legislation of hydroelectricity with consecutive decreesFootnote 52. The domestic producers of coal were not ready to fuel an important thermal utility in Porto with their own minerals and Varosa was likely to be too weak to compete with the UEP. Therefore, although Varosa was almost ready to produce electricity, it decided not to participate in the open tender in March 1927 (Campos Reference E. de1938, pp. 114, 117)Footnote 53. The UEP declared its target of extending the contract with SMGE for 10 years, but when the open tender was inaugurated in February 1927 and the conditions of the retailer were made public, the UEP agreed on a 6-year extension of the contract until June 1933Footnote 54.
Campos then attempted to get the Douro's hydroelectric project in Bitetos rapidly underway so that it would be ready at the end of the extension. The municipality applied to the government for this water permission, the financial plan was finished and, in December, the whole scheme was assessed by a committee of engineering experts from Motor-Columbus in SwitzerlandFootnote 55. However, the project required financial support from the state and Bitetos was finally blocked. Other companies showed interest in the Porto electricity market. Varosa and Carrís offered their services together with the San Pedro da Cova coalmines, when Cavado was said to be about to start the works. Varosa and the UEP reached a market agreement in June and, in September, the UEP also agreed terms with Carrís Footnote 56. Although a tender was opened for supplying Porto with electricity in August 1931, there were no applicants. As mentioned above, the government had initiated a second ruling period on electricity. Since the governmental plan had not yet been revealed, Porto's municipality had to negotiate the extension of the contract once again in June 1932Footnote 57.
Supplier rates were not changed in the new arrangement between the municipality and the UEP, although the municipality had had severe difficulties paying the bill in gold currency after the Stabilisation Decree in June 1931. The conflict continued for years until May 1935 when the UEP agreed to reduce the rates by one-third after Administration and Court arbitrationFootnote 58. This effective cut in the energy prices for the municipality paved the way for a new franchise tender in July 1936. The UEP was the only contender since their proposal included some electricity from Varosa and Carrís Footnote 59. The City Hall did not immediately accept the offer and reports were requested from two experts on the prices of alternative means of obtaining electricityFootnote 60. The aim of the reports was to help the municipality consider the UEP's HT rate proposal. Ferreira Dias considered it unacceptable because the prices were double those in the experts’ reports and suggested a new cut in the rates and also insisted on the need to decrease the final retail pricesFootnote 61.
The contemporaneous conflict for the payment in gold currency between Porto's municipality and the UEP did not cease. The authorities did not effectively pay the company for the energy and, consequently, the firm's capacity to renegotiate a new contract was damagedFootnote 62. Finally, in June 1938, Decree No. 28.665 ignored any formal guarantees and the contract was granted to a consortium of the UEP, Varosa and the Companhia Electro-Hidráulica de Portugal (CEHE)Footnote 63. As Matos put it, in the context of rising demand for energy during the 2nd World War, the scarcity of coal and the drop in the electricity price made it easy to expand the electricity market in the Porto region (Matos Reference Matos2003a, p. 217). The integration of the networks advanced during the war and the plan for a regional electricity market in north Portugal was raised for the first timeFootnote 64.
It may be said that, thanks to Ferreira Dias, the status quo in the electricity market in Porto was terminated in 1938. The new contract put an end to both excessively high retail and supplier rates and favoured rapid electrification by the expansion of the regional market. Some contemporaries pointed out that the lucrative position of the UEP was supported by Campos until 1938 when he left the board of SMGE. He was accused of being a major shareholder of UEP in 1931, although he denied it (Campos Reference E. de1938, p. 230).
SMGE figures essentially reveal what internal sources had anticipated: the agreement was particularly favourable to the interests of the agency. As can be seen in Figure 7, average prices of hydroelectricity sold by SMGE were increased from the level of the previous thermal service and maintained until 1938 when they started decreasingFootnote 65. This evolution cannot be explained by the variations in the share of use (HT/LT) because they both appeared to follow a similar trendFootnote 66. In real terms, this evolution is not so different: retail prices were even increasing between 1935 and 1939.
SMGE OF PORTO. RETAIL PRICES OF ELECTRICITY (kWh) (Nominal (left) and Real (right) Escudos).
Sources: Câmara Municipal de Porto (1922-1945). Bastien (Reference Bastien2001). Notes: 1928: first semester; 1934-1935: year and a half. After 1941, own consumption and other services are accounted for separately.

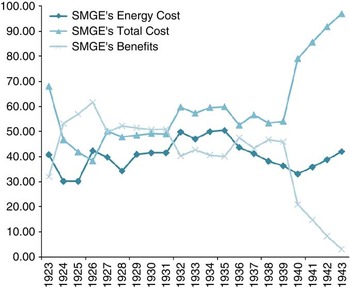
As can be seen in Figure 8, the evolution of energy costs (rates paid to the main supplier, the UEP) did not drive the level of electricity prices. Nor were they determined simply by the foreign currency scenario as some contemporaries suggested. Retail prices were essentially a by-product of an astonishing level of profits for purchased kWh for the SMGE in the electricity branchFootnote 67. The percentage of unit profit was higher than the energy unit cost for the majority of years up to 1938, while the latter had started to decline around 1933-1934. Electricity costs did not reach more than 40-50 per cent of the total unit price until 1940, although total costs were made up of the expenses of public illumination and all municipal electricity services until 1940Footnote 68.
SMGE OF PORTO: ELECTRICITY SERVICE. UNIT-COSTS AND UNIT-BENEFITS (% of average income of retailed kWh).
Source: Câmara Municipal de Porto (1922-1945).

The consequences of this rate policy affected not only the progress of electricity consumption but also its pattern of use in Porto. Porto's electricity market preserved the characteristics of a pre-World War I market. Between 1923 and 1943 (inclusive) there was a 6.82 per cent growth in the electricity sold by SMGE. However, this rate was lower than that of the previous phase, 12.94 from 1917 to 1922, and intensified to 10.41 per cent from 1923 to 1927 (Figure 9). This meant there was a substitution effect at the beginning, but then the electrification process stoppedFootnote 69. From 1928 to 1938, consumption grew at ∼4.15 per cent; however, the figures did not properly reflect the effect due to municipal consumption — a remarkable share of the total electricity employed was assigned to a different account after 1941. Thus, although electrical demand grew at ∼4.75 per cent from 1939 to 1945, the proportion of the electricity sold was significantly higher when the rates were cutFootnote 70.
THE EVOLUTION OF THE EXPLOITATION OF ELECTRICITY BY SMGE, PORTO (kWh)
Source: Câmara Municipal de Porto (1922-1945).

Thus, there were no significant changes in the allocation of electricity by the SMGE until the late 1930s. First, the delivery system in Porto remained essentially inefficient, because there continued to be high levels of waste (∼15 per cent) during the whole period, since returns were not invested in improving the distribution system. Second, urban lighting continued to represent an important part of total consumption and continued growing until 1940, when it accounted for 23 per cent of the total electricity distributed by SMGEFootnote 71. Finally, the total share of purchased electricity was no more than 65 per cent of total electricity available until the 1940s.
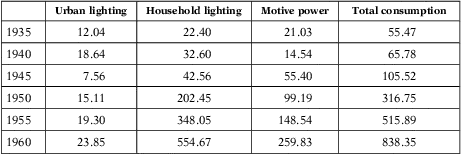
Similarly, electricity distribution was likely to have been stationary in terms of the tension of delivery, that is, SMGE did not succeed in increasing the consumption of HT in its area of distribution and there was a fixed group of HT consumersFootnote 72. In Porto, this consumption remained ∼65 per cent from 1927 to 1943Footnote 73. The annual hours of use of the installed capacity remained very low (totalised 673 annual hours of use in 1943), because there was a predominance of intermittent use. Furthermore, the proportion of small engines grew during the period: whereas the number of engines increased fivefold, capacity multiplied only fourfold. In the period 1934-1943, the consumption of electricity per head for motive power remained fixed, while household illumination gradually substituted public lighting as the most important use (see Table 5). Therefore, internal evidence reveals that 20 years after hydroelectricity had become available, Porto's electricity market remained largely unchanged.
ELECTRICITY ANNUAL CONSUMPTION PER INHABITANT IN THE CITY OF PORTO (kWh)
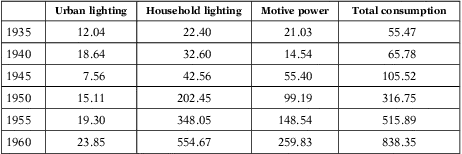
Source: Câmara Municipal de Porto (1935-1960). After 1941, municipal consumption and other services are accounted for separately.
To recap, an analysis of the evolution of SMGE's electricity exploitation reveals that the intense electrification of the Porto area was not the agency's priority. Firstly, electricity prices remained high until the outbreak of the 2nd World War because electricity consumption was regarded as an important source of funds for cancelling the agency's deficit and paying the expenses of urban lighting, but not for augmenting the efficiency of the delivery system. Secondly, the UEP was engaged in this market by the very nature of its assets. Its income was mostly dependent on the Porto market and it therefore adapted to these circumstances. The company had no opportunity to command a regional market, although the company's return on investment was preserved by maximising the income from the main customer: contracts were too short, density of use too low and distribution areas were too small. Third, both the municipality and the UEP colluded against electricity consumers. At municipal level, franchise procedures were under suspicion and rates were decided by circumstances other than the regulation of the market: the payment of the loan in 1923 and the eventual competition of coal in 1937. In the short run, inhabitants, officers and shareholders could benefit from this arrangement, but in the long run this remunerative equilibrium should have come to an end with the unavoidable enlargement of the electricity market.
As of 1938, the local drop in the electricity rates gave rise to the electrification of Porto. The symbiotic rapport between the UEP and the SMGE ended and the status quo was broken. On the one hand, the UEP needed the support of other companies to supply Porto with electricity as recent state legislation indicated; on the other hand, SMGE adopted a new and efficient price-cutting plan. These changes were fostered by the Junta de Electrificação, headed by Jose N. Ferreira Dias. The Junta can be said to have achieved its aim of expanding electricity markets in the north of Portugal despite the effective opposition of the UEP and perhaps SMGE.
This straight explanation might be inaccurate. The government had impeded both public and private initiatives aimed at increasing economies of scale in generation and transmission cycles. On the one hand, the UEP was not allowed to enlarge either the sources of power or the size of its market, particularly after 1931 when authorisation to extend the lines to the south was refused. On the other, the government had done away with the municipality's plans for the electrification of Porto. Moreover, from 1926 to the 1940s, government intervention raised expectations about its participation in this industry although it delayed initiatives from abroad. This uneven policy would have contributed to hamper faster and more intensive electrification. Once the prices were cut in 1938, the annual hours of use of the installed capacity gradually grew as the use of electricity was intensified and self-generation was substituted by commercial electricity. The expansion of regional markets in the 1940s matched the decreasing energy costs of hydroelectricity in the following decade.
7 FINAL REMARKS
Our findings have confirmed that electricity consumption in Porto was characterised by a slow rate of growth during the interwar period, as was the case in the rest of Portugal. The persistence of self-generation and the low level of per capita consumption show that energy substitution was still in progress by the outbreak of the 2nd World War. The level of per capita income and the poor endowment of natural resources in Portugal — that is, coal and waterfalls — partly explain this limited electrification. However, Porto was a manufacturing centre well served by inexpensive water power as of 1923 but still suffered from a slow electrification. Electricity prices were not likely to be adequate for a developing market and were mostly responsible for the stagnation of this electrification. Hydroelectricity made no difference and no salient change was observed in this electricity market during the interwar period.
The institutional setting was decisive in the implementation of electricity rates in Porto. Between 1922 and 1938, electricity prices were kept high because the supplier and the retailer of Porto, a municipal agency, achieved a symbiotic equilibrium in this small market, which benefited the aims of both in the short term. The electricity company was adequately remunerated, the agency's debt was reimbursed and the inhabitants of Porto enjoyed urban lighting without the reverse of an eventual increase in municipal taxes. However, the electrification suffered from a prominent backwardness, which affected consumers and essentially the manufacturing sector.
This collusion went hand in hand with the obstruction to the indispensable increase of scale — namely, generation and transmission — and the building of a regional market of electricity in north Portugal. First, the electricity company in charge of generation was likely to be underpaid for some years. Second, the government's hesitant policy reinforced the risk of any investment on behalf of either private companies or the municipality up to 1938. Third, the government refused successive projects of electrification on behalf of foreign companies during the period. Actually, capital was not channelled into the Portuguese electricity sector, the technology transfer was suspended and the electricity sector in north Portugal did not benefit from the advantages in both price and quality of regionally integrated electricity systems until the 1950s. Therefore, the institutional scenario should be added to the usually mentioned origins of the relative backwardness of the Portuguese electricity sector before the 2nd World War.
In the 1940s, with the change in relative prices of primary energies during the war and the unavoidable increase in the scale of electricity markets, electricity expanded beyond the city limits and electricity prices were therefore cut and Porto's electrification expanded as it had done during the 1920s in other manufacturing cities. Furthermore, the early electricity market of Porto may help us to illustrate how the transition of market regulation from municipal to state bodies during the 1940s took place. Changes in relative prices triggered institutional changes during the war and, thus, an important drop in electricity prices is observed. To a certain extent, both Campos and Ferreira Dias were right. The country was poor, but the companies were not likely to be interested in investing without assuring the payback in such an institutional scenario. However, none of them put an end to this situation before 1938.
SOURCES
Archivo Estafeta-INI, Madrid. Leg. 250, c. 6. Sirvent.
Archivo Histórico Iberdrola Salto Alcántara (AHISA), Alcántara (Cáceres). Fondo Lima, Fondo Hidrola.
Centro de Documentação de Electricidade de Portugal (CD-EDP), Belém (Lisboa): Fundo Ferreira Dias (FD) and Fundo UEP (UEP).