Implication
A modified rinsing method was developed that improves the accuracy of determining the soluble, washout and non-washout fraction in the in situ technique, potentially improving prediction of the nutritional value of feedstuff. Characteristics of the proteins in the particles normally lost from the nylon bags suggest a more rapid degradation than proteins in the D fraction, which is contrary to assumptions currently used in various protein evaluation systems.
Introduction
The in situ technique has been widely used to evaluate the rate and extent of degradation of feed components in the rumen (López, Reference López2005). The technique relies on the assumption that disappearance of substrate from synthetic porous bags incubated in the rumen represents actual substrate degradation by rumen micro-organisms (Ørskov and McDonald, Reference Ørskov and McDonald1979; López, Reference López2005). After ruminal incubation, a rinsing step is carried out to remove rumen contamination, such as microbial matter, from the bags. Rinsing of the bags also removes a fraction of the feed (i.e., washout or W fraction) containing both soluble components (i.e., soluble or S fraction) and small particles (i.e., insoluble washout or W–S fraction). The fractional degradation rate of components of the remaining fraction of the feed (i.e., non-washout or D + U fraction) can be determined by the in situ method. However, there are feed evaluation systems for dairy cows that use W or S and W–S in determining feed value and consequently require a fractional degradation rate for W or S and W–S. Therefore, most feed evaluation systems, such as the French PDI (Verité et al., Reference Verité, Journet and Jarrige1979), the Dutch DVE (van Duinkerken et al., Reference van Duinkerken, Blok, Bannink, Cone, Dijkstra, van Vuuren and Tamminga2011), the British FiM (Thomas, Reference Thomas2004), NRC (NRC, 2001) and the Nordic Norfor (Volden, Reference Volden2011), use various assumptions on the fractional degradation rate of the S and W–S fraction.
For several feed evaluation systems, rinsing of nylon bags by using a washing machine separates the feed in W and D + U fractions. Subsequently, for non-incubated nylon bags, the S fraction is determined by additional analysis on the basis of solubility and filtration/centrifugation, after which the W–S fraction is calculated by difference (e.g., van Duinkerken et al., Reference van Duinkerken, Blok, Bannink, Cone, Dijkstra, van Vuuren and Tamminga2011; Volden, Reference Volden2011). However, this combined fractionation method (CF method) has several drawbacks. First, two methods are used that are not equal in solubility conditions, which can lead to systematic differences in determining S and W fractions. Especially for N, these differences can lead to inaccurate and sometimes even negative values for the W–S fraction (Madsen and Hvelplund, Reference Madsen and Hvelplund1994; de Jonge et al., Reference de Jonge, Spek, van Laar and Dijkstra2009). Second, the W–S fraction is calculated by difference, which makes it impossible to verify the accuracy of the method based on total recovery. Third, the inability to recover the W–S fraction precludes its further characterisation in terms of both chemistry and degradation.
The hypothesis of this study was that, by modifying the rinsing method, the modified method could yield similar W fractions compared with the CF method, while enabling direct quantification and characterisation of all the fractions. These modifications involve a closed system and standardised conditions enabling the separation and estimation of all fractions using one rinsing method and the replacement of water by a buffer solution that better mimics the rumen conditions (de Jonge et al., Reference de Jonge, Spek, van Laar and Dijkstra2009). The objectives of this study were to develop and test this modified method and to characterise the isolated W–S fraction. This testing was limited to nylon bags that were not incubated in the rumen (t = 0 h), and focused on N and starch, which are the most important components in the S and W–S fraction (Yang et al., Reference Yang, Tamminga, Williams, Dijkstra and Boer2005), although this modified method potentially can also be used for other components, such as organic matter and NDF.
Material and methods
Materials
Feed ingredients were selected on the basis of a high S fraction (faba beans, peas, soya beans) and/or W–S fraction (faba beans, maize, oats, peas and wheat) as measured with the CF method. In addition, four forages (two ryegrass silages and two maize silages) were included. Dry feed ingredients were ground to pass a 3 mm sieve (Retsch ZM100, Haan, Germany) and stored at 4°C. Frozen ryegrass silages were cut with a paper cutter at ∼1 cm according to the standard Dutch protocol (CVB, 2003), whereas frozen maize silages were cut to below 1 cm using a food cutter type Hobart 84186 (Troy, OH, USA). Silages were stored at −20°C pending analyses.
Methods
Modified method
After acclimatisation or thawing, ∼5 g DM of material was weighed into a nylon bag with an inner size of 10 × 8 cm, a pore size of 40 μm and porosity of 0.30 (PA 40/30, Nybolt, Switzerland). For dry feed ingredients, four bags, and for forages two bags were placed in a glass vessel (Ø 19 cm, 7 cm height) containing 500 ml buffer solution at room temperature. The buffer solution contained 12.2 g/l NaH2PO4·H2O and 8.9 g/l Na2B4O7·10H2O (Merck, Darmstadt, Germany) and was adjusted to pH 6.2 with HCl (de Jonge et al., Reference de Jonge, Spek, van Laar and Dijkstra2009). The vessels were placed in a mechanical shaker (Julabo SW-20c; Seelbach, Germany) for 60 min at a fixed speed. Three speeds (40, 100 and 160 strokes per minute (spm)) were investigated, with 40 and 160 spm representing the lowest and highest possible shaking speed. All incubations were performed in duplicate with vessels in different runs.
After 30-min shaking, the nylon bags were turned and after an additional 30 min removed and allowed to drip on a grid above the vessel. After 15 min, the bags were dried for 48 h at 70°C. After weighing, bags from one vessel were pooled and ground to pass a 1 mm sieve (Retsch ZM100). This sample corresponded to the D + U fraction. The buffer solution in the vessel was quantitatively centrifuged for 15 min at 20 000 × g (to obtain a sharp separation between both the solid and liquid phase), at 25°C and the supernatant was quantitatively collected and weighed (S fraction). The pellet (W–S fraction) was quantitatively collected, dried for 48 h at 70°C and ground using a mortar.
The D + U and W–S fractions were analysed for DM, N and starch (the latter not in ryegrass silage and soya beans), and the S fraction for N. The fractions of N and starch were calculated as the absolute amount in a specific fraction divided by the absolute amount in the nylon bags. The recovery of N and starch was calculated as the sum of all fractions (N in S, W–S and D + U fraction; starch in W–S and D + U fraction) relative to the N or starch content in the feed.
The characterisation of the W–S and D + U fractions was limited to the isolates obtained at 160 spm because of its relative similarity to the CF method. This characterisation involves the analyses for particle size distribution, solubility of protein and molecular size distribution of alkali-soluble protein.
CF method
The CF method was based on the official Dutch protocol (CVB, 2003). The D + U fraction was determined as described by Tas et al. (Reference Tas, Taweel, Smit, Elgersma, Dijkstra and Tamminga2006) using a programmable washing machine (AEG Turnamat, Nuremberg, Germany) with tap water at ∼18°C and the gentle ‘wool wash’ programme without centrifuging (40 min in ∼80 l tap water with three swing turns). Two bags per feedstuff were washed in different runs. After drying (70°C for 48 h), bags were weighed, pooled and ground to pass a 1 mm sieve (Retsch ZM100). The D + U fraction of N and starch was calculated as the remaining absolute amount after rinsing divided by the original amount in the nylon bag. The S fraction for N was determined with duplicates in different runs by extraction of 3 g of feedstuff with 75 ml tap water during 30 min under mechanical stirring at room temperature. The solution was centrifuged for 15 min at 3000 × g and an aliquot of the supernatant was analysed for N. For N and starch, the W–S fractions were calculated by difference.
Chemical analyses
Dry feed ingredients were ground to pass a 1 mm sieve before the analyses. Fresh forages were air-dried at 70°C during 48 h before grinding. Dry matter (DM) content of feed ingredients and dried residues was determined by drying to a constant weight at 103°C (ISO 6496, 1999). Nitrogen was determined using a Kjeldahl method with CuSO4 as the catalyst (ISO 5983-2, 2005). Starch was determined by an enzymatic method (ISO 15914, 2004).
Determination of particle size distribution
Particle size distribution of the W–S fractions was measured in the buffer solution directly after extraction of nylon bags, by laser diffraction using a Coulter LS 230 particle size analyser (Beckman Coulter Inc., Hialeah, FL, USA), capable of measuring particle sizes from 0.04 to 2000 μm. Particle size distribution was expressed as a fraction of the total volume.
Characterisation of proteins in the W–S and D + U fractions
For dry feed ingredients, proteins in the W–S fraction and in the D + U fraction were separated into alkaline soluble, acid detergent (AD) soluble and acid detergent insoluble (ADIN). Alkaline-soluble proteins were determined by extraction of 0.5 g material with 5 ml 0.1 M sodium hydroxide for 30 min, followed by centrifugation at 3000× g during 10 min and N analysis of the supernatant. ADIN was determined by hydrolysis of 1.0 g material during 1 h with 100 ml AD reagents (20 g Cetyl trimethylammonium bromide in 1 l 0.5 M sulphuric acid) based on the study by van Soest and Robertson (Reference van Soest and Robertson1985), followed by centrifugation at 3000 g during 10 min and determination of N in the residue. All analyses were performed in duplicate. The fraction of AD-soluble protein was calculated as 1 – fraction (alkaline soluble) – fraction (ADIN).
Molecular weight of alkaline-soluble protein was determined by vigorously mixing 0.5 ml of the supernatant with 0.25 ml 0.4 M dithiotreitol and 0.25 ml 10% (w/v) sodium dodecyl sulphate (SDS) solution, heating at 95°C for 5 min, and centrifuging at 14 000 × g for 2 min. Separation of proteins was carried out by chromatography using a BioSep-SEC-S2000 column (Phenomenex, Utrecht, The Netherlands) on an Ultimate 3000 HPLC system (Dionex, Sunnyvale, CA, USA), eluted with a 0.1 M phosphate buffer (pH 6.8) containing 2.5 g/l SDS. Precision Plus protein standard solution of Biorad (Hercules, CA, USA) was used for the identification of the molecular weight. Absorption at 220 nm was used to estimate the ratio between the different groups of proteins.
Statistical analyses
Analysis of variance was performed using the GLM procedure of (SAS Institute, 2002) to evaluate the effect of shaking speed (i.e., 40, 100 and 160 spm) for the different fractions of each feed ingredient and forage. When treatment effects were detected (i.e., P < 0.05), Tukey's test was used to test pairwise comparisons between treatments. Comparison between the CF method and the modified method at different shaking speeds for the S and D + U fraction was made using the GLM procedure of SAS Institute (2002), followed by the Dunnett test for pairwise comparison using the CF method as reference. Differences in solubility and molecular size of protein in the W–S v. D + U fraction were evaluated using a t-test.
Results
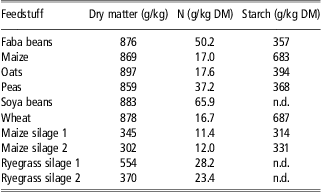
The DM, N and starch contents of the feed ingredients and forages are presented in Table 1. The N content ranged from 11.4 g/kg DM (maize silage 1) to 65.9 g/kg DM (soya beans), and the starch content ranged from 314 g/kg DM (maize silage 1) to 687 g/kg DM (wheat). Starch content was not determined in soya beans and ryegrass silages, as it is expected to be low or absent in these feeds.
Dry matter, N and starch content of dry feed ingredients and forages used for the comparison of fractionation methods
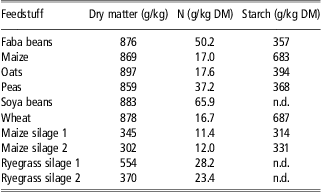
n.d = not determined.
Modified rinsing method and effect of shaking speed
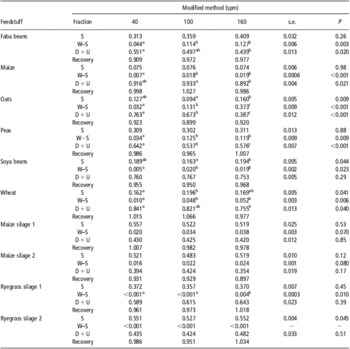
For N (Table 2), the average recovery was 0.972 ± 0.041 and varied between 0.897 for maize silage 2 at 160 spm and 1.066 for wheat at 100 spm. For faba beans, maize, peas, both maize silages and ryegrass silage 1, the S fraction was not significantly affected by the shaking speed. For oats and soya beans, the S fraction at 100 spm was significantly lower than at 160 spm, whereas the S fraction at 40 spm did not differ from the other shaking speeds. In the case of wheat, the S fraction at 100 spm was significantly higher than at 40 spm but did not differ with 160 spm. Although the overall effect was significant for the S fraction of ryegrass silage 2, there were no significant differences between shaking speeds as tested with Tukey's pairwise comparison. For dry feed ingredients, except soya beans, the W–S fraction increased and the D + U fraction decreased significantly at a higher shaking speed. For soya beans and ryegrass silage 1, only the W–S fraction significantly increased yet was very small (for soya beans <0.020 and for ryegrass silage 1 < 0.004). Shaking speed did not affect the W–S and D + U fractions of maize silages and ryegrass silage 2.
Fractionation of N into the soluble (S), insoluble washout (W–S) and non-washout (D + U) fraction in dry feed ingredients and forages using the modified rinsing method at shaking speeds of 40, 100 or 160 spm (n = 2)

a,b,c,dMeans in the same row with different letters differ (P < 0.05).
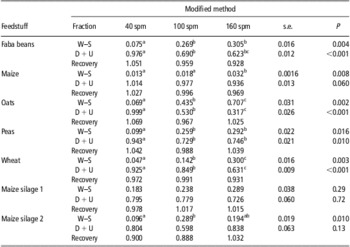
For starch (Table 3), the average recovery was 0.990 ± 0.050 and varied between 0.888 for maize silage 2 at 100 spm and 1.069 for oats at 40 spm. For the dry feed ingredients, except maize, the W–S fraction increased and the D + U fraction decreased significantly at a higher shaking speed. For maize and maize silage 2, the W–S fraction significantly increased at a higher speed. Shaking speed did not affect the W–S and D + U fractions of maize silage 1.
Fractionation of starch into insoluble washout (W–S) and non-washout (D + U) fraction in dry feed ingredients and forages using the modified rinsing method at shaking speeds of 40, 100 or 160 spm (n = 2)
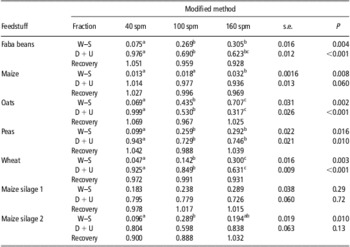
a,b,cMeans in the same row with different letters differ (P<0.05).
Comparison between the modified method and the CF method
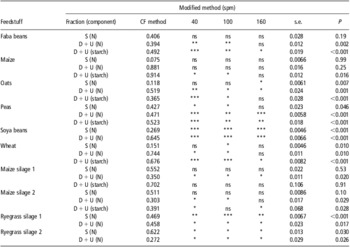
For soya beans and both ryegrass silages, the S fraction of N obtained by the CF method was significantly higher than for the modified method at all shaking speeds (Table 4). For oats, the S fraction with the CF method was only higher compared with the S fraction of the modified method at 160 spm. For wheat, the S fraction with the CF method was significantly lower than with the modified method at 100 and for peas at 40 and 100 spm. The S fraction obtained with the CF method in maize, both maize silages, and faba beans did not differ from that with the modified method at any shaking speed. The D + U fraction of N for the CF method was in nearly all cases lower compared with the modified method. For oats, peas, soya beans, maize silage 1 and both ryegrass silages, these differences were significant for all shaking speeds. For faba beans, wheat and maize silage 2, the D + U in the CF method was significantly lower than for the modified method at 40 and 100 spm. For maize, there were no significant differences between the CF method and the modified method.
Comparison of the CF method for the S and D + U fraction for N and starch with the modified method at shaking speed 40, 100 or 160 spm (n = 2)

ns, P > 0.05.
*0.01 < P < 0.05; **0.001 < P < 0.01; ***P < 0.001.
In general, the calculated W–S fractions of N obtained with the CF method were larger than that measured by the modified method. The relatively greatest differences were found for the two ryegrass silages, where the W–S fraction of N with the modified method was very small but was 0.073 and 0.106 with the CF method.
For starch, the D + U fraction for the CF method was generally lower than that with the modified method. In case of faba beans, peas and wheat, the differences between both methods were significant at all shaking speeds. For maize and oats, the D + U fraction of the CF method was lower compared with the modified method at shaking speeds of 40 and 100 spm only, and for maize silage 2 at 40 and 160 spm. For maize silage 1, there were no significant differences between the CF method and the modified method.
In general, the calculated W–S fractions in the CF method were larger than that measured by the modified method. The CF method showed the best comparison with the modified method at 160 spm, although there were significant differences between the results obtained by both methods.
The repeatability of the modified method did not differ from that of the CF method. For the D + U fraction of N and starch, and the S fraction of N, the average over feedstuff for the difference between the two runs was 0.03 for both methods (results not shown).
Characterisation of W–S and D + U fractions
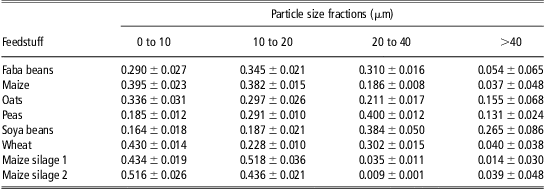
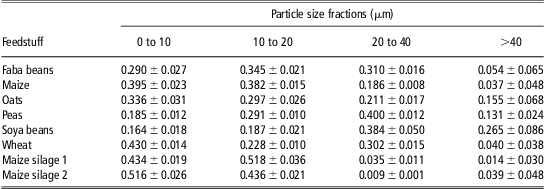
In most feedstuff, starch was the most abundant chemical component in the W–S fraction obtained at 160 spm and its content (726 ± 75 g/kg DM) was higher than in the D + U fraction (405 ± 177 g/kg DM). The starch content in the W–S fraction ranged from 629 g/kg DM in faba beans to 866 g/kg DM in wheat and in the D + U fraction from 225 g/kg DM in oats to 685 g/kg DM in maize (results not shown). Most particles in the W–S fraction with the modified method at 160 spm were smaller than 40 μm, which corresponded with the pore size of the nylon bags (Table 5). The fraction of particles larger than 40 μm varied from 0.014 (maize silage 1) to 0.265 (soya beans). The fraction of very small particles (i.e., <10 μm) in grains varied between 0.336 and 0.430, whereas this fraction varied between 0.164 and 0.290 in legume seeds. In maize silage, more than 95% of the particles were smaller than 20 μm.
Particle size distribution (based on partial volume) of the insoluble washout fraction (W−S) of feedstuff separated with the modified method at a shaking speed of 160 spm (n = 4)
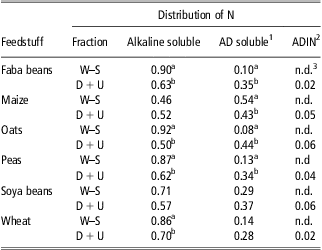
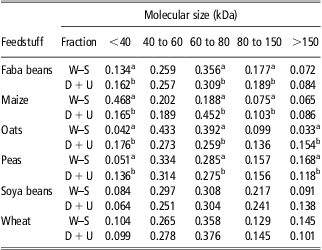
Except for maize, protein-N in the W–S fraction of the dry feed ingredients was mainly present as alkaline-soluble proteins (Table 6). The relative amount of this type of protein-N in the W–S fraction varied between 0.46 for maize and 0.92 for oats, and was higher than the relative amount in the D + U fraction, except for maize and soya beans. ADIN was not detectable in the W–S fractions (i.e., <0.01), whereas it varied between 0.02 and 0.06 in the D + U fractions. The calculated fraction of AD-soluble protein N in W–S fraction was lower than in D + U fraction for faba beans, oats and peas, but was higher for maize. Alkaline-soluble proteins in both W–S and D + U fractions contained mainly large (i.e., >40 kDa) subunits (Table 7). The fraction of alkaline-soluble proteins between 60 and 80 kDa was higher in the W–S fraction than in the D + U fraction for faba beans, oats and peas, but lower for maize. In oats, the D + U fraction had a higher fraction of large-sized proteins (>150 kDa) than the W–S fraction; however, this was the opposite in peas. The W–S fraction contained a lower fraction of small (<40 kDa) alkali-soluble proteins than the D + U fraction for faba beans, peas and oats; however, for maize, the opposite was found. For soya beans and wheat, no differences in distribution of the molecular size of alkaline-soluble proteins between both fractions were observed.
Fraction of N from the insoluble washout fraction (W−S) and non-washout fraction (D + U) separated with the modified method at a shaking speed of 160 spm and based on alkaline or acid detergent solubility (n = 2)
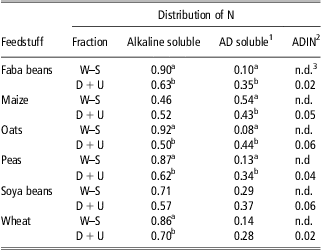
a,bMeans in the same column for each feedstuff with different letters differ (P < 0.05).
1AD-soluble acid detergent soluble; calculated as 1 − alkaline soluble − ADIN.
2ADIN = acid detergent insoluble N.
3n.d. = not detectable (i.e., < 0.01).
Molecular size classes of alkaline-soluble proteins from the insoluble washout fraction (W−S) and non-washout fraction (D + U), as a fraction of the total alkaline-soluble proteins, separated with the modified method at a shaking speed of 160 spm (n = 2)
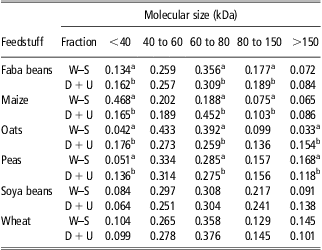
a,bMeans in the same column for each feedstuff with different letters differ (P < 0.05).
Discussion
The modified rinsing method enables the separation, isolation and analysis of the different fractions within one procedure for non-incubated feedstuff (t = 0 h) The high average recovery (0.972 ± 0.041 and 0.990 ± 0.050 for N and starch, respectively) indicates that the sum of the fractions represented the total feedstuff quite accurately. To obtain complete recovery, which is needed in most feed evaluation systems, a correction factor should be used for all fractions. The solubility of N in the feedstuff was not systematically affected by shaking speed. Using a higher shaking speed mostly increased the loss of particles leading to an increase of the W–S and a decrease of the D + U fraction, especially for starch.
In general, the D + U fraction of starch and of N was lower for the CF method than for the modified method, presumably as a consequence of the more vigorous rinsing conditions, which is in line with Cherney et al. (Reference Cherney, Patterson and Lemenager1990) and Cockburn et al. (Reference Cockburn, Dhanoa, France and López1993). The difference between both methods was smaller for the higher shaking speeds of the modified method. Differences between the S fractions of N for both methods were also observed for several feeds, presumably related to differences in solvent, which is in line with the previous observations (de Jonge et al., Reference de Jonge, Spek, van Laar and Dijkstra2009). Differences between the W–S fractions for N found by both methods are the result of the combination of differences found for the other fractions (i.e., S and D + U). The greatest difference was obtained for the W–S fraction in ryegrass silage, which was virtually zero in the modified method, whereas the calculated values for the CF method were 0.073 and 0.106. The higher values calculated for the W–S fraction of N in ryegrass silages may be explained by the use of different protocols, in particular the shaking speed, for the determination of the S and the W fraction as in the CF method.
The second aim of this study was to characterise the isolated W–S and D + U fraction in terms of particle size, chemical composition and protein structure for feedstuff not incubated in the rumen (t = 0 h). The W–S fraction contained mainly particles smaller than 40 μm, which is in line with the observations made by Michalet-Doreau and Ould-Bah (Reference Michalet-Doreau and Ould-Bah1992) and is similar to the pore size of the nylon bags used. The presence of a fraction larger than 40 μm could be caused by particles that are not completely spherical, for instance, rod-shaped, that can escape from the nylon bag but are recorded as larger than 40 μm by the particle size analyser. For most feedstuff, the W–S fraction contained a high content of starch, which was in line with the earlier results from Yang et al. (Reference Yang, Tamminga, Williams, Dijkstra and Boer2005). For most dry feeds, the largest part of the N in the W–S fraction was present as alkaline-soluble proteins, which are a part of the B2 fraction in the system described by Licitra et al. (Reference Licitra, Hernandez and van Soest1996). The D + U fraction contained relatively more AD-soluble proteins that are part of the B2 or B3 fraction in that system. The molecular weight pattern of the alkaline-soluble proteins showed that there are differences between the alkali-soluble proteins of the W–S and the D + U fraction. The U (undegradable) fraction for proteins is, according to NRC (2001), equal to ADIN. The ADIN fraction was low (<0.06 of total N) in the D + U fraction and therefore the characteristics of the D + U fraction are assumed to be largely similar to that of the D fraction in these feedstuff. In several feed evaluation systems (Thomas, Reference Thomas2004; van Duinkerken et al., Reference van Duinkerken, Blok, Bannink, Cone, Dijkstra, van Vuuren and Tamminga2011; Volden, Reference Volden2011), proteins of the W–S and of the D (potential degradable) fraction are presumed to have the same fractional degradation rate. The results of the present study, however, indicate that protein characteristics in the W–S and D fraction of the dry feed ingredients do differ.
Only limited information is available to evaluate the effect of the differences in alkaline solubility and molecular size distribution of proteins on ruminal N degradation. Kandylis and Nikokyris (Reference Kandylis and Nikokyris1997) found a positive correlation between alkali solubility and ruminal N degradation for different feedstuff, which could indicate a higher fractional degradation rate for the W–S fraction of the dry feed ingredients (except maize) than for the D + U fraction. The alkali-soluble fraction of faba beans, peas and soya beans contains mostly 7S and 11S globulins and oats contains mainly 3S, 7S and 12S globulins (Chang et al., Reference Chang, Alli, Konishi and Ziomek2011). The 11S globulins are more resistant to rumen degradation compared with the other proteins in faba beans (Chaudhry and Webster, Reference Chaudhry and Webster2001), peas (Spencer et al., Reference Spencer, Higgins, Freer, Dove and Coombe1988), and soya beans (Aufrère et al., Reference Aufrère, Garces, Graviou, Hernando and Demarquilly1999; Chiou et al., Reference Chiou, Yu and Wu1999). The 12S globulins in oats are structurally similar to 11S globulins in peas (Chang et al., Reference Chang, Alli, Konishi and Ziomek2011), which could indicate that this protein is more resistant compared with the other proteins. Basic and acid subunits of 11S and 12S globulins are smaller than 40 kDa, whereas the fraction between 60 and 80 kDa contains mainly 7S subunits. For faba beans, oats and peas, the significantly higher fraction of proteins in the 60 to 80 kDa fraction indicates more 7S globulins and less 11S globulins in the W–S fraction than in the D + U fraction, which implies a higher fractional ruminal degradation rate. For maize, the fraction of proteins smaller than 40 kDa was significantly higher in the W–S fraction than in the D + U fraction, which may be caused by a higher content of zein (20 kDa). Romagnolo et al. (Reference Romagnolo, Polan and Barbeau1994) found a higher fractional ruminal degradation rate for zein compared with other proteins, which could indicate that the fractional ruminal degradation rate of the W–S fraction is also higher than of the D + U fraction. These results suggest that the fractional degradation rate of proteins from the W–S fraction is higher than those from the D + U fraction. Previously, various correction methods for losses of small particles in estimating effective degradability of the substrate have been proposed (Weisbjerg et al., Reference Weisbjerg, Bhargava, Hvelplund and Madsen1990; Dhanoa et al., Reference Dhanoa, France, Lopez, Dijkstra, Lister, Davies and Bannink1999). In calculating effective degradability, fractional degradation rate has to be determined or assumptions have to be made for fractions not retained in the bag, as well as assumptions on fractional passage rate for each fraction, and results of the present study may help to obtain proper fractional degradation rates. Further research work is needed to evaluate the effect of the different protein composition in both fractions on the consequences for ruminal degradation and ultimately nutritional value.
A possible additional advantage of the modified method is that it allows the use of different shaking speeds that offers the opportunity to reduce the loss of particles during rinsing compared with the CF method. With the CF method, various feedstuff are characterised by low D + U fractions that hamper a proper quantification of the fractional degradation rate of the complete feedstuff. The lower W–S and higher D + U fraction for the modified method, especially at reduced shaking speeds offers opportunities to increase the proportion of the feed, especially for starch, for which a fractional degradation rate can be determined, as well as to investigate products and nutrients that cannot be accurately measured with the CF method (Dewhurst et al., Reference Dewhurst, Hepper and Webster1995; Ørskov, Reference Ørskov2000). On the other hand, reduced shaking speed could lead to a less efficient removal of rumen contamination, especially particle-associated bacteria, leading to an underestimation of the fractional degradation rate of, in particular, N. This topic should also be the subject of further investigation. Before the modified method can be used in in situ studies, a full evaluation of its effects on the rinsing of incubated nylon bags and the consequences on the estimated fractional degradation rate of the D + U fraction should be carried out.
Conclusions
The developed, modified method enables the direct quantification and characterisation of all fractions for non-rumen-incubated feedstuff (t = 0 h). Compared with the CF method, the modified method does result in different values for the S, W–S and D + U fractions depending on the feedstuff. Differences between the CF and the modified method decreased at higher shaking speeds. The W–S fraction of most feedstuff contained mainly starch and alkali-soluble proteins. The proteins in the W–S and D + U fraction showed significant differences in (alkali-)solubility and distribution of their molecular size.
Acknowledgements
The authors thank the Dutch Product Board Animal Feed for their financial support and Helen Joan Esser, Niels Wever and Harry Baptist for their help during execution of this research.