Transmission of the novel severe acute respiratory syndrome coronavirus 2 (SARS-CoV-2) first occurred in December 2019 and eventually progressed to a global pandemic. SARS-CoV-2 transmission has been prevalent in the United States in 2020 and 2021, resulting in significant morbidity and mortality (https://coronavirus.jhu.edu).
Throughout the pandemic, healthcare system employees continue to provide direct care for patients, to perform services necessary for hospital operations, and to conduct research to advance science. Working in these capacities, employees are potentially at increased risk of exposure to and infection from SARS-CoV-2. Because SARS-CoV-2 infection can be asymptomatic and testing of symptomatic patients has not been universal, serological studies are necessary to better understand the prevalence of SARS-CoV-2 infection among employees at healthcare centers. Studies assessing healthcare workers in adult institutions around the world have reported SARS-CoV-2 seroprevalence rates ranging from 1% to 13.7%. Reference Sikkema, Pas and Nieuwenhuijse1–Reference Behrens, Cossmann and Stankov3 Point-prevalence studies of employees providing services specifically to children and adolescents in countries outside North America have also revealed wide range of seroprevalence rates (0–16.9%), Reference Dacosta-Urbieta, Rivero-Calle and Pardo-Seco4,Reference Goldblatt, Johnson and Falup-Pecurariu5 but specimens were not collected beyond July 2020 in either of these studies.
The seroprevalence among employees at pediatric institutions in the United States remains largely unknown. Furthermore, longitudinal data on seroprevalence rates among academic healthcare employees are limited. We aimed to longitudinally assess SARS-CoV-2 seroprevalence among employees working at a large academic children’s hospital in Philadelphia, Pennsylvania, during an 8-month period of the SARS-CoV-2 pandemic. Factors associated with presence of SARS-CoV-2 antibody positivity were explored to better understand risk profiles for employees both within and outside the healthcare setting. Finally, cumulative seroprevalence rates were described in the context of the surrounding community’s weekly PCR positivity rate and point-seroprevalence rates.
Methods
Study design and participant enrollment
This research was a prospective observational cohort study of employees at Children’s Hospital of Philadelphia (CHOP). Starting April 20, 2020, employees were offered the opportunity to participate in this study regardless of prior SARS-CoV-2 infection history. The study remained open to enrollment until November 4, 2020. Employees were invited to participate by work group, starting with clinical groups with high risk of exposure (eg, the SARS-CoV-2 treatment unit, intensive care unit, emergency department, and infectious diseases division). Subsequently, clinical work groups were approached alphabetically. Simultaneously, employees providing on-campus nonhealthcare services (ie, environmental, nutritional, security, administrative, and research services) were approached. Recruitment e-mails were sent to address lists provided by leaders of respective employee groups. Additionally, study flyers were posted at work locations on campus; announcements were made at employee virtual town hall events; and recruitment details were included in a frequently asked questions document available to employees on the intranet.
Hospital mitigation strategies
All CHOP employees able to perform their work at home were advised to do so starting on March 13, 2020. The hospital bioresponse team developed and deployed guidelines for employees deemed essential to work onsite, including instructions for employees with suspected or confirmed SARS-CoV-2 infection, recent travel, or recent exposure to an individual with suspected or confirmed SARS-CoV-2 infection. A universal masking mandate for on-campus employees was enacted on March 30, 2020, and universal eye protection was required for patient interactions starting on August 3, 2020. Employees in a room where an aerosol-generating procedure was performed were required to use an N95 mask and eye protection or powered air purifying respirator.
Beginning March 24, 2020, all admitted patients were tested for SARS-CoV-2 prior to or at the time of admission using a polymerase chain reaction (PCR) assay developed by the CHOP laboratory. Patients testing positive by nasopharyngeal PCR were admitted to a dedicated unit for SARS-CoV-2–infected patients. Employees providing patient care in this unit were required to wear an N95 mask and eye protection or powered air purifying respirator.
Data and specimen collection
Participants responding to recruitment materials were directed to complete an electronic consent form within Research Electronic Data Capture (REDCap) hosted at CHOP; those consenting were contacted to schedule the baseline specimen collection appointment. Reference Harris, Taylor, Thielke, Payne, Gonzalez and Conde6,Reference Harris, Taylor and Minor7 Participants completed a REDCap screen for current or recent viral illness symptoms 0–1 days prior to the scheduled appointment. Participants self-reporting current or recent viral illness symptoms had their appointments rescheduled and were rescreened prior to the rescheduled appointment. Participants passing the symptom screen completed a previsit REDCap questionnaire in which they self-reported information on demographics, employment location, and potential occupational and community SARS-CoV-2 details. An initial specimen was collected at this visit. After completing the baseline visit, automated e-mail reminders were sent to schedule 1-month, 2-month, and 6-month visits. A symptom screen and questionnaire about exposures since the previous visit was completed in REDCap 0–1 days prior to each scheduled follow-up appointment. Participants who missed a visit were allowed to attend subsequent visits. Participants were required to comply with mitigation strategies during study visits.
Serology assays
During each study visit, 5 mL whole blood was collected into a serum separator tube. Specimens were allowed to clot for 30 minutes and then centrifuged for 10 minutes at 3000 rcf. Serum was decanted into labeled tubes and was frozen at −80°C.
Serum IgM and IgG antibodies reactive to the receptor binding domain of the SARS-CoV-2 spike protein were quantified using enzyme-linked immunosorbent assays (ELISAs) as previously described. Reference Sikkens, Buis and Peters8 Recombinant proteins for these assays were purified and quantified via Nanodrop. A control monoclonal antibody that recognizes the SARS-CoV-2 spike protein (CR3022) included on each ELISA plate allowed direct comparison of values between individual ELISA plates. Validation performed prior to this study established a positive threshold of 0.48 units for both IgM and IgG at which the assay sensitivity was nearly 100% (95% confidence interval [CI], 89.1%–100%) and specificity was 98.9% (95% CI, 98.0%–99.5%). Reference Sikkens, Buis and Peters8 Serology results were reported to participants with guidance that employees cannot use results from this research test to inform future infection risk or guide decisions regarding use of personal protective equipment. Participants began receiving results no earlier than 2 months after the baseline visit.
Community SARS-CoV-2 PCR positivity rates and point seroprevalence rates
Weekly SARS-CoV-2 PCR positivity rates were downloaded from the City of Philadelphia OpenDataPhilly data source (https://www.opendataphilly.org/dataset/covid-cases). SARS-CoV-2 point-seroprevalence rates for the Philadelphia metropolitan area were obtained from the Centers for Disease Control and Prevention (CDC) Commercial Laboratory Seroprevalence Survey (https://www.cdc.gov/coronavirus/2019-ncov/cases-updates/commercial-lab-surveys.html#surveymap). Citywide seroprevalence rates were available at five 2020 time points: April 13–25, May 26–30, June 14–20, July 6–11, and July 27–August 1.
Statistical analysis
The analysis included all specimens collected on or before December 17, 2020, from participants who had undergone ELISA IgM and IgG testing. The primary outcome was the seroprevalence rate, defined as the proportion of participants with detectable levels of IgM and/or IgG antibodies. A participant was considered seropositive if they were IgM and/or IgG positive at baseline or at any follow-up assessment. Seroprevalence and seroincidence per 1,000 person days were described for the entire cohort and by demographic characteristics, employment type, and community factors. At-risk periods for seroincidence calculations began March 11, 2020, the collection date of the first positive SARS-CoV-2 tests reported by the City of Philadelphia.
Because seropositivity rates appeared to be higher among certain subgroups, a post hoc multivariable analysis was performed. To account for potential confounding, loss to follow-up, and varying follow-up time, a Cox proportional hazards model was constructed to examine potential seropositivity risk factors over time. At-risk periods for SARS-CoV-2 infection started on March 11, 2020. Seropositivity onset was defined as the collection date of the first specimen with detectable SARS-CoV-2 antibody. Our initial model considered provision of direct patient care, demographic variables (eg, age category, sex, race, and ethnicity), personal health factors (eg, asthma) and time-varying community-related factors. The community-related factors included exposure to a confirmed or suspected SARS-CoV-2–infected person in a nonhealthcare setting since January 1, 2020 (in the baseline questionnaire), or since the previous study visit for any follow-up questionnaires. From these factors, our final model was selected via backward elimination with elimination criteria of P > .20. Analyses were performed using SAS version 9.4 software (SAS Institute, Cary, NC).
Quantitative results for participants with positive IgG at baseline and for whom subsequent specimen results were available were displayed graphically, stratified by self-reported history of SARS-CoV-2 PCR positivity. The linear smoothed means of log2 IgG quantitative assay results with 95% confidence bounds were calculated and plotted using the ggplot package in R version 4.0.3 software and R Studio version 1.4.1103 software (R Foundation, Vienna, Austria).
Finally, the cumulative proportion of participants with positive SARS-CoV-2 IgM and/or IgG antibodies was displayed graphically for the entire study period juxtaposed to weekly proportions of positive SARS-CoV-2 PCR tests in the City of Philadelphia and point-seroprevalence rates in Philadelphia metropolitan area at 5 time points. This graph was produced using ggplot package in R version 4.0.3 software and R Studio version 1.4.1103 software (R Foundation, Vienna, Austria).
This study received approval after full review by the CHOP Institutional Review Board.
Results
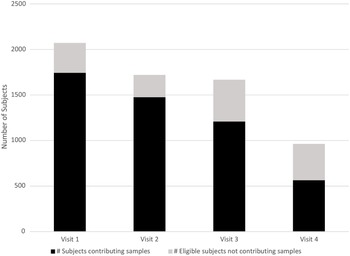
As of December 17, 2020, a total of 1,740 participants were enrolled, and they were followed for a median of 169 days (interquartile range [IQR], 104–223). In total, 4,985 blood samples were collected: 1,740 at baseline, 1,465 at 1 month, 1,210 at 2 months, and 570 at 6 months (Fig. 1). Participants were predominantly female (81%), White (87%), and non-Hispanic (93%). The group aged 30–39 years was the largest (37%), followed by those aged 40–49 years (20%) (Table 1).
The proportion of eligible participants contributing a blood sample at each study visit. Note. Visit 1: baseline study visit. Visit 2: 1-month study visit with an intended scheduling window of ±14 days and an actual sample collection window of ±15 days. Visit 3: 2-month study visit with an intended scheduling window of ±14 days and an actual sample collection window of −15/+31 days. Visit 4: 6-month study visit with an intended scheduling window of ±30 days and an actual sample collection window of −30/+46 days.

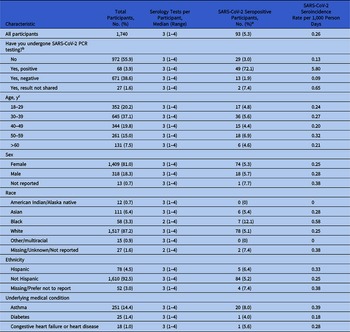
SARS-CoV-2 Seroprevalence Rates by Participant Demographic Characteristics and SARS-CoV-2 Infection History

a Patients were said to be seropositive if at least 1 of their specimens had an IgM and/or IgG value >0.48 µg/mL. Two participants were IgM-only positive and 30 participants were both IgM and IgG positive.
b 2 participants did not report history of SARS-CoV-2 PCR testing.
c 3 participants did not report a valid age.
Seroprevalence by demographics
The overall seroprevalence was 5.3% (93 of 1,740; seroincidence 0.26 per 1,000 person days); 71 (76.3%) of 93 seropositive participants were IgG positive at their baseline visit. The seroprevalence of participants who reported a history of a positive SARS-CoV-2 PCR was 72.1% (49 of 68). Participants who were never tested by PCR had a seroprevalence rate of 1.9%; those who reported only negative PCR tests had a seroprevalence rate of 3.0%. The seroprevalence for female employees was 5.3% and for male employees it was 5.7%. The seroprevalence for White participants was 5.1% (0.28 per 1,000 person days) and the seroprevalence for Black participants was 12.1% (0.58 per 1,000 person days). Participants aged 50–59 years had a seroprevalence of 6.9% (0.32 per 1,000 person days), and those with self-reported history of asthma had a seroprevalence of 8.0% (0.39 per 1,000 person days) (Table 1).
Seroprevalence related to community exposures
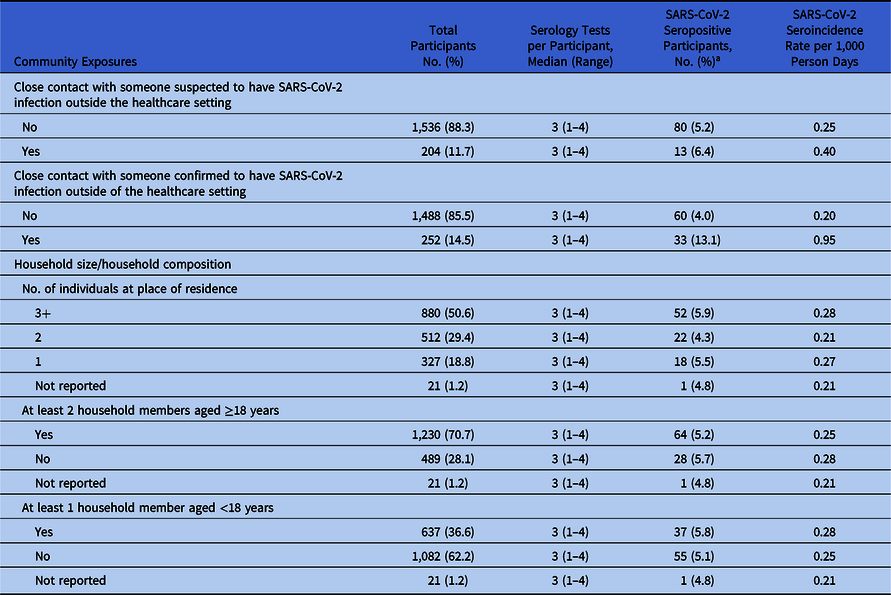
In total, 252 participants (14.5%) reported close contact with a confirmed SARS-CoV-2–infected person in a nonhealthcare setting. The seroprevalence among these individuals was 13.1% (0.95 per 1,000 person days) (Table 2). The seropositivity increased to 14.9% (20 of 134) among participants who had an exposure to confirmed SARS-CoV-2–infected person in a nonhealthcare setting and resided in a household with ≥3 people.
SARS-CoV-2 Seroprevalence by Participant Community Exposures

a Patients were said to be seropositive if at least 1 of their specimens had an IgM and/or IgG value >0.48 µg/mL. Two participants were IgM-only positive and 30 participants were both IgM and IgG positive.
Seroprevalence by exposures related to patient care
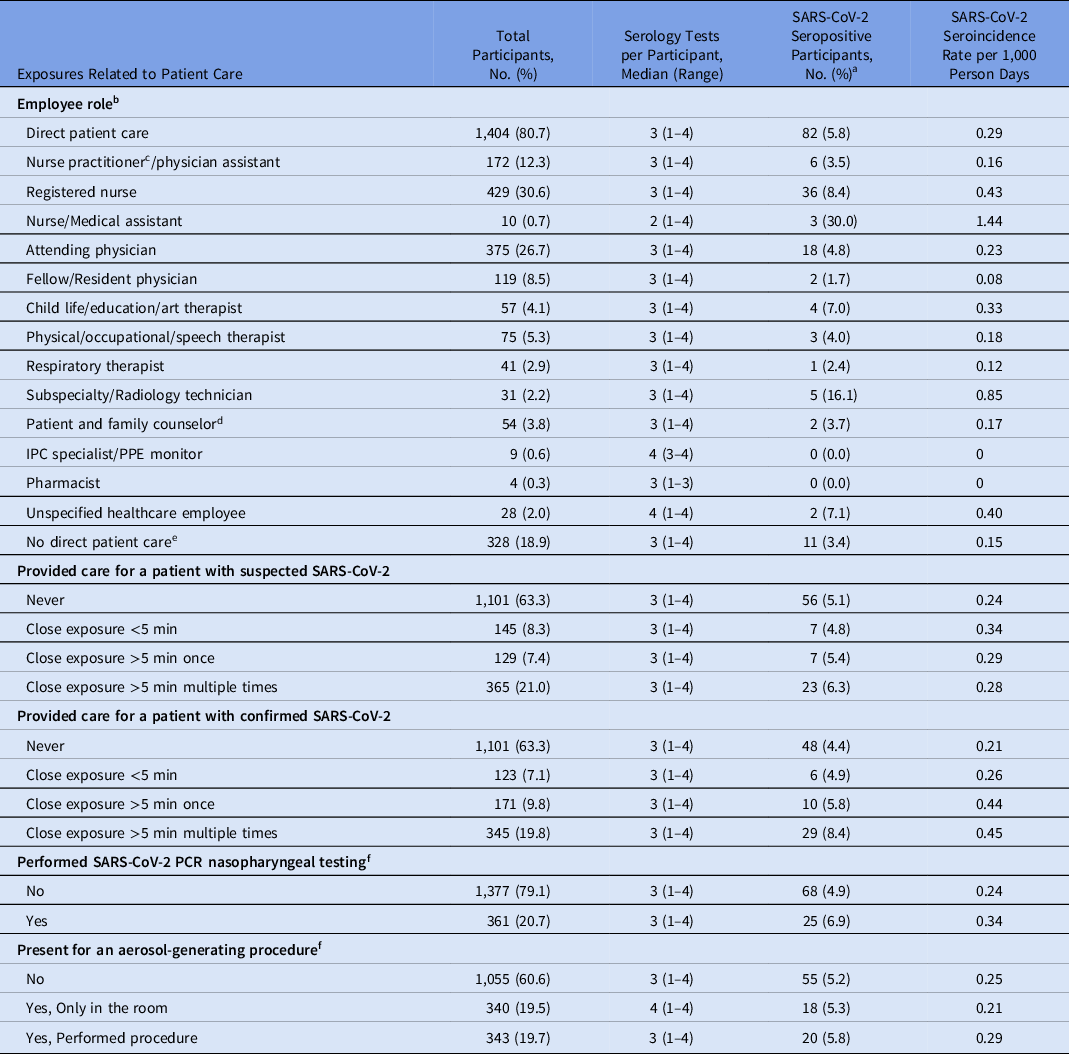
The majority of participants (80.7%) provided direct patient care. Seroprevalence among these individuals was 5.8% (0.29 per 1,000 person days). Participants who collected specimens for clinical SARS-CoV-2 PCR testing had a seroprevalence of 6.9% (0.34 per 1,000 person days), and those with multiple prolonged (>5 minutes) close contacts with a patient with PCR-confirmed SARS-CoV-2 infection had a seroprevalence rate of 8.4% (0.45 per 1,000 person days) (Table 3). For participants working in settings without direct patient care, the seroprevalence was 3.4% (0.15 per 1,000 person days).
SARS-CoV-2 Seroprevalence by Participant Healthcare Occupational Exposures

Note. IPC, infection prevention and control; PPE, personnel protective equipment.
a Patients were said to be seropositive if at least 1 of their specimens had an IgM and/or IgG value >0.48 µg/mL. Two participants were IgM-only positive and 30 participants were both IgM and IgG positive.
b 8 participants did not report their employee role.
c Includes nurse anesthetists.
d Includes counselors in psychiatry, behavioral medicine, genetics and nutrition.
e Includes laboratory personnel, research staff, and administrative staff.
f 1 participant did not respond.
Risk factors for SARS-CoV-2 seropositivity
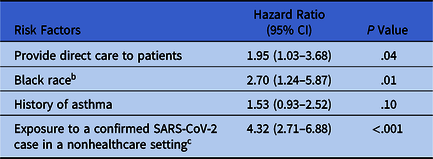
In the multivariable Cox model, provision of direct patient care (hazard ratio [HR], 1.98; 95% CI, 1.05–3.74), Black race compared to all other races (HR, 2.70; 95% CI, 1.24–5.87), and exposure to a confirmed case in a nonhealthcare setting (HR, 4.81; 95% CI, 2.92–7.93) were all independent risk factors for increased risk for seropositivity (Table 4).
Post Hoc Multivariable Cox Proportional Hazards for Seroprevalence by Patient Factors that May Affect the Risk of SARS-CoV-2 Seroconversion a

Note. CI, confidence interval.
a Risk factors removed from model include: exposure to a suspected SARS-CoV-2 participant in a non-healthcare setting (P = .47), age (P = .41), Hispanic ethnicity (P = .40), and female birth sex (P = .30).
b Reference is all other racial groups.
c Time-varying covariate.
Durability of IgG antibodies
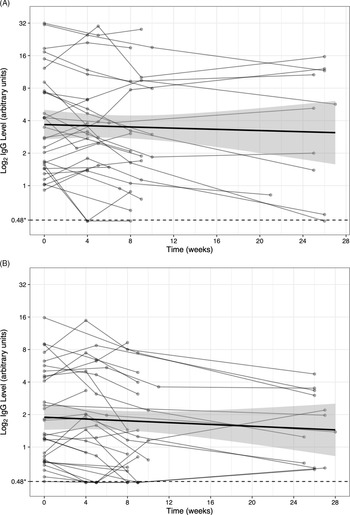
Among the 71 participants with IgG seropositivity at the baseline visit, 59 attended at least 1 follow-up visit. These included 52 visits at 1 month, 45 visits at 2 months, and 23 visits at 6 months. Of the 23 participants with a 6-month follow-up specimen, 22 (95.7%) remained seropositive. The median quantitative IgG levels were higher at each time point for participants reporting a history of SARS-CoV-2 PCR positivity compared to those not reporting a positive PCR history (Fig. 2A and 2B).
(A) The 1-month, 2-month, and 6-month SARS-CoV-2 IgG levels among participants with a self-reported history of SARS-CoV-2 PCR positivity and with IgG positivity at baseline. (B) The 1-month, 2-month, and 6-month SARS-CoV-2 IgG levels among participants with no self-reported history of SARS-CoV-2 PCR positivity but with IgG positivity at baseline. The dotted line at 0.48 units indicates threshold for positivity of the enzyme-linked immunosorbent assay detecting IgG to the receptor binding domain of the SARS-CoV-2 spike protein. The bold black line indicates linear smoothed conditional means of log2 IgG levels over time for all participants with positive IgG at baseline and for whom subsequent specimen results were available. Grey shadowing represents the 95% confidence intervals around this trajectory. Note. SARS-CoV-2, severe acute respiratory syndrome coronavirus 2; PCR: polymerase chain reaction.

Cumulative SARS-CoV-2 seropositivity compared to community SARS-CoV-2 PCR positivity rates and point-seroprevalence rates
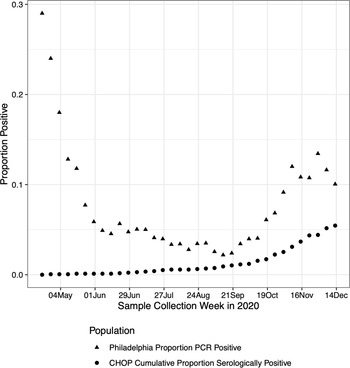
The cumulative SARS-CoV-2 seroprevalence is displayed in Figure 3. The study cohort seroprevalence slowly increased from the start of the study until early October 2020, when the rate of seroprevalence increase became faster. The weekly PCR positivity rate reported in the City of Philadelphia during the study period ranged between 20% and 30% in the spring of 2020, with a subsequent decline in the summer followed by a second increase starting in the fall and continuing until the end of the study period. Point-prevalence data reported by the CDC for the Philadelphia metropolitan area using commercial laboratory seroprevalence revealed a seroprevalence rate of 3.2% between April 13 and April 25, which increased to 6.1% between July 27 and August 1, 2020.
Cumulative proportion of employees with positive SARS-CoV-2 serology and weekly PCR positivity rates in Philadelphia during the study period. Solid triangles represent weekly PCR positivity rates in Philadelphia. Solid circles represent the weekly cumulative proportion of study participants who were seropositive for SARS-CoV-2.

Discussion
The cumulative SARS-CoV-2 seroprevalence between April and December 2020 for an employee cohort at a large academic pediatric medical center in Philadelphia, Pennsylvania was 5.3% (0.26 per 1,000 person days). Overall rates remained below point-seroprevelance rates in the surrounding community for the corresponding time period, but they varied by employment type and demographic factors. The seroprevalence rate was higher among employees performing SARS-CoV-2 PCR testing (6.9%; 0.34 per 1,000 person days) as well as employees reporting repeated exposures of >5 minutes to a patient with confirmed SARS-CoV-2 infection (8.4%; 0.45 per 1,000 person days). A post hoc multivariable Cox proportional hazards model identified provision of direct patient care, Black race, and exposure to a confirmed SARS-CoV-2–infected person in a nonhealthcare setting as associated with a significantly increased risk for seropositivity.
Previous cohort studies of employees at adult healthcare centers in Germany, the Netherlands, and New York City have reported seroprevalence rates of 2% to 13.7%. Reference Sikkema, Pas and Nieuwenhuijse1–Reference Behrens, Cossmann and Stankov3 Point-prevalence studies of healthcare workers at pediatric centers outside the United States have also revealed a wide range of seroprevalence (0–16.9%). Reference Dacosta-Urbieta, Rivero-Calle and Pardo-Seco4,Reference Goldblatt, Johnson and Falup-Pecurariu5 It is difficult to compare seroprevalence rates across cohorts because differences are likely multifactorial, including cohort assembly timing relative to local transmission, variation in antibody detection assays, differential inclusion criteria, and differences in mitigation implemented in the work environment.
The seroprevalence for our cohort was lower than observed in the surrounding community. This finding suggests that mitigation strategies implemented early during the pandemic by the hospital, including universal masking, targeted N95 use and remote work for nonessential employees, were protective and likely resulted in reduced transmission from employees to employees, patients to employees, and employees to patients. Additionally, some employees may have benefited from enhanced awareness of risk factors associated with infection and use of mitigation measures in community settings.
Occupational factors were associated with differential rates of seroprevalence. Employees who performed direct patient-care responsibilities had a higher rate of seroprevalence than those who did not perform direct patient care; this observation persisted in post hoc multivariable analysis (HR, 1.98; 95% CI, 1.05–3.74). Furthermore, employees experiencing repeated exposures >5 minutes to a PCR-confirmed SARS-CoV-2 patient had a seroprevalence rate of 8.4% compared to a rate of 4.4% among those not exposed to a PCR-confirmed patient. These data suggest a seroconversion risk among healthcare personnel caring for PCR-confirmed SARS-CoV-2 pediatric patients. A similar increased relative risk was identified for healthcare workers providing direct patient care at 2 adult medical centers in the Netherlands. Reference Sikkens, Buis and Peters8 When developing pandemic response procedures, increased attention to mitigation strategies for personnel caring for SARS-CoV-2 infected patients in adult and pediatric care settings is warranted.
Seroconversion risk was also increased for certain demographic factors. In the post hoc multivariable model accounting for direct patient care status, Black race (HR, 2.70; 95% CI, 1.24–5.87), and known exposure to a confirmed SARS-CoV-2 person in a nonhealthcare setting (HR, 4.32; 95% CI, 2.71–6.88) each remained significantly associated with seropositivity. These findings are consistent with prior reports that associated race and ethnicity status with SARS-CoV-2 infection risk. Reference Flannery, Gouma and Dhudasia9–Reference Akinbami, Vuong and Petersen12 Thus, it is important for bioresponse teams to consider social determinants of health in addition to occupational risk factors when developing and messaging employee guidance during an epidemic or pandemic. Reference Lopez, Hart and Katz13
The vast majority of patients (95.7%) with IgG seropositivity at baseline remained qualitatively positive at 6 months. The mean quantitative IgG level was higher at each time point in individuals with prior history of SARS-CoV-2 PCR positivity. These longitudinal IgG measurements are consistent with expected humoral response following acute viral infection and are similar to results reported among cohorts of participants with COVID-19 illness from New York City and patients and healthcare workers with COVID-19 illness from a hospital in London. Reference Seow, Graham and Merrick14,Reference Wajnberg, Amanat and Firpo15 SARS-CoV-2 IgG values remained positive for at least 2 months among London cohort individuals and for at least 5 months among New York City cohort individuals. Dan et al Reference Dan, Mateus and Kato16 described a subset of patients with SARS-CoV-2 infection cared for at multiple locations in the United States, of whom 36 (90%) of 40 were seropositive 6–8 months after documented infection.
These findings need to be interpreted in the context of limitations. First, preferential enrollment of participants with direct patient-care responsibilities at the start of the study may have led to selection bias for a final cohort inclusive of higher-risk participants. Second, seroprevalence estimates among subgroups (eg, race categories, age groups, and employee types) are limited by small numbers of participants. Third, these findings may not be generalizable to other institutions in different locations. The multiple surges of SARS-CoV-2 in the Philadelphia region during the study period suggest that our employees were at risk for exposure, but exposure risk would differ by community and employment location. Fourth, our assays detected SARS-CoV-2 seropositivity in 72.1% of participants self-reporting previous positive PCR. It is possible that some participants reported positive PCR results in error. SARS-CoV-2–infected participants may have had less severe illness, resulting in lower seroconversion rates. Reference Seow, Graham and Merrick14 Finally, the statistical associations identified from multivariable analysis should be considered in the context of a post hoc analysis without a priori hypotheses.
In summary, the SARS-CoV-2 seroprevalence among employees at a large pediatric academic center remained below point-prevalence rates reported in the surrounding community. Specific factors, such as provision of direct patient care, Black race, and exposure to a confirmed SARS-CoV-2 person in a nonhealthcare setting conferred an increased risk of seropositivity. Antibody response appears to be durable for at least 6 months, consistent with recent studies demonstrating persistent antibody presence.
Acknowledgments
We thank Mary Kate Abbadessa, Tevin Carrington, Samantha Hanley, Ellen Kratz, Emma Keeler, Scarlett O’Hara, and Valerie McGoldrick for their contributions to enrolling and following participants. We also thank the leadership of the Research Institute at the Children’s Hospital of Philadelphia for providing the resources to perform this study.
Financial support
This work was supported in part by funding from the NIH/National Center for Advancing Translational Sciences (grant no. UL1TR001878). Elizabeth Anderson was supported by the NIH Training in Virology T32 Program (grant no. T32-AI-007324). Audrey R. Odom John and Scott E. Hensley are investigators in the Pathogenesis of Infectious Diseases (PATH) of the Burroughs Wellcome Fund. The funders had no role in in the design or conduct of the study.
Conflicts of interest
Brian Fisher reports that his institution receives funding from Merck and Pfizer for research studies. He serves on a Data Safety Monitoring Committee for Astellas. These studies are not related to this project. Scott Hensley reports consultancy fees from Sanofi Pasteur, Lumen, Novavax, and Merck for work unrelated to this report. The other authors have no conflicts of interest to disclose.