1 Introduction
Authorship analysis (AA) is a useful tool for a variety of attribution purposes, including criminal investigations, plagiarism detection and resolving authorship disputes. One method of performing AA is to develop writing profiles, where an attempt is made to determine characteristics that identify writings by an author, with a view to identifying if any other documents in a sample were written by the same author. The methods of developing and using profiles differ widely in the literature. In this paper, a new method for developing profiles is created using the concept of a language default, i.e. the expected value of a feature in the language the document was written in.
Profiles are then calculated using the distance between documents and a given author. Ideally, this distance should be low when there is a high likelihood that the document was written by the author, and the distance should be high when authorship is unlikely. These distances are then used to select the most likely author from a set of candidate authors.
1.1 Research questions
In this paper, the motivation for developing the recentred local profiles (RLP) method is derived from the literature, using the concept of a language default value for features. This method uses global knowledge about an authorship problem to improve classification accuracy over related methods. Two versions of the algorithm are tested to compare the classification performance against related algorithms, leading us to ask two key research questions:
(1) Does the RLP algorithm proposed in Section 3, using local n-gram models, improve classification performance over other local n-gram techniques in the literature?
(2) Does the RLP algorithm proposed in Section 3, using a feature-based model, improve classification performance over existing methods outlined in the literature?
These research questions are answered empirically using a standardised multilingual corpus.
The paper is structured as follows. Section 2 contains a review of the related literature in AA. The concept of RLP is derived from the literature in Section 3. The research questions are then addressed using a methodology presented in Section 4, and the results are given in Section 5. These results are discussed in Section 6 and are then further enhanced using an ensemble method in Section 7. Conclusions from the results are given in Section 8, followed by some future avenues for further work in this area.
2 Authorship analysis
Authorship analysis has its roots in stylometry and has progressed to more complex methods, as available computational resources have expanded. Manually counting properties of text, such as mean sentence length, were one of the first scientific endeavours in AA (Yule Reference Yule1939), before the ‘arrival of modern statistics made it possible to investigate questions of authorship in a more sophisticated fashion’ (Juola Reference Juola2008). The rise of machine learning has led to an increased use of these techniques in recent AA, accounting for a large proportion of work in the field (Stamatatos Reference Stamatatos2009). Machine learning techniques have increased the complexity, and also the quality of AA methods, compared to earlier methods.
2.1 Authorship attribution
Authorship attribution is the most common example of AA in the literature. This subfield is focused on the supervised learning of a model that can determine the authorship of a document, where the authorship of a set of training documents is available, and the author of the document is from the set of known authors. The original dataset used for training must be labelled by authorship first, and the analysis phase of the algorithm then uses these labels to develop a model that separates the documents based on authorship. From the Federalist papers (Mosteller and Wallace Reference Mosteller and Wallace1963), to more recent work on determining authorship of Dutch student essays (van Halteren et al. Reference van Halteren, Baayen, Tweedie, Haverkort and Neijt2005), there has been a large amount of successful work performed in authorship attribution. Authorship attribution has also been utilised in criminal trials in the USA (Chaski Reference Chaski2005).
Standard machine learning methods are often used in modern authorship attribution, such as nearest neighbour algorithm or support vector machines, to learn a model once an appropriate representation for the dataset has been chosen. For this reason, most of the work in AA focuses on finding appropriate representations of the datasets (see Raghavan, Kovashka amd Mooney Reference Raghavan, Kovashka and Mooney2010). The method of representing a corpus for use in machine learning algorithms is considered the most important part of an AA study. This aspect of AA is outlined in the Section 2.2.
2.2 Data representations
As authorship attribution is typically focused on the analysis of natural language in texts, machine learning algorithms need the data to be represented in some numerical form. The main goal of this stage is to calculate the distance between documents, allowing machine learning algorithms to use this distance to populate models from the data. Current methods focus on the extraction of features from documents and then compare scores on each feature. An example of a standard feature is the mean word length. For this feature, the mean word length of each author's writings would be calculated and would then form part of a larger dataset. A document with a similar mean word length to a given author would be considered more likely to be written by that author compared to other authors. In the literature, there are two main methods of extracting features: static features and dynamics features. Static features are chosen before training begins, while dynamic features are chosen as part of the learning process. An example of using dynamic features would be to take the top 50 words in a corpus, and use the frequency of each to create a dataset.
Using static features have been the predominant method for authorship attribution until only very recently. Over 1,000 static features had been suggested in the literature by 1997 (Rudman Reference Rudman1997), and this work makes no attempt to test all and each combination of features. Zheng et al. (Reference Zheng, Li, Chen and Huang2006) summarised the huge number of features into four subsets; character, word, syntactic and structural features. It was found that all four subsets contained information that increased the accuracy of an authorship attribution model. However, not all combinations of subsets were tested, making it possible that subsets of features exist that contain better information than the full set.
Dynamic-feature-based representations have recently emerged as a better alternative than static methods for AA. A large number of models for choosing features have been suggested in the literature for AA of different forms, with varying degrees of success. These models include using a bag-of-words model (Layton and Watters Reference Layton and Watters2009) and using n-grams (Frantzeskou et al. Reference Frantzeskou, Stamatatos, Gritzalis and Chaski2007). Character-level n-grams have enjoyed high levels of success in the literature, and will be detailed further in this work, described in Sections 2.5 and 2.6.
Once the data have been represented in a way that can generate distances between documents in an effective manner, analysis of these representations can begin. The next four subsections outline popular methods of data representation methods for AA, including feature-based representations, and character-level n-grams both at a Global and Local levels.
2.3 Static features
As noted earlier, the work of Zheng et al. (Reference Zheng, Li, Chen and Huang2006) summarised the literature's large number of authorship features into four subsets of features based on different attributes of text: lexical features, syntactic features, structural features and content specific features. Lexical features can be further split into two categories: character-based features and word-based features. These representations of text were developed to identify which subsets of features would be more reliable in determining authorship in a supervised learning environment. All feature sets were found to add some information, as the collection of all four feature subsets was the most accurate one, after applying a series of supervised learning algorithms to the resulting dataset. Not all groups of the subset combinations were used in the testing, which leaves open the possibility that a better group of these subsets may be achievable. The feature list, summarised from Zheng et al. (Reference Zheng, Li, Chen and Huang2006), is given below with lexical features split into character- and word-based features.
2.3.1 Character features
The first of these subsets of features considers a document to be a series of characters. Features include a count of each individual character, as well as the proportion of certain classes of characters, such as alphanumeric or upper-case letters used.
• Total number of characters.
• Proportion of alphabetic characters in document.
• Proportion of upper-case letters.
• Proportion of digit characters.
• Proportion of white space characters.
• Proportion of specifically tab characters (\t).
• Frequency of each distinct character that appears in all documents.
• Frequency of each character in {
 }.

2.3.2 Word features
The second subset of features takes a document to be a series of words in sentences and include statistics on the sizes of words and vocabulary richness metrics, such as Yule's K measure (Yule Reference Yule1939).
These features are as follows:
• total number of words,
• proportion of short words (less than four characters),
• proportion of characters used within words (as opposed to punctuation),
• mean word length,
• mean sentence length by number of characters,
• mean sentence length by number of words,
• ratio of number of distinct words to the total number of words:
|set(words)|/|words|,
• number of hapax legomena (words that occur once only),
• number of hapax dislegomena (words that occur exactly twice),
• Yule's K measure (Yule Reference Yule1939),
• Simpson's D measure (Simpson Reference Simpson1949),
• Sichel's S measure (Sichel Reference Sichel1975),
• Brunet's W measure (Brunet Reference Brunet1978),
• Honore's R measure (Honor Reference Honoré1979),
• proportion of words of each length from 1 to 19 inclusive,
• proportion of words of length more than or equal to 20.
2.3.3 Syntactic features
The third subset of features is syntactic features counting the punctuation marks and the frequency of certain function words.
These features are as follows:
• frequency of each punctuation mark in {,.?!:;'"},
• frequency of function words as listed in the Appendix of Zheng et al. (Reference Zheng, Li, Chen and Huang2006). Examples include which, that and among.
2.3.4 Structural features
The fourth and final subset of features in the feature subsets are the structural features derived from how text is structured. Note that the last three points refer specifically to email-based authorship attribution, as this was the application domain given in Zheng et al. (Reference Zheng, Li, Chen and Huang2006).
The features used are as follows:
• total number of lines,
• total number of sentences,
• total number of paragraphs,
• number of sentences per paragraph,
• number of characters per paragraph,
• number of words per paragraph,
• use email as signature,
• use telephone as signature,
• use URL as signature.
2.3.5 Content-specific features
Content-specific features were also given in Zheng et al. (Reference Zheng, Li, Chen and Huang2006), being the frequency of content specific keywords to the email authorship application that was presented. These features present an expert-knowledge-driven feature selection, which improved the accuracy of the final models derived by Zheng et al. (Reference Zheng, Li, Chen and Huang2006).
2.3.6 Feature subset attributes
All of the features above are numerical, allowing for the calculation of distances between documents to occur, once its feature-based representation has been derived by considering the values of each feature as an element in a vector. Documents are then mapped onto a vector space, and distances can be calculated using any standard vector space distance metric. Examples include the Euclidean, Manhattan, Chebyshev and Cosine distance metrics although there are many more in the literature. Vector space modelling is an important abstraction in machine learning and forms the feature representation basis in many machine learning methods. The ability to map authorship features to a vector space has enabled a large range of machine learning algorithms, such as support vector machines, to be used in AA studies.
2.4 Dynamic features using n-grams
An important modelling concept for dynamic features is to consider a document as a series of overlapping subsequence of tokens, called n-grams. In authorship, a document can be considered as a sequence of characters, words, sentences or even paragraphs. A character-based n-gram considers a document as a series of overlapping sequential subsets of characters. Token-based n-grams can capture not only the information found at the token level, but can also find information relating to higher level tokens.
One common application of n-grams in AA is to use character-level n-grams (Kešelj et al. Reference Kešelj, Peng, Cercone and Thomas2003; Frantzeskou et al. Reference Frantzeskou, Stamatatos, Gritzalis and Chaski2007)Footnote 1. Character-level n-grams provide information at the character level, as well as word and sentence information. As an example of syntactic information gained, the high appearance of the exclamation mark (!) shows an informal text, as this rarely appears in formal writing. Another example is structural information that can be retrieved, particularly from formatting text, such as in a HTML document. The high use of <BR> as opposed to </P> when formatting text indicates a stylistic choice made by the author.
There are two main methods of capturing character-level n-grams that are explored in the literature: global and local. Global n-grams calculate the distribution of the most frequent n-grams over the entire training set, often referred to as a bag-of-n-grams. The term ‘Global n-grams’ is used to clarify the distinction between those and Local n-grams. Local n-grams are a more recent application of n-grams for authorship attribution in which an author's writing style is profiled using features specific to that author. Both global and local n-grams are often used as dynamically derived models, and these two types of n-gram models are detailed in the following two subsections.
2.5 Global n-grams
Representing text using n-grams has been a popular technique for many years (Cavnar Reference Cavnar1975) as it is robust against minor variations in text, such as typographical errors, and also does not require document preprocessing, such as word stemming. Representing text using character-level n-grams has become increasingly popular in more recent literature (Koppel, Schler and Argamon Reference Koppel, Schler and Argamon2009) due to its combination of both character-level and word-level representations. Taking English as an example, four-letter n-grams comprise a large proportion of the words contained in English as separate n-grams, as well as covering formatting, such as the use of double spacing, and the specific use of formatting characters, such as using double spacing between sentences. The use of n-grams also allows for the collection of a larger number of features for smaller texts, as (|d| − n + 1) n-grams will be extracted for a document d of character length |d|. This increase in the amount of data extracted from short documents has proven to be a successful technique (Koppel et al. Reference Koppel, Schler and Argamon2009).
The Global n-grams methodology first examines the entire dataset to determine the subset of n-grams to use for document representation. In practice, collecting all n-grams results in many n-grams that are only used rarely, and add noise to the dataset. A final, shorter list is created by selecting the L most frequently occurring n-grams for the entire dataset. The representation of the corpus is then given by collecting the frequency of each n-gram in this shorter list for each document in the training set. This provides a point in a vector space that can be used to calculate distances between documents, and distance can then be calculated using any of the previously mentioned distance metrics for vector spaces.
2.6 Local n-grams
The Local n-grams methodology is based on a concept of an ‘author profile’, which is ‘the set of the L most frequent n-grams with their normalised frequencies’ (Kešelj et al. Reference Kešelj, Peng, Cercone and Thomas2003), for a given author. From these author profiles, two methods in the literature exist for determining the distance between two profiles for authors A 1 and A 2. They are the common n-grams (CNG) method (Kešelj et al. Reference Kešelj, Peng, Cercone and Thomas2003) and source code author profiling (SCAP) method (Frantzeskou et al. Reference Frantzeskou, Stamatatos, Gritzalis and Katsikas2006, Reference Frantzeskou, Stamatatos, Gritzalis and Chaski2007).
The CNG method uses the relative distance between two document profiles or author profiles, which is a summation over the distance between usage of each n-gram used by each profile. The frequencies for the L most frequently occurring n-grams are compared using (1), to determine a distance between the two profiles (Kešelj et al. Reference Kešelj, Peng, Cercone and Thomas2003)
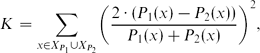
where Pi(x) is the frequency of term x in profile Pi and XPi is the set of all n-grams occurring in profile Pi.
The SCAP method uses the simplified profile intersection similarity metric, which ignores the frequencies, and instead uses only the set of the L most frequently occurring n-grams. Simplified profile intersection finds the size of the intersection of the two sets of n-grams, normalised by dividing the result by L (Frantzeskou et al. Reference Frantzeskou, Stamatatos, Gritzalis and Katsikas2006). This provides a similarity measure S between two profiles P 1 and P 2, which is subsequently converted to a distance metric DS using the equation  . The SCAP method is comparable in accuracy to the CNG method, despite the much lower computational cost (Frantzeskou et al. Reference Frantzeskou, Stamatatos, Gritzalis and Chaski2007). Both of these methods have been shown to be very effective in different areas. For example, SCAP was used for authorship attribution of Twitter messages, to achieve a very high accuracy with 50 authors in a difficult domain (Layton, Watters and Dazeley Reference Layton, Watters and Dazeley2010).
2.7 The Ad-hoc authorship attribution competition
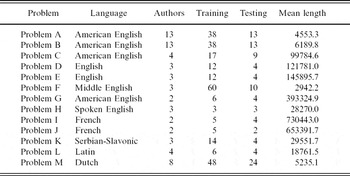
One issue that has been identified in the literature is the lack of meaningful benchmark tests for AA (Juola Reference Juola2004). A series of 13 authorship problems of a variety of types were collected and formed a corpus to overcome this limitation, to enable the direct comparison of different authorship attribution methods (Juola Reference Juola2008). An overview of each problem is given in Table 1. A competition, named the ad-hoc authorship attribution competition (AAAC), was run as part of the 2004 Joint International Conference of the Association for Literary and Linguistic Computing and the Association for Computers and the Humanities (ALLC/ACH 2004) (Juola Reference Juola2004). The competition attracted 12 teams, with the winner of the competition achieving an accuracy of 70.6%. Detailed results and a discussion of the competition are available in Juola (Reference Juola2008).
Description of each problem in the AAAC Corpus. Final column is the mean number of characters per document in each problem

The AAAC corpus is predominantly English, with eight of the problems being in some form of English (American English, British English, Middle English and Spoken English). The problems overall represent a wide variety of languages, but do have a strong focus on languages derived from Europe. There are no Asian, Arabic or African languages in the corpus. Their exclusion is problematic, since languages often have quite different concepts for language features, such as word boundaries, sentences and characters. One example of this structural difference is in Chinese text, where word boundaries are less defined than the languages contained in this corpus (Li and Sun Reference Li and Sun2009). Analysis of these languages is considered outside the scope of this paper, but should be considered in future work in this area.
3 Recentred local profile derivation
This paper proposes a new method for calculating distance, derived from the method used in Kešelj et al. (Reference Kešelj, Peng, Cercone and Thomas2003). Rather than remove the concept of a language profile, the proposed method uses the language profile in the calculation of distance between an author and document. The candidate author with the smallest distance to a document of unknown authorship is considered the most likely to be the true author. This chapter outlines the steps taken to derive the proposed method, named RLP.
In their work on authorship attribution, Kešelj et al. (Reference Kešelj, Peng, Cercone and Thomas2003) cite the following equation from Bennett (Reference Bennett1976) to calculate the distance between authors or documents M and N

where E is given as the ‘standard English’ model. M(I, J), N(I, J) returns the normalised frequency for models M and N, respectively, for the character bi-gram composed of the Ith and Jth letters of the alphabet. I and J are iterated over all possible values between 1 and 26 inclusive. It is argued that E is an obviously language-dependent feature, and is dropped to form the simpler equation

Kešelj et al. (Reference Kešelj, Peng, Cercone and Thomas2003), giving f 1 and f 2 as their profiles and fi(n) to be the normalised frequency of the n-gram n, derive the following equation, the relative distance metric described in Section 2.6, from (3) (Kešelj et al. Reference Kešelj, Peng, Cercone and Thomas2003)

which is similar to (3), except that it is now normalised by dividing by the mean of f 1(n) and f 2(n). The term profile in (4) is defined as the union of the L most frequently occurring n-grams in both f 1 and f 2. These profiles are referred to as local profiles, since they are derived locally, without any global knowledge of the rest of the training set of documents. While this method has been shown to be effective in authorship attribution studies, the score for the AAAC corpus was 68.9%, indicating potential for improvement.
We propose that rather than remove the concept of a language profile, the following equation can be derived from (2) using such a profile

Normalising by the absolute distance of the variation between each profile and the standardised English profile gives the distance metric

Note that (6) is the cosine distance between the recentred profile counts. This choice of normalisation method is not mandatory, and other normalisation methods may be shown in the future to be more effective.
One problem with the above equation is the existence of a standardised profile of language for a set of documents. Given the varied nature of a single language, the varied nature of different languages and the varied nature of the use of language by an author for different tasks, it seems improbable that a standardised profile of a language can be created that would be applicable to a given authorship problem. It remains a possibility, but is considered a problem outside the scope of this paper. Instead, we use the entire training set as an approximation to the language profile. This has a benefit of working for different languages without changing the algorithm: the standardised language profile is approximated by finding the normalised mean usage of each feature within the training set of documents.
From (6), the concept of a profile is created in much the same way as it is for the CNG method. However, as (6) is concerned with the distance from corpus profile, this is used as our ranking criterion. Therefore, a document or author profile f 1 is given as the top L features, ranked by absolute distance to the language default. Finally, when an n-gram occurs in one profile but not the other, the true value is used, not a default value of 0 as used by Kešelj et al. (Reference Kešelj, Peng, Cercone and Thomas2003). The combination of the above definition of an author or document profile with (6) as the distance metric will be referred to as RLP.


The RLP algorithm differs from CNG in three key areas. First, the algorithm that accompanies this equation differs slightly in that if an n-gram is not in the top L n-grams for the other profile, its value in the equation is 0, not the actual value within the document. Second, using the concept of a language default would compare documents with extra information about expected values, rather than comparing them absolutely. If two documents share a similar value for a given n-gram, but both are very different from the expected value for the language, this is a more surprising result than if the values were similar to the expected value for that language. Third, since features will be compared against the expected value, negative values for features are possible if a feature is actually used much less than expected. For this reason, a profile – of either a document or author – is made of the L most distinctive feature, rather then the L most frequently used features. In Section 4, the experimental methodology for testing the effectiveness of RLP compared to other methods is given.
4 Experimental methodology
The results of two sets of experiments are reported in this paper, corresponding to the research questions proposed in Section 1.1. First, RLP using n-grams was compared against both the CNG and SCAP methods from the literature, detailed in Section 2.6. Second, RLP using features described in Section 2.3 was compared against using each of the possible combinations of the subsets described in the literature. Both sets of experiments were run using the AAAC corpus described in Section 2.7. Together, these experiments were used to determine if the RLP method improved classification accuracy against related experiments.
For the n-gram experiment, RLP was compared to both Local n-gram metrics defined in Section 2.6, CNG and SCAP. Documents from the testing set were assigned to the author with the lowest mean distance to each document that the author was known to have authored in the training set. Parameter values chosen were n between 2 and 5 inclusive and L was chosen for values 50, 100, 500, 1,000, 2,000, 3,000 and 5,000. These ranges were chosen to provide good coverage over the range of values shown in the literature. Other tests performed by the authors show little variation at values above the upper limits and between the chosen L values.
For the feature-based RLP experiment, RLP was compared to combinations of predefined subsets. The subsets were the four main subsets described in Section 2.3; Character, Word, Syntactic and Structural. Each of the 15 combinations was tested for both RLP and non-RLP tests. For the non-RLP test, distance between feature values was calculated using three distance metrics: Euclidean, Cosine and Correlation distance. For the RLP test, as there were 251 features extracted from the corpus, the L values ranged between 20 and 200 in steps of 20.Footnote 2 The distance metric for the RLP test was the best performing metric in the non-RLP test. Not all subset combinations had enough features for each L value (e.g. the structural subset has only six features for this corpus), and therefore, there were different upper limits for some combinations.
Results were compared using classification accuracy using a ‘nearest author’ classification in which a document was assigned to the author closest to it. The distance between a document and author was calculated as the mean distance between a document, and each of the documents known to be from that author. Further to this, the results were compared against the results from the AAAC as listed in Juola (Reference Juola2008).
As a final step to the methodology, we used a blending ensemble to combine the parameter sets for RLP. For each dataset, the training set was split by removing one document and training the model. The model was then tested to see if it accurately attributed the removed document. This was run for each document in the training set, and the parameter set was scored using the mean accuracy of this approach across each excluded document. The top five scoring parameters were then ensembled using the weighted voting approach employed by Kešelj and Cercone (Reference Kešelj, Cercone and Joula2004). In this ensemble, a document was classified according to the nearest author method above for each of the parameter sets that were part of the ensemble. Each classification was weighted by the ratio between the distances to the second closest and closest author using this method. As an example, if a document was closest to Author A with a distance of 0.4, and Author C was the next nearest author with a distance of 0.9, the weight would be  . The author with the highest combined weighted vote was chosen as the prediction by the ensemble.
5 Results
5.1 n-gram results
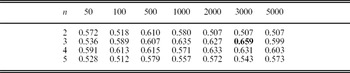
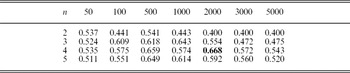
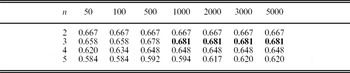
Tables 2 and 3 show the classification accuracies for using both the CNG and SCAP methods on the AAAC corpus for the full range of parameter values for n and L. The corresponding accuracies using RLP are given in Table 4. The highest accuracy obtained for CNG was 0.659 when n = 3 and L = 3000, while SCAP achieved 0.668 when n = 4 and L = 2000. The highest accuracy for RLP was 0.681 for n = 3 for L ≥ 1000. Results showed few overall trends, with high results appearing for a variety of combinations of n and L for each of the three algorithms. One trend that was consistent was that RLP scored higher, not only overall, but with fewer features than either CNG or SCAP.
Mean classification accuracy on the AAAC corpus using the CNG methodology

Mean classification accuracy on the AAAC corpus using the SCAP methodology

Mean classification accuracy on the AAAC corpus using the RLP methodology

5.2 Feature-based results
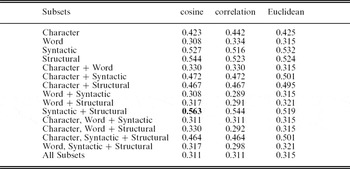
Table 5 contains the results from each of the 15 combinations of the four feature subsets described in Section 2.3. It can be seen that the word subset provided a negative effect on the results, with the syntactic and structural subsets providing a positive effect. The highest accuracy noted was 0.563 for the Syntactic and Structural subset combination, using the cosine distance. The Euclidean distance had the highest mean accuracy of the three metrics, with 0.402 compared to 0.399 and 0.392 for cosine and correlation, respectively. However, the median was lower with accuracies of 0.321, 0.330 and 0.334 for Euclidean, cosine and correlation, in that order.
Mean classification accuracy on the AAAC corpus using feature subsets for different distance metrics

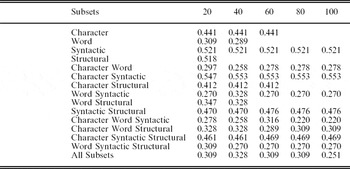
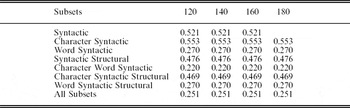
Tables 6 and 7 give the corresponding results using RLP for profile creation.Footnote 3 Overall, we found that profile sizes above 100 did not affect the results. The mean for L = 20 was the highest of each of the values chosen, which was significantly higher than for L ≥ 100 (p-value of 0.013), but not for L = 60 (p-value of 0.16).
Mean classification accuracy on the AAAC corpus using feature subsets for different distance metrics

Mean classification accuracy on the AAAC corpus using feature subsets for values of L ≥ 120 using RLP

The highest score reported was 0.553 for L ≥ 40, using the Character and Syntactic combination. It is interesting that this combination outperformed the Syntactic and Structural combination, which was clearly the better combination without RLP. This indicates that RLP works well for character-based features, which includes the Character feature subset and character-level n-grams. Further evidence for this can be found in the higher score when using the Character subset only with RLP, compared to without RLP (0.441 compared to 0.423). Each other subset, by itself, was either comparable, or was lower with RLP (Word: +0.001, Syntactic: −0.006, Structural: −0.026).
6 Discussion
The results presented in this paper indicate that RLP works effectively for Local n-gram models and/or character-based subsets. The best accuracy obtained using a single parameter set for RLP using Local n-grams was 0.681. This would place the algorithm, with its simple ‘nearest author’ classification algorithm, and using a single metric, third in the AAACFootnote 4 behind Koppel and Schler's method (Koppel, Akiva and Dagan Reference Koppel, Akiva and Dagan2006) and behind Kešelj and Cercone's method (Kešelj and Cercone Reference Kešelj, Cercone and Joula2004). The authors are confident that a more robust classification algorithm could boost the score further, which would be part of future work in this area.
Across the parameters chosen, the RLP had the highest mean and lowest variance, 0.646 and 0.001, respectively, compared to CNG (μ = 0.578, σ2 = 0.002) and SCAP (μ = 0.542, σ2 = 0.006). This result is statistically significant, with RLP scoring higher than CNG and SCAP, with p-values of less than 0.001. The low variance shows stability in the results across variations in parameters, suggesting that the technique may be able to be performed in a variety of settings with little customisation to the task. As an example, classification on a new language may benefit from this relative stability, as the selection of parameters has less of an impact on the performance of the algorithm.
More evidence suggesting the robustness of RLP compared to CNG and SCAP can be observed through the change in accuracy as L increases. For each value of n, the accuracy improved at a decreasing rate as the value of L was increased. This suggests that due to the ranking of features by distinctiveness, adding features return reduced results. This contrasts to both CNG and SCAP where adding features, ranked by frequency, can affect the accuracy either positively or negatively with little pattern. This makes RLP much more stable as L values change and monotonically increasing with increasing L values.
In general, RLP scored lower than type-based subsets for feature-based datasets, for most subset combinations. However, it was shown that Character features improved with RLP, indicating that character features, in general, improve using RLP. One possible future avenue of this work would be to incorporate RLP-based adjustments, for only some of the features in a model.
A side result from this research is that using n-grams was shown to be better for authorship attribution in this context than a feature-based model. The highest accuracy for a feature-based RLP was 0.553 compared to 0.681 for n-gram-based RLP. For non-RLP methods, the highest feature-based accuracy was 0.563, while the highest n-gram accuracy was 0.662, a clear margin.
7 Ensemble results using weighted voting
As a final step for the experiments, weighted voting was applied to the n-gram version of RLP to boost the accuracy, based on the ensemble used Kešelj and Cercone (Reference Kešelj, Cercone and Joula2004) using CNG. The method was extended by using the accuracy of the parameters in determining a held-in dataset with the training set, as described in Section 4. All parameter values were selected.
Each guess from each set of parameters was weighted according to the formula w = 1 − a/b, where a was the distance from a document to the nearest author (the guessed author), and b was the distance to the second nearest author. Higher weights were given to guesses where the distance to the nearest author was much less than the second nearest author. Using the weighted voting method, Kešelj and Cercone (Reference Kešelj, Cercone and Joula2004) achieved a mean accuracy of 0.689 on the AAAC corpus, giving the target rate to beat using RLP.
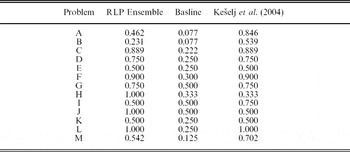
Using the above method, an overall accuracy of 0.694 was achieved on the AAAC corpus. The performance on each problem of the resulting method is given in Table 8. This result would have placed RLP in second place in the AAAC behind Koppel and Schler's method, which used a much more involved technique described in Koppel et al. (Reference Koppel, Akiva and Dagan2006). The gap is only 0.8 percentage points, leaving open the possibility that other ensemble techniques may be able to improve the results above this mark.
Classification accuracy on the AAAC corpus using RLP with weighted voting as described in Section 7

The improvement from using RLP to CNG in the ensemble was not statistically significant, with a p-value of 0.91. Despite the much higher mean score for individual parameters, the ensemble was unable to adequately combine them to form a better classifier. The reason for this is that the variation in RLP was very low, with different parameter values scoring very similar and making similar predictions. It is well known in machine learning that diversity increases ensemble performance Kuncheva and Whitaker (Reference Kuncheva and Whitaker2003), suggesting that the lack of diversity in RLP results may be an issue when ensembling. Without variation, an ensemble can do little to increase the classification results.
The RLP ensemble performed as well as – or better than – the CNG ensemble for 9 of the 13 problems. It performed better for three of the problems, but worse for four. The problems that it performed poorly on were considered difficult problems by the creator of the dataset; A, B, I and M. With the exception of problem I, the other three problems had the highest number of authors, suggesting that the RLP method – at least under the given ensemble – may perform better for a fewer number of candidate authors. This can been seen through the methods that RLP outperformed CNG; C, H and J. These problems had fewer authors, as did the other problems in which results were the same. This provides further evidence for this claim.
8 Conclusions
Two research questions were posed at the beginning of this article relating to the use of corpus wide information to create locally aware profiles of documents for authorship attribution. The RLP method was derived in Section 3 and tested using classification accuracy on the AAAC corpus with the methodology given in Section 4.
RLP was shown to improve the classification accuracy results of local n-gram-based profiles, compared against both the CNG and SCAP methods. RLP using a single set of parameters was able to compete with CNG using weighted voting in the AAAC, and improved this accuracy when weighted voting was applied to RLP. The results from the RLP algorithm had a low variance in results, as parameter values changed, indicating high stability in the algorithm. Importantly, the accuracy using RLP improved monotonically with increasing L values with decreasing improvements as L increases. This suggests that the order of n-grams created by the RLP method is accurately ranking more discriminating n-grams above those that are less discriminating.
With one exception, RLP was shown to perform as well as – or better than – CNG, when the dataset contained few authors. RLP also performed better overall for the entire corpus; however, this increase was not statistically significant. RLP was also shown to perform generally more poorly for feature-based models. However, it was discovered that character-based features improved when using RLP.
Overall, the results indicate that using global knowledge about the corpus can improve classification accuracy for authorship attribution for n-gram-based models and character-based feature models. The original method used a concept of a language profile, but this is approximated using a profile of the training corpus.
8.1 Future work
It was noted in Section 3 that the specific method of normalisation used is not a requirement. Other methods for calculating the distance between profiles could be used, such as statistical comparisons of some kind, or even other distance metrics, in the same way that the cosine distance was used indirectly here. The testing of other metrics could be compared using the same methodology as presented in this paper.
It was noted in the discussion that RLP improved the performance of character-based features and that it may be possible to use an RLP-based method to improve the performance of only some of a set of features. Other features may be treated without RLP, leading to a merging of two methods, i.e. combining the strengths of both algorithms.
Finally, an examination of the detailed results showed that an accuracy of 81.18% was possible by simply choosing the parameter values best suited to the language of the corpus. If the results were taken from any of the n-gram methods used in this paper (including SCAP and CNG), then this result increased to 88.6% accuracy. This result improves significantly upon those scored in the AAAC; however, these results rely heavily on hindsight. The parameter values were chosen because they had the highest accuracy on each problem in the AAAC corpus. However, if a larger scale study of different languages could show stability in the values for n and L, then these choices would be justified. This would result in a language-dependent parameter set, removing the problems with trying to find a method that works with the same parameters for wildly different languages.
Acknowledgement
This research was conducted at the Internet Commerce Security Laboratory and was funded by the State Government of Victoria, IBM, Westpac, the Australian Federal Police and the University of Ballarat. More information can be found at http://www.icsl.com.au