PREAMBLE
When we wrote the first draft of this paper in 1993, structural vector autoregressions (SVARs) for studying monetary policy were less common than they are now; single-equation or narrative approaches had been the dominant approach. This paper employed an identified VAR model, allowing for simultaneity, and included discussion of how its identifying assumptions could be linked to a complete equilibrium model. (The dynamic stochastic general equilibrium [DSGE] model was not present in the 1993 draft but was there in 1996.) On the basis of the DSGE analysis, we were critical of some existing identification assumptions in the SVAR literature. The key conclusion of our analysis is that most variation in policy variables, such as the interest rate and money growth, reflects the systematic part of monetary policy in response to the changing state of the economy. The real effect of unpredicted policy shifts is much smaller and less certain than what was at the time commonly believed.
Although some of the empirical work was reproduced by another paper of ours [Leeper, Sims, and Zha (1996)], there are several distinct contributions that have led to further study in the VAR literature:
- We put forward a set of assumptions for identifying monetary policy shocks in a VAR that included money stock and required confronting simultaneity. This identification scheme's basic structure has proven to be robust in producing sensible impulse responses across variables and across countries [e.g., Faust (1998), Kim (1999)].
- This paper was a first attempt at introducing to an identified VAR model commodity prices as an information variable to solve the price puzzle for the impulse responses to monetary policy shocks. Including this variable in an identified VAR has now been a common practice [Christiano, Eichenbaum, and Evans (1999), Hanson (2004)]. This paper goes farther than most others to explain, in a DSGE, why inclusion of such variables is important and justified. The information-variable idea has been extended to variables such as the exchange rate in open-economy studies [Kim and Rubini (2000)] and the interest rate of long-term bonds in term-structure works [Evans and Marshall (1998, 2004)].
- We also show how to assess the economic impact of monetary policy when its systematic component is changed, as long as such a change is viewed as temporary and as a surprise from a viewpoint of private agents. This methodology has been used in a number of applied works [e.g., Bernanke, Gertler, and Watson (1997), Hamilton and Herrera (2004)], although the basic idea is fairly obvious.
- Although the personal bankruptcy variable makes only a modest contribution to the results in this paper, there continues to be research on the connection of personal bankruptcy to business cycles and welfare [Athreya (2002), Chatterjee, Corbae, Nakajima, and Rio-Rull (2002), Li and Sarte (2003)]. We think it still worthwhile to try to connect empirical measures of these effects to complete macro models.
- We displayed the connection between a DSGE model and a structural VAR. The method we used to demonstrate that the “invertibility problem” was not a serious issue within the context of our DSGE has as far as we know not been applied elsewhere in the literature, and we think it should be. The method also deals with the common criticism that the number of “shocks” in the real economy undoubtedly does not match the number of variables modeled in any SVAR. We showed that it is possible to select lists of observable variables in our DSGE that are of the type and length that are used in the SVAR literature and thus to obtain approximately correct identification of monetary policy shocks. This is possible even though there are in fact more shocks in the true structure, many of which cannot be recovered precisely from the observable vector. At the same time, we showed that omitting certain crucial variables from the list of observable variables in the SVAR—particularly the “information variables” in our DSGE model—could undermine identification. These points seem to have been rediscovered recently by some critics of the SVAR literature. There has been considerable recent progress in connecting DSGE and SVAR specifications [e.g., Ingram and Whiteman (1994), Smets and Wouters (2003), Del Negro and Schorfheide (2004), and Fernandez-Villaverde, Rubio-Ramirez, and Sargent (2005)].
On rereading, this paper seems better than we remembered it. Why then did we not submit it for publication?
The first version had much less extensive discussion of identification, and no DSGE model. Although the component of the paper that analyzed the effects of changing the monetary policy rule would have been new, the idea of getting an identification that beats the price puzzle in part by introducing a commodity price variable had been picked up by other empirical VAR papers by the time we got around to revision. We decided to make our paper distinct by considering the VAR-DSGE link more carefully than had been done before. We succeeded in this, we think, but what we thought would be a new “section” of the paper had evolved into essentially an additional paper. Its link to the SVAR component existed but was a bit thin given how big each section of the paper had become. The DSGE model implied that a recursive identification scheme would work for isolating monetary policy, whereas our empirical paper (and considerable subsequent work by us and others) suggests that allowing for simultaneity is essential—perhaps because in reality there is no “information variable” available that is as good a summary of the state as that in our DSGE.
INTRODUCTION
Although many economists have firm views on the subject, the state of the empirical literature attempting to identify the effects of monetary policy leaves the issue far short of resolution. Indeed, one can argue that it is in this arena that the Lucas critique, showing us how curve-fitting of empirical relations among variables can produce spurious menus for policy choice, applies most cleanly, and is most subversive of conventional wisdom. We are by now well aware that the predictive power of financial variables in time-series regressions does not usually have a causal interpretation, and we have models in which interest-rate smoothing monetary policy gives money stock variables the character of a financial variable.1
Sims (1982, 1989) gives simple examples of how rational expectations equilibrium models can imply predictive power for the money stock mimicking what is observed in the data, without any corresponding actual effect of policy on real variables.
A considerable literature has emerged attempting to uncover the effects of monetary policy using parsimoniously restricted multivariate time-series models. The first attempts to do this were in work inspired by Milton Friedman and by him and Anna Schwartz. They documented the strong time-series correlations of monetary aggregates with both output and prices, and then went further to argue that these correlations did not primarily represent passive responses of monetary aggregates to developments in the private sector, but instead mainly the effects of monetary policy shifts on the private sector. They buttressed these claims by showing that the correlations persisted even when attention was focused on changes in monetary aggregates that could not have been predicted from current or immediately preceding developments in the private sector. This amounted to an informal argument that innovations in the monetary aggregates—unforecastable movements in them—were a good approximate measure of monetary policy disturbances.2
Romer and Romer (1989) have isolated dates that they argue represent times of shifts of monetary policy toward tightness, arguing that they are continuing the tradition of Friedman and Schwartz. They focus on isolating periods in which interest rates were raised because of a concern about inflation, however, which conflicts with the Friedman and Schwartz focus on separating autonomous movements in policy from movements in policy induced by business conditions.
Short-term interest rate innovations behave better as indicators of policy shifts than do money stock innovations in some respects,3
Bernanke and Blinder (1992) articulate the argument for taking federal funds rate innovations as policy innovations and support the argument with empirical evidence.
This phenomenon, in data for several countries, was noted in Sims (1992).
Although these recent papers represent progress in a common direction, substantial differences remain in their methods and results. In particular, Gordon and Leeper (1994), Christiano, Eichenbaum, and Evans (1996), and Strongin (1995) estimate large effects of monetary policy innovations on real output, accounting for a substantial fraction of output variance historically. Bernanke and Mihov (1998), Soyoung (1999),5
Kim's results are notable for their uniformity (on this result of weak effects of monetary policy on real variables) across G-7 countries other than the United States.
Bernanke and Mihov (1998) do not emphasize the point that their estimated responses are, like some of ours, toward the low end of the range of what appears in the literature. We discuss the quantititative nature of the comparisons when we discuss our results in detail later.
Although the papers use different lists of variables and different identifying assumptions, they employ one common device in achieving identification—they postulate an “inertial sector” in the economy that responds to monetary policy only with a delay. Bernanke and Blinder (1992), Gordon and Leeper (1994), and Christiano, Eichenbaum, and Evans (1996) emphasize that they are making the variables in the inertial-sector block enter the policy reaction function, so they are a list of variables meant plausibly to affect policy. But in the identification schemes of these three papers, these variables are not just given a contemporaneous effect on policy, they are also denied a contemporaneous response to policy. The papers give less complete arguments for the economic plausibility of absence of contemporaneous responses to policy than for the presence of contemporaneous effects on policy for these variables.
Our paper uses a more complex identification scheme than the others. We are able to avoid the unreasonable assumption that auction market prices like commodity prices—or, in Gordon and Leeper (1994), the long interest rate—have no contemporaneous response to monetary policy. We believe that the inertia assumptions invoked throughout this literature can make sense, but we argue that the usual forms of existing adjustment cost and sticky-price models do not generate stochastic behavior that accords with the assumptions of the VAR literature. We also show that even in the presence of inertia in the private sector, allowing for some channels of immediate response of the private sector to policy shock may be essential to correct identification. We display a structural stochastic equilibrium model in which our VAR identification scheme would produce correct results, whereas those of most other papers in the literature would not. From the perspective of our model, restrictions that would justify the other identification schemes appear unreasonable.
We also include a somewhat different list of variables in our model than most other researchers. We include the producers' price index components for crude materials and intermediate materials, as well as a time series on bankruptcies.7
Although the use of the materials price index was somewhat novel when we began this research, other researchers have discovered the advantages of using this or similar auction-market price variables in these models, so it is by now standard.
We also examined specifications in which M1 replaced M2. Because these results tended to be intermediate between the M2- Tbills results and the TR-FF results (closer to the latter) we do not discuss them in detail.
In most of the identifications we consider, monetary policy disturbances have very weak effects on output, stronger effects on prices. The observed association between high interest rates and subsequent low output is under these interpretations due mainly to the underlying source of inflationary pressure, not to contractionary monetary policy itself.
Note that our finding of weak effects and a minor historical role for monetary policy in generating business cycle fluctuations applies to monetary policy disturbances—that is, to unpredictable variation in monetary policy. The result emerges, in fact, because we find that much of observed variation in monetary policy variables is systematically responsive to the state of the economy, which is what one would expect of any good monetary policy. Our results are consistent with the view that bad monetary policy, quite different from what we have had historically, could produce much greater fluctuations in inflation and possibly at the same time much greater fluctuations in output.
Section 3 lays out the structural model that supports our VAR identification scheme. Following that, we display the empirical model and its implications. Readers familiar with the identified VAR literature can understand results of later sections without reading Section 3. We begin by discussing an explicit behavioral model to emphasize the point that reasoning about identification in VAR models is not different in kind from what is done in the rest of macroeconomics. As more complex identification schemes are introduced into models that start on a foundation of careful reduced-form statistical modeling, more explicit attention to the logic of identification is likely to become essential. VAR modelers, more traditional simultaneous equations modelers, and real business cycle style equilibrium modelers all need to pay more attention to detailed links of theory with the time-series facts.
A MODEL WITH INERTIAL ADJUSTMENT SUBJECT TO UNCONTROLLED SHOCKS
Macroeconomists are used to models that postulate that capital adjusts smoothly to exogenous disturbances and price changes because of “costs of adjustment” and also are used to the notion that prices, at least for some commodities, may be “sticky,” perhaps because of costs of adjustment for prices like those for quantities in investment models. Such costs of adjustment or stickiness would, obviously, justify a claim that the instantaneous reaction of the variables subject to them to monetary policy shifts must be small. The problem with this simple idea is that costs of adjustment for a certain variable imply that all influences on the variable should have small instantaneous effects. In a dynamic model that accounts for the serial correlation in all its variables, the one-step-ahead prediction error in variables with “smooth” paths because of adjustment costs will be small, but the correlation of these prediction errors with the various influences that produce the small prediction errors will not be small. An identification scheme that assumes zero effect of monetary policy on a variable because adjustment costs give the variable a smooth trajectory will fail, because the effects of monetary policy on the variable are likely not to be small relative to the similarly small effects of other variables.
Here we display a model that can account for both the sluggishness of private response to deliberate monetary policy actions and the sharp response of some variables in the private sector to disturbances originating there. The central idea that differs from existing dynamic equilibrium models is the introduction of unobservable choice variables that are subject to costs of rapid adjustment, connected to observable variables by relations—“rules of thumb”—that are subject to stochastic disturbance. Our idea bears some similarity to adding a disturbance to a Phillips curve equation for wage adjustment or to a markup equation for price adjustment. However, in our approach, the corresponding equations are part of the technology facing optimizing agents, and because they involve unobservable variables, they are not estimated directly. Observable dynamics are derived from dynamic optimization, rather than being postulated directly as in the typical Phillips-Curve/markup equation approach. Our idea also is related to the practice of adding “measurement error” stochastic disturbances to stochastic equilibrium model solutions, as in Altug (1989) or Watson (1993), for example. However, we treat the stochastic disturbances in our “rules of thumb” as true economic fluctuation, observable and reacted to by economic agents, not as a statistical fuzz simply obscuring the underlying economic variables as in measurement error approaches.
One motivating example of what we have in mind is labor contracts with seniority lay-off rules, overtime pay provisions, and escalator clauses. Such contracts define patterns in which wages, prices and employment may vary flexibly, but the terms of these contracts are assumed to be kept simple (because complicated contracts are expensive to create and enforce) and suboptimal by a standard that ignores contracting costs. Changing the contracts is possible but absorbs resources—time, thought, maybe strikes. Another motivating example is the existence of markup rules that, in certain lines of business, create automatic links between costs of some inputs and final good prices. These rules also may be suboptimal, and may be costly to change. We argue that for the most part these rules of thumb will connect variables that enter directly and strongly into the cash flows of firms and individuals. They may link output, output prices, input prices, wages, and employment. They are less likely to be connected to interest rates, asset prices, and stocks of assets (including stocks of money).
The model given here has more variables and parameters than most models in the theoretical macro literatures of growth models and of dynamic stochastic general equilibrium (DSGE) models. The extra complexity is not gratuitous. Each nonstandard feature is aimed at bringing the model closer to being useful for interpreting the kind of data and results emerging in the identified VAR literature.9
The model is similar to that in Leeper and Sims (1994), with the following major differences: the addition of the natural resource input, the addition of inventories, the explicit derivation of price and wage adjustment from a menu-cost specification, and the imposition of adjustment costs on rates of change of unobservable choice variables.
(a) Transactions costs in the budget constraint
For the purpose at hand it is obviously essential that the model includes a productive role for real balances, by adding a transactions cost term to the budget constraint. While it is known that money in the budget constraint and “money in the utility function” are in a certain sense equivalent, the equivalence depends on redefining consumption as one passes between specifications. This means the specifications are not truly equivalent in a model to be confronted with data. In addition, though money-in-utility specifications are, probably by historical accident, more common in the literature, they make checking for reasonableness in the implied behavior of transactions costs more difficult.
(b) Adjustment costs for capital
The treatment of consumption goods and investment goods as perfect substitutes—the C + I = Y specification—is well known to leave a model without an “investment function.” Most DSGE modelers have often not found this to be a problem. But it seems essential, if the model is to be capable of producing a dynamic response of output to monetary expansion in which interest rates are driven down first, then output rises, that the model have an investment function. Accordingly, this paper's model specifies a nonlinear transformation curve between consumption and investment.
(c) Raw materials input and prices
The model includes a natural resource input. We want to match behavior of statistical models in which the index of producers' prices of crude materials plays a critical role. Hence, the model must include a corresponding variable.
(d) Price and wage setting subject to stickiness costs
Both sellers of output and sellers of labor are modeled as having market power and costs of rapidly adjusting nominal prices, along the lines of much recent theoretical macro literature [for example, Obstfeld and Rogoff (1995)]. Although monetary policy can have substantial real effects as soon as there is even one sticky nominal variable in the model, we see no strong a priori argument for treating one of the price-wage pair as more sticky than the other. As shown for example by Cho (1993), results can depend sensitively on where stickiness is introduced, and we read the empirical literature on price and wage dynamics as providing no clear support for stickiness in one rather than the other.
(e) No firms
We economize on notation, perhaps at the expense of making the reader's initial encounter with the model more confusing, by having each agent a combination worker-consumer-producer. Each both sells its own labor and buys the labor of others, sells its own product and buys the product of others. By explicitly introducing firms, we could make the equations look more familiar, albeit more numerous, without changing the ultimate character of the model.
(f) Inventories
The only inputs or outputs in the model that can be adjusted without a cost penalty dependent on their rates of change are inventories and consumption. We introduced inventories so as not to leave all the real short-term adjustment focused on consumption, and also because we wanted to allow the model to give a role to temporary gaps between production and sales in business cycle dynamics.10
Because all inputs are treated as “sticky,” this specification implies that output is inertial, whereas consumption is not. Furthermore, consumption rather than output generates transactions costs. These aspects of the specification are probably important to the match of the model to time-series data, and would have to be subject to experimentation were we actually fitting it.
To proceed with the details, we postulate a model with many identical consumer-producers, each of whom maximizes

subject to the constraints below. The interpretation of the variables is as follows:
C: Consumption
C*: Consumption with transactions costs included
[ell ]: labor sold on the market
P: economy-wide price level
M: money stock
V: velocity
S: inventories
I: investment
Y0: purchased output, convertible to investment and consumption goods
y: sold output
Y: economy-wide sold output
p: price at which goods are sold by this agent
Z: stock of natural resources
PZ: price at which natural resources can be sold
N: natural resources used up in production
n: natural resources sold
L: labor input purchased and used in production
W: wage paid for purchased labor input
w: wage at which this agent's labor is sold
B: government bonds held with fixed principal and continuously varying interest rate
H: number of consols held
Q: price of a consol
r: interest rate on B
K: capital
τ: lump sum tax
g: vector of controllable variables—“rule of thumb” parameters
The Greek-letter symbols to the left of some equations below are notation for Lagrange multipliers on these constraints in the agents' optimization problem.


In equilibrium, the government budget constraint is satisfied:

We assume the lump-sum tax rate is set according to the rule

As explained by Leeper (1991), for example, this specification, with κ1>β, makes taxes eventually cover the interest payments on new debt, thereby enforcing strong Ricardian equivalence (no nominal effects, as well as no real effects, from the timing of taxes). The distinction between H and B is introduced only to allow the model to generate both a long rate 1/Q and a short rate r, so we postulate the simple, unrealistic rule that B/H is held constant. This has no effect on any variables in the model solution except B, H and τ, which we do not attempt to match in the data. It is of course in principle interesting to explore non-Ricardian policies in a model (like this one) with nominal stickiness, because nominal effects will become real effects. But we forgo such exploration in this paper.
The model is set up to allow examination of the implications of various forms of the monetary policy reaction function, but for the purposes of this paper we stick to specifications in the following class:

Note that this equation is consistent with a noninflationary steady state in which P=1 and r=β. Because it implies, for κr>0, a positive long-run response of the level of the interest rate to the price level, we may expect from the analysis in Leeper (1991) to find it producing, in conjunction with (14), a determinate price level.11
However, the model is capable of producing solutions in which monetary expansion has such strong positive effects on output that it reduces prices while lowering interest rates. When this happens, monetary policy must lower interest rates in response to price rises in order to produce a unique equilibrium price level. In this paper we consider only a specification in which
.
The exogenous disturbances are given a continuous-time first- order autoregressive specification, that is,

where ρ is a matrix whose eigenvalues have negative real parts and ν is a vector of mutually independent white noise processes.
We will not display the first-order conditions for the private agents' optimization problem in detail, but it is important for us to observe that the model, via the first-order conditions with respect to B and M, generates something like the usual sort of “money demand curve.” The first-order conditions with respect to B and M are


which imply

Because (19) depends on C, I, S and M as well as r, it is not a conventional liquidity preference function. However, so long as transactions costs are small (so that dependence of the equation on S is weak), the fact that I is fixed in the short run makes (19) in the short run depend on P, C, and r the way a conventional money demand equation does. We will see below that the approximation is good enough that conventional “identified VAR” reasoning about restrictions on the money demand equation gives reasonably good results.
To derive the model's implications for stochastic dynamics, we take a linear Taylor expansion of its constraints and Euler equations about its steady state. This is valid locally so long as stochastic disturbances are small. It makes terms depending on variances disappear, and thus results in a certainty-equivalent approximate solution. The model cannot easily be reduced to a small number of equations in a small number of state variables, so systematic multivariate solution methods are required for the resulting linear system. We use a generalization of the ideas in Blanchard and Kahn that avoids their exclusion of models failing certain regularity conditions. Our approach provides, for an arbitrary linear rational expectations model, a solution when one exists, an indication of any nonuniqueness that may be present, and a solution that restricts the properties of the exogenous variables when no true solution exists.12
The methods are described in Sims (2001) and are embodied in matlab and R routines that can be found at http://sims.princeton.edu/yftp/gensys.
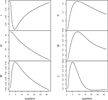
The model's properties vary considerably, from implying hardly any real effects of monetary policy to implying strong effects, as its parameters are varied. Responses of some of its variables to
, the innovation in the monetary policy disturbance
, are shown in Figure 1 for one setting of the parameters, chosen to imply quite a bit of stickiness and nonneutrality. (The parameter settings are listed in the Appendix.) Note that all the usual effects appear: money stock rises, nominal interest rates decline, labor input expands, prices and wages rise. In interpreting the plots, bear in mind that all variables except r and Q are measured in logs. r is measured in natural units (with steady state real interest rate of .05), so if we interpret the scale of the graphs as percentage points, all the units are consistent, except those for Q. The steady state for Q is
. Because the original units of the data are multiplied by 100 for all the other variables, they are also mutliplied by 100 for Q. Thus the rise in Q is .3, from a base value of 20. That is, the (infinitely) long rate 1/Q goes from .05 to 1/20.33 = .0492, a drop of 8 basis points, then starts moving slowly back toward its steady state, while the short rate drops 10 basis points, then falls further to 25 basis points, then returns toward its initial level.

Impulse responses to a monetary policy shock in the theoretical model.
Because this model does not contain bankruptcies, we cannot hope to get it to correspond precisely to the empirical model we discuss later. We can, however, show how identified-VAR analysis of data from this model could lead to correct estimates of the model's structure.13
Here we use “structure” in its original sense in the simultaneous equations literature [e.g., Hurwicz (1962)], as meaning “invariant with respect to a contemplated intervention.” Our contemplated intervention is a disturbance to the monetary policy rule, and the structure we are interested in is the rest of the economy's response to this disturbance.
The algorithm we use to address the first stage proceeds as follows. We postulate an initial covariance matrix representing subjective uncertainty about the full model state vector y. In the calculations reported below this is the identity. We postulate a covariance matrix for the structural innovation process ν, in our calculations here also the identity. We solve the linearized model analytically to get it into the form of a stable first-order autoregression. We construct a standard Kalman filter setup, with the state vector being the complete vector of variables in the structural model, expanded to include also the current values of all 10 structural disturbances. The plant equation is the AR system of the solved structural model, plus dummy equations for the structural disturbances. The observation equation simply maps the variables of the structural model into the list of six observed variables. We then iterate the Kalman filter on this setup until the variances of the structural disturbances stop changing much. The variances so computed are the variances of remaining uncertainty about the structural disturbances after current and past data have been observed and used optimally. Because the structural disturbances are modeled as having unit variance in our calculation, the numbers we display here represent the proportions of variance in the structural disturbances that cannot be eliminated by observation of our six-variable vector of data.14
In all this discussion, we are sliding over the question of conversion from continuous to discrete time. Our calculations involve converting the continuous time model analytically into a first-order discrete time AR at a quarterly time unit, a straightforward calculation. We have, however, treated the covariance matrix of structural disturbances from the discrete version of the model as the identity, when in fact the time aggregation would make it deviate slightly from an identity matrix.
Note that the fiscal shock,
, because the model as parameterized here shows strict Ricardian equivalence, has no effect on the variables taken as observable and hence still has a variance of one after projection on the observed variables. Looking down the diagonal of the matrix in Table 1, we see that several of the structural disturbances cannot be very well reconstructed from the observed data—particularly
,
, and
, each of which retains most of its original unit variance. However, the shocks to monetary policy,
, and transactions technology,
, are reproducible with very high accuracy, despite the fact that, in the case of
, we know from the model structure that it cannot be exactly reconstructed from the observed variable list.

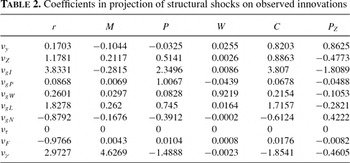
Thus, there is hope that VAR-style identifying restrictions will work to identify monetary policy shocks and thereby the monetary policy reaction function. We turn next to finding the coefficients in projections of the structural shocks on the reduced-form innovations in the observed data. These coefficients, scaled by the standard deviations of the innovations to which they apply (so that the coefficients represent contributions to variance by each innovation in the equation), are displayed in Table 2.

Note first that, despite the fact that the model's true money demand equation involves some variables not included in this system, the system's money demand equation (the last row of Table 2) satisfies the usual zero restrictions for such an equation, with its coefficients on W and PZ small. (The coefficient on PZ is not as small as one would like, and might in practice cause some difficulty.) The coefficients do not come very close to satisfying the homogeneity restriction on the coefficients of M, P, and C that one would expect of an empirical money demand equation, which raises doubts about our having imposed such restrictions in our estimates. The money supply equation (the second to last row) involves only r, and thus a fortiori satisfies any exclusion restrictions that do not involve r. (In this model, taking r innovations to be money supply innovations would turn out to be correct.) The two sluggish variables directly measured, W and P, are involved in equations with little other contemporaneous influence. These are elements of equation (9). The matrix in Table 2 is full rank, so we can think of the equations estimated by an identified VAR procedure as recovering some linear combination of these equations. The money supply and money demand equations would approximately satisfy usual identifying restrictions. The W and P variables, treated as sluggish, not responding contemporaneously to r or M, would generate accurate restrictions. The remaining two equations would be linear combinations of a set of equations that has strong responses to r and PZ. If they were otherwise unrestricted, one of these equations could be normalized to have zero coefficient on r. The resulting system would have enough identifying restrictions to allow recovery of the correct coefficients in the money supply and demand equations, and would be approximately of the form we have estimated from data in the later sections of this paper.
Note, however, that it was essential to this scheme to recognize that some variables in the system other than M do react contemporaneously to r. The only subset of the variables that could correctly be taken to be a predetermined block, (excluding contemporaneous effects from outside the block) would be P and W. It will in general be true that any “nonsluggish” variables (C and PZ here) or any sluggish components of the model not directly measured (like L here) generate equations in the system that react immediately to some monetary policy indicator. Identification by correct choice of measures of sluggish but shocked variables may be successful, in other words, but mismeasurement of these variables or attempting to lump auction-market price variables in with the sluggish sector will lead to confounding of monetary policy shocks with other sources of disturbance to the economy. We have carried out an analysis similar to that of Table 1 and Table 2 for a system expanded to include a long rate (1/Q in our model); not surprisingly, in such a model the long rate must be allowed to respond instantly to monetary policy to achieve correct identification, not treated as part of a sluggish block. We are accordingly skeptical of the unusually large real effects found by Gordon and Leeper (1994), who impose sluggishness on the long rate as an identifying restriction.
It also was essential to this scheme that we included enough variables of the right kinds so that the underlying structural disturbances of the system could be reproduced from current and past values of these variables. It may appear that because PZ and rL do not in fact appear contemporaneously in the money supply function, an empirical model omitting these variables would perform well. But, in general, money supply may depend on lagged values of such auction market variables even when it does not depend on them contemporaneously. If such lagged dependence is important, it will be impossible to obtain correct identification without including those variables. Even in this model, where the particular parameterization chosen makes money supply depend only on lagged prices in addition to M and r, the fact that money demand depends on C implies that no empirical model that excludes all rapidly reacting private sector variables can achieve correct identification. Accordingly, we are skeptical of the strong real effects of monetary policy disturbances found by Strongin (1995), who includes in his model's reduced form only industrial production and the consumer price index to represent the private economy.
IDENTIFIED VAR METHODOLOGY
We examine the effects of monetary policy via the analytically convenient framework of identified-VAR modeling. Although this framework is now widely used, we summarize it here, partly because the way it in practice combines formal and informal prior beliefs about the economy is still sometimes misunderstood.
We assume the economy is described by a linear, stochastic dynamic model of the form (ignoring constant terms)

where
is a matrix polynomial in the lag operator L, y is the data vector, and ε is a vector of interpretable disturbances.15
Note that we are recycling notation in this section of the paper. For example, y, Γ, and B all have new meanings here different from their usage in the earlier part of the paper.
is uncorrelated with
for
Of course, if we omit crucial variables from the y vector, there may be no way to construct from y an ε vector with the desired interpretation. This is a familiar point applicable to any econometric modeling problem. It is possible to construct models describing how interpretable ε's generate an observable y vector, and yet for the model to imply that there is no way to use
,
, to construct
. This is the situation in which ε is not “fundamental” for y. Although this is sometimes seen as an exotic special assumption required for identified VAR analysis, it is only another version of the usual requirement that we include all crucial variables in the model. When ε is not fundamental for y, it is always possible in principle to describe an extension of the y vector that removes the problem.
, the coefficient on
in
, is nonsingular.
If (20) holds, together with the stochastic assumptions we have made on ε and y, then the coefficients
in a reduced form VAR

are related to Γ by

The covariance matrix Λ of ε is related to the covariance matrix Σ of u by

If there are no a priori restrictions on
, then there are none on B(L). In that case, it turns out, the likelihood as a function of
and Λ, with other parameters either integrated or concentrated out, depends on the data only via S, the estimated covariance matrix for the reduced-form residuals u. If there are restrictions on
that render it identified, its flat-prior posterior mean or mode (arrived at by treating the likelihood as the posterior p.d.f.) can be found by a nonlinear maximization or integration based on S alone. There is no need to use the identifying restrictions in forming S or (therefore) to reconstruct S when various identification schemes are tried.
The convenience of this framework depends on our not considering restrictions that involve
,
, even though it will be rare that we actually have knowledge about
for
and none for any
. So in practice we end up treating our knowledge or hypotheses about
and Λ formally while bringing to bear our knowledge about
for
informally. That is, we apply some interesting restrictions to
and Λ, look at where this makes the likelihood concentrate, and ask ourselves whether models that have high likelihood under this set of restrictions look reasonable by other criteria.
This interaction of formal and informal restrictions is familiar in all applied econometric work. For example, we might consider using a dummy variable for auto ownership as a measure of wealth in a demand equation, discover that this leads price elasticities that otherwise are estimated as negative to be estimated as significantly positive, and therefore abandon this form of the model in favor of one with some other wealth proxy. If it were not quite a bit of extra trouble, we might instead use formally our beliefs that price elasticities ought to be negative and that there are a number of possible candidate measures of wealth to produce an overall posterior distribution conditional on the data. In practice, it is usually reasonable just to explain to the reader that auto ownership was tried as a wealth proxy and abandoned because it led to wrong-signed estimated price elasticities.
In our VAR analysis, we will discuss estimated systems in which formal identifying restrictions have been applied to
and Γ has been otherwise unrestricted. In some cases, restrictions on
and Λ that might otherwise seem worth exploring lead to estimates that, say, imply that monetary contractions lead quickly to increases in inflation. We put these identifications aside, using informally our prior beliefs about how the full dynamic system ought to behave.17
We should note, though, that the presumption that when the policy authority raises interest rates and causes the money stock to decline, a price decrease should follow, is not an automatic outcome of any DSGE with sticky prices. Our own DSGE implies the opposite for certain parameter settings. If the structural model were being estimated directly, it would be better to let the data keep us in the region where monetary expansion raises prices, because our prior beliefs that this is so are actually more reflective of historical experience and informal interpretations of data than of a priori theorizing.
and Λ, and widely accepted prior beliefs about how the full dynamic system ought to behave, so that restrictions on
and Λ alone that make the likelihood concentrate on dynamic patterns that are a priori implausible should get little posterior weight.
In most of the identified VAR literature the conventional normalization of the simultaneous equations literature is used: the diagonal of
is assumed to be all ones. In this paper, we instead assume that the diagonal of Λ is all ones and leave the diagonal of
unrestricted. This turns out to simplify some formulas used in inference, and it also has the advantage that it compels the reader to remain aware that the choice of “left-hand-side” variable in the equations of models with the more usual normalization is purely a matter of notational convention, not economic substance.
THE EMPIRICAL MODEL
We were inspired by Ball and Mankiw (1995) to consider more disaggregated data on prices in modeling business cycle behavior. They showed that measures of asymmetry in price changes across sectors have predictive power for inflation. Our own experiments with a measure like theirs suggest that the extra predictive power they find is entirely captured by the conventional breakdown of the producers' price index into crude, intermediate, and finished components.
Our model, then, uses quarterly data over 1964–1994 on the following variables:
R: federal funds rate in some versions, 90-day treasury bill rate in others
M: total reserves (TR) in some versions, M2 in others
Py: GNP deflator
y: real GNP
W: average hourly earnings of nonagricultural workers
Pim: producers' price index for intermediate materials
Tbk: bankruptcy filings, personal and business
Pcm: producers' price index for intermediate goods.
All series are from Citibase, except for total bankruptcy filings. That was supplied to us by Kim Kowalewski, who had compiled it while working at the Congressional Budget Office. We experimented with a few additional variables. The producers' price index for finished goods did not add much explanatory power to this system and seemed a priori less likely to measure something clearly distinct from Py. These variables correspond to those used elsewhere in this literature, except for the disaggregated price variables, for which the motivation was discussed above, and the bankruptcy variable. The bankruptcy variable was introduced on the basis of theoretical reasoning by one of us [Zha (2001)], and it appears to sharpen estimates of dynamics.
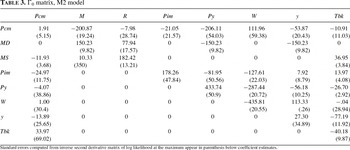
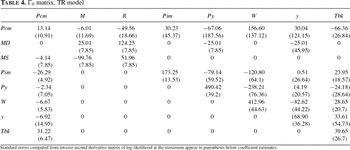
The paragraphs that follow explain and justify the identification scheme. The pattern of zero restrictions on the matrix of contemporaneous coefficients that is being discussed can be viewed in Tables 3 and 4. Following previous work by one of us and others [e.g. Sims (1986)], we use as an identifying restriction the idea that monetary policy cannot respond contemporaneously to disturbances in the general price level or the level of GNP. The argument for this restriction is based on the absence of contemporary data on these variables at the time policy decisions have to be made. This assumption can never be more than an interesting working hypothesis, because policy makers obviously have other sources of information about the economy than the published data, and might have a strong interest in using it to get accurate current assessments of the state of the economy. The assumption gains some credibility in the current paper relative to previous applications of it, however, because we recognize that data on developments in commodity markets are available daily, so that we allow contemporaneous response of monetary policy to Pcm. Note also that in our theoretical model, which is formulated in continuous time and aggregates to a quarterly discrete observation interval explicitly, a specification like this would work, despite the fact that the monetary authority in fact responds instantly to the price level. Because the effects of the price level on policy choices for the interest rate are modeled as smooth, short-run variation in the interest rate is in the model dominated by other sources of variation. Our VAR specification assumes that monetary policy makes the interest rate respond contemporaneously to M, Pcm, and possibly Tbk, but not to other variables in the system. We allow a contemporaneous response to Tbk in the version of the model using M2 as the monetary aggregate but not in the TR version. The M2 model with a response of policy to Tbk has a bothersome, but brief initial positive estimated response of output to monetary contraction, which is not present in the version without a contemporaneous response to Tbk. However, this version of the model gave us the largest estimated response of output to monetary policy shocks we could find. Because one of our main points is that these responses of output to monetary policy disturbances are a small part of overall output variation, we thought it important to include this specification in the discussion.


We assume that money demand behavior makes M respond contemporaneously to y, Py, and R, but not to other variables in the system. This is motivated by the idea that the “money demand equation” is an arbitrage condition connecting the current return on real balances, including convenience yield, to the short interest rate, with “real” money balances best deflated by Py rather than by the producers' price index components. Our estimates impose a requirement that M, Py, and y enter money demand contemporaneously as
, a velocity term, so that in the logarithmic specification we adopt these three variables have coefficients that are the same in absolute value. As can be seen from the discussion of the theoretical model, approximating a more complex world by one in which this simple money demand equation applies could lead to failure of the condition that the money demand equation is a purely contemporaneous relation among M, Py, y, and r, and of the restriction that M, P, and y enter as
.
However, in the theoretical model this restriction (with the role of Y being taken by C in the theoretical model) is not far from being correct, and in the VAR model it seems to accord fairly well with the data.
We assume that all structural disturbances are mutually uncorrelated. Although this goes against the traditional simultaneous equations specification, it seems natural and avoids some conceptual conundrums that otherwise arise when simulating the effects of changes in structural disturbances. (For example, if monetary policy shocks are positively correlated with money demand shocks, does a monetary policy shock “generate” corresponding movements in money demand shocks, or not?) Our view is that a good multiple-equation model should not leave unexplained relations among variables in the error terms. Although we would not argue that correlations among error terms should never be allowed, we believe that what requires explicit discussion and economic interpretation is the presence of correlations among structural disturbances, not its absence.
These restrictions on money demand and monetary policy behavior are not by themselves enough to identify the effects of policy shocks, even if we normalize the rest of the equations of the system rather than trying to give them separate interpretations.18
If we can identify a subset of equations (or equivalently, elements of the disturbance vector) of the system, but the remaining equations or shocks can't be given separate interpretations, we can as a matter of convenience add arbitrary restrictions to the unidentified equations until they are “identified,” although of course there is then an interpretation only for the block as a whole, not for individual equations. This is standard procedure in estimating systems of demand equations, where “demand for commodity i” is not really a separate category of behavior from “demand for commodity j,” but is usually normalized by requiring each equation of the demand system to contain only one quantity variable.
variables be triangular, the resulting system satisfies an order condition for identification, but it does not produce convincing results here. With this identification, money supply shocks have large effects on output, but they also have large effects, in the opposite direction, on prices. The responses to money supply shocks under this identification look much like the responses to “y shocks” in the identification we discuss in more detail below. Because we regard it as unlikely that monetary policy contraction quickly produces high inflation, we turned to other possible identification schemes.19
However, in light of the fact that such a pattern of results is at least qualitatively consistent with our DSGE model, we intend to examine it more carefully in future work. Because this interpretation is much more contrary to conventional wisdom than the results we emphasize this paper, it appears that it could only be examined convincingly in a fitted structural model.
The identification scheme that we have found most interesting limits the contemporaneous impact of interest rates on the private sector as well as the contemporaneous impact of M. The idea is that most types of real economic activity, because of inherent inertia and planning delays, may respond only with a lag to price and financial signals. Even price variables, when they apply to labor or to manufactured goods, may respond sluggishly. Commodity prices (in our specification, Pcm), by contrast, are set in continuously active competitive markets that can be expected to respond quickly to financial market signals.
We postulate a block of equations determining Pim, Py, y, W, and Tbk, from which M and R are excluded. This is thought of as characterizing behavior of finished goods producers and wage setters or negotiators, and the variables in it correspond to the sluggish block of observed variables, P and W, in our theoretical model. The fact that Pcm does appear in this block creates a route by which there can be some contemporaneous impact of monetary policy on this “sluggish block” of five variables. The argument for including Pcm in the block is the likelihood that commodity prices have some immediate impact on the block via markup rules for prices. Note that this block of five equations is not internally identified—the individual equations have no distinct interpretations. The block is restricted to have zero coefficients on M and R in all equations, and the matrix of coefficients on the five variables thought of as determined within the block is normalized, with a triangular pattern of zero restrictions.
Finally, one equation contains all variables contemporaneously. It defines a private sector disturbance distinct from money supply and the shocks to rules of thumb. It reflects the existence of disturbances to the private sector that cannot be defined in terms of the sticky non-financial variables included in the model. Financial variables (like R and
) would serve as indicators of such private-sector disturbances. Probably we need not point out that this identification scheme does not represent “restrictions implied by economic theory.” It represents instead a possibly interesting set of working hypotheses whose implications we wish to explore. By contrast, as we saw in the discussion of the theoretical model, the set of stochastic equilibrium models that satisfy such restrictions is not empty.
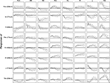
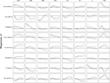
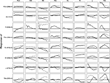
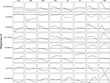
Table 3 and Table 4 display the estimated contemporaneous coefficient matrices and Figure 2 and Figure 3 display the impulse responses for the M2 and TR versions of the model, respectively. The impulse responses are shown with equal-tailed 68% posterior probability bands about them.20
The standard error of the impulse response at each point was calculated by the Monte Carlo algorithm described in Sims and Zha (1999). The upper and lower lines plotted in each small graph are 68% posterior probability bands, approximately one standard error above and below the central line, so that the gap between the two dotted lines is about two standard errors.

Impulse responses for the M2 model.

Impulse responses for the total reserves model.
We begin by discussing the M2 model's responses in Figure 2. Note that a monetary contraction produces an initial interest rate rise and a money stock decline, and eventual declines in all the price variables. Output declines by a statistically significant amount, though the magnitude of this response is not as large as the response to the Tbk component of the sluggishly adjusting block. The responses to the identified money demand shock are mostly insignificant, although the rise in interest rates is significant, as is the fall in output and the eventual decline in W.
The Tbk shock that accounts for much of output, price and interest rate movements might be interpreted as a supply shock. Bankruptcies, interest rates, commodity prices, and intermediate goods prices rise immediately after one of these shocks, followed by inflation in the general price level, output decreases, and a fall in the money supply. This is all what one would expect from an anticipated increase in scarcity of inputs, resulting in inflationary pressure offset partly by contractionary monetary policy. It is clear that these shocks are sharply distinguished from monetary policy shocks by their different effects on subsequent inflation.
The responses for the TR version of the model in Figure 3 are similar in many respects. In this model, the Tbk shock behaves much as did the same shock in the last column of Figure 2. The money supply shock in the third column also behaves similarly except that the output effects of money supply shocks are estimated to be very small in the TR model.
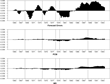
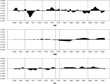
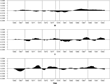
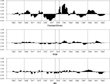
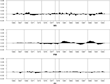
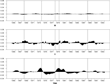
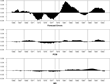
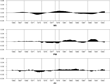
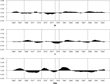
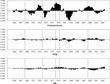
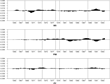
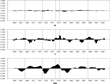
To examine how these models interpret history, we show in Figure 4 to Figure 7 historical decompositions21
The model implies that the path of any variable from dates t to
is the sum of the model's forecast of the path based on data through
with other components that are linear combinations of forecast errors (innovations) in all variables of the system, dated t and later. Each of the decomposition figures contains an initial panel displaying forecast errors—actual minus forecast data—together with eight plots of the components of the forecast error, as allocated by the model to shocks in each of the model's eight identified equations. For each figure, the upper left panel is the sum of the remaining eight.
The Romer dates in the sample are 68:12, 74:4, 78:8, and 79:10.

Figure 4a
Historical decomposition of M2 forecast errors in the M2 model.

Figure 4b
Historical decomposition of M2 forecast errors in the M2 model.

Figure 4c
Historical decomposition of M2 forecast errors in the M2 model.

Figure 5a
Historical decomposition of R forecast errors in the M2 model.

Figure 5b
Historical decomposition of R forecast errors in the M2 model.

Figure 5c
Historical decomposition of R forecast errors in the M2 model.

Figure 6a
Historical decomposition of Py forecast errors in the M2 model.

Figure 6b
Historical decomposition of Py forecast errors in the M2 model.

Figure 6c
Historical decomposition of Py forecast errors in the M2 model.

Figure 7a
Historical decomposition of y forecast errors in the M2 model.

Figure 7b
Historical decomposition of y forecast errors in the M2 model.

Figure 7c
Historical decomposition of y forecast errors in the M2 model.

Figure 8a
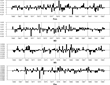
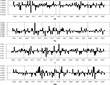
Time-series of structural disturbances in the M2 model.

Figure 8b
Time-series of structural disturbances in the M2 model.
An M1 version of the model, not shown, shows very little response of output to money supply shocks, and thus rules out from the start a strong explanatory role in output movements for money supply shocks. The same is true for the Total Reserves version. But even the M2 version attributes only a fraction of what went on after Romer dates to money supply shifts. As can be seen from Figure 7b, output did decline in response to money supply shocks alone after the 1969 date, but the recessions around the 1974 and 1978–79 datest are attributed almost entirely to Tbk shocks. Both MS and Tbk shocks contributed to output decline subsequent to the 1988 date. A comparison of the MS line of Figure 7b with the Tbk line of Figure 7c shows that the latter is more important source of output fluctuation.
Thus, the M2 version of the model implies that a recession initiated by monetary policy is possible, but that most of the recessions since 1964 were not explained mainly by monetary policy. The M1 and TR versions imply that monetary policy played no role in generating these recessions. We will discuss the implications of these results further later.
ASSESSING FIT
The approximate standard errors on the coefficients in the contemporaneous coefficient matrix, as displayed in Tables 3 and 4, are in many cases large. This might lead to concern that the identification is weak, so that results are suspect. Note, however, that the cross-relations between parameters are strong, so that the likelihood can leave less doubt about the shapes of impulse response functions than these approximate standard errors suggest. Indeed this is exactly the case, as we can see from the standard error bands in Figures 2 and 3. Many of the most important response patterns are significantly different from zero over some part of the four-year period over which they are plotted, and the measures of uncertainty in these graphs take full account of any weakness of the evidence for our identification scheme.
Our sample period includes two oil shocks and the October 1979 change in Federal Reserve operating procedures. It might be thought that fitting a model to this full sample period must produce distorted results. Because our period is short and the model fairly large, we cannot give up much of it without greatly reducing the precision of estimates. We can, however, drop crucial subperiods to see if results are affected. We have tried omitting the periods 79:4–82:4 or 79:4–83:4, (to leave out the period of reserve targeting) and the two two-year periods 73–74 and 79–80 (to leave out oil shocks). We do not reproduce the impulse responses and standard error bands for these experiments, as they have a regular character: The pattern of estimated maximum likelihood responses to money supply shocks remains the same, while the precision of the estimates as indicated by the standard error bands deteriorates. The pattern of responses to shocks from other sources in some cases change substantially, and the relative importance of shocks from different sources changes. Twice the difference in log likelihood between a model fit to the whole sample and a model fit separately to 64:1–79:3 and 83:1–94:1 is 339.11 for the TR model, 330.54 for the M2 model. (These tests are calculated on unrestricted reduced forms.) The number of additional parameters in the split-sample model is 264. Both the Schwarz criterion and the Akaike criterion favor the restricted model. Also, if we compare a model fit to the entire sample with one fit to a sample omitting 79:4–83:4, the statistics are 234 and 237, respectively, with 128 more free parameters in the less restricted model. Again both Akaike and Schwartz criteria favor the more restricted model.
Our overall conclusion is that our claims about the responses to money supply shocks are fairly robust to sample period.
IMPLICATIONS FOR THE EFFECTS OF POLICY CHANGES
Our estimated model implies not only that unpredictable shifts in monetary policy have accounted for little of the historical pattern of business cycles, but also that they account for a relatively small proportion of variation in interest rates and money stock. Thus it implies that most monetary policy actions have historically been systematic reactions to the state of the economy. Assessment of the effects of policy, as opposed to the effects of unpredictable changes in policy, must therefore consider what would happen if the systematic component of monetary policy were different.23
This message is sometimes misunderstood. In estimating the effects of policy changes, isolating unpredictable variation in policy is essential for identification. This is so even if the most interesting policy questions have to do with the effects of systematic changes in policy.

Impact of changing the historical monetary policy to a fixed R policy in the M2 model.

Impact of changing the historical monetary policy to a fixed M policy in the M2 model.
This analysis would be correct initially, but its accuracy would deteriorate over time if the new policy were long held in place. In the case of Figure 9, the policy produces changes that create explosive inflation. It is therefore unlikely to suppose that it would be long sustained and logically inconsistent to suppose that private agents are certain that it would be sustained forever. In the case of Figure 10, the effects of the policy change are so modest that it seems likely that the public would take a long time to learn that policy had in fact changed.
In looking at these figures, the MS columns are not of central interest. Most important is how the effects of nonpolicy shocks, particularly the important y and Tbk shocks, are altered by the change in policy. In each of these two figures, the solid lines represent the originally estimated responses, whereas the dashed lines represent the responses under the modified policies. We see in Figure 9 that if the monetary authority reacted to the deflationary Tbk shock by holding R fixed instead of, as it did historically, reducing interest rates to offset the deflationary pressure, the result would be a less expansionary effect of the shock on output. Although this might seem to recommend the fixed-R policy as more stabilizing, note that the price variables, and Py and W in particular, have undamped responses to the Tbk shock under this policy. That is, by not reacting to a deflationary private sector shock with reduced nominal interest rates, the policy authority can create an unbounded deflationary spiral.
But the historical reaction to a deflationary Tbk shock has been more strongly expansionary than a “fixed M rule” would have been. Could moving to a fixed M rule have given us less output instability without greater price instability? Figure 10 shows us that there is little room for such a conclusion. The effects on output of a Tbk shock are smaller under a fixed M rule, but not by a great deal, whereas the effects on Pim and Py show substantially slower damping of the price effects of the shock. Thus, according to this version of our model—which shows the strongest output effects we can find—there is some possibility for trading reduced output variability for increased price variability, but the terms of the tradeoff do not look very favorable. Although we have obviously not completed a full analysis of policy optimality, neither version of our estimated model suggests that the historical policy rule could easily be improved on.
CONCLUSION
The main substantive implication of our analysis is that most variation in monetary policy variables represents systematic response of policy to the state of the economy. As a byproduct, we conclude also that little of observed postwar cyclical variation is attributable to exogenous variation in monetary policy and that the real effects of monetary policy are probably smaller, and certainly much less certain, than is commonly believed.
Our methodological conclusions are first that there is a common pattern in identifying assumptions across most of the apparently varied identified-VAR literature on the effects of monetary policy. These assumptions, invoking inertia of certain private-sector variables, though not common in DSGE models, can be embedded in them. But we also are critical of the lack of careful economic argument about identifying assumptions in much of the identified-VAR literature, particularly the casual invocation of sluggishness assumptions on auction-market prices. And, of course, this paper, like the whole of the identified-VAR literature, constitutes an implicit criticism of the lack of careful attention to time series fit in most of the DSGE literature. We hope to have shown that such criticism is not impractical perfectionist carping. DSGE models and VAR models need not continue to occupy isolated, self-referential literatures. Identifying assumptions for VAR models can be discussed in the context of explicit DSGE models; DSGE models that fit the data by the stiff standards of careful time series econometrics are possible.
APPENDIX. PARAMETER VALUES
The numerical calculations reported in the text were based on the model laid out in (1)–(16), with the Greek-letter parameters set as listed here:

The matrix Γ was set at the identity, except that in the row corresponding to N there is also a − 1 in the position corresponding to L. Because L and N are in logs, this has the effect of making rapid changes in the ratio of N to L costly rather than penalizing rapid change in N itself. That is, natural resource inputs are assumed to move with labor inputs in the short run. The matrix ρ was set to −.12 times the identity matrix.
This work was supported in part by NSF grant SES91-22355. We thank David Marshall for helpful comments. The views expressed here are those of the authors and not necessarily those of the Federal Reserve Bank of Atlanta or the Federal Reserve System.