



1. Introduction
When the ratio between the molecular mean free path and the characteristic flow length becomes appreciable, the Navier–Stokes–Fourier equations fail to describe the rarefied gas dynamics and the gas kinetic equation is used instead. For a monatomic gas, the Boltzmann equation and the direct simulation Monte Carlo (DSMC) method provide equivalent and successful predictions of rarefied gas dynamics (Wagner Reference Wagner1992; Bird Reference Bird1994). For a molecular gas, however, an internal energy (owing to the excitation of rotational, vibrational or electronic degrees of freedom) other than translational energy exists, which makes the collision dynamics much more complicated than that of a monatomic gas. Wang-Chang & Uhlenbeck (Reference Wang-Chang and Uhlenbeck1951) extended the Boltzmann equation by treating the internal degree of freedom quantum mechanically and assigning each internal energy level an individual velocity distribution function. However, it is obvious that the analytical and numerical methods for the Wang-Chang & Uhlenbeck equation become difficult and expensive. For example, Tcheremissine & Agarwal (Reference Tcheremissine and Agarwal2009) found that in a hypersonic flow, the computational cost for a molecular gas is two orders of magnitude higher than that for a monatomic gas.
Compared with a dilute monatomic gas, a unique feature of the molecular gas is that it exchanges the translational and internal energies during binary collisions. On an averaging sense, in spatial-homogeneous systems, the relaxation of rotational temperature  $T_{rot}$ (for simplicity, we assume the molecule has only a rotational mode excited, and the rotational degree of freedom is
 $d_r=2$ for a diatomic and linear molecule, and 3 for all other nonlinear molecules) is described by the Jeans–Landau equation
 \begin{equation} \frac{\partial{T_{rot}}}{\partial t}=\frac{p_{tr}}{\mu}\frac{T-T_{rot}}{Z}, \end{equation}
where  $t$ is the time,
 $p_{tr}$ is the kinetic pressure,
 $\mu$ is the shear viscosity of the gas,
 $T$ is the total temperature and
 $Z$ is the rotational collision number. Meanwhile, the relaxation of the translational and rotational heat fluxes (
 $\boldsymbol {q}_{tr}$ and
 $\boldsymbol {q}_{rot}$, respectively) are found to satisfy (Mason & Monchick Reference Mason and Monchick1962; McCormack Reference McCormack1968):
 \begin{equation} \frac{\partial }{\partial t}\left[ \begin{array}{@{}c@{}cc} \boldsymbol{q}_{tr} \\ \boldsymbol{q}_{rot} \end{array} \right] ={-}\frac{p_{tr}}{\mu} \left[ \begin{array}{@{}cc@{}c} A_{tt} & A_{tr} \\ A_{rt} & A_{rr} \end{array} \right] \left[ \begin{array}{@{}c@{}cc} \boldsymbol{q}_{tr} \\ \boldsymbol{q}_{rot} \end{array} \right], \end{equation}
where the matrix of relaxation rates  ${\boldsymbol {A}}=[A_{ij}]$ with
 $i,j=t,r$ determines the translational and internal thermal conductivities, see § 2.2. From the physical point of view, the matrix should have two positive eigenvalues.
The DSMC has become the prevailing method to simulate the rarefied dynamics of molecular gases, by using the phenomenological collision model of Borgnakke & Larsen (Reference Borgnakke and Larsen1975). While the success of DSMC in modelling monatomic gas dynamics lies in its recovery of viscosity and thermal conductivity, and the accurate update of post-collision velocities as per a Boltzmann collision operator, the simulation of molecular gas flow in DSMC is not perfect. That is, in DSMC, the attention is only paid to realize the correct exchange rate between the translational and internal energies (1.1), which guarantees the exact recovery of the bulk viscosity (Boyd Reference Boyd1991; Haas et al. Reference Haas, Hash, Bird, Lumpkin III and Hassan1994; Gimelshein, Gimelshein & Lavin Reference Gimelshein, Gimelshein and Lavin2002). However, it cannot always recover the thermal conductivity (Wu et al. Reference Wu, Li, Liu and Ubachs2020), either the total value or its translational and internal components. So far, the consequence of this overlooked problem remains unknown as, to the best of our knowledge, no one has considered (or there is no mechanism to recover) the relaxation of heat fluxes (1.2) in DSMC, which determines the thermal conductivity of gas.
The relaxation rates play important roles in the gas dynamics (Candler Reference Candler2018). Although in DSMC and other kinetic models (Morse Reference Morse1964; Holway Reference Holway1966; Rykov Reference Rykov1975; Gorji & Jenny Reference Gorji and Jenny2013; Wu et al. Reference Wu, White, Scanlon, Reese and Zhang2015; Kolluru, Atif & Ansumali Reference Kolluru, Atif and Ansumali2020) the effect of temperature relaxation (1.1), or equivalently the bulk viscosity, has been extensively studied, e.g. by Frezzotti & Ytrehus (Reference Frezzotti and Ytrehus2006), Taniguchi et al. (Reference Taniguchi, Arima, Ruggeri and Sugiyama2014) and Kosuge & Aoki (Reference Kosuge and Aoki2018), the role of thermal relaxation of heat fluxes (1.2) has seldom been investigated. In experiments, the total thermal conductivity can be measured straightforwardly, and sometimes its translational part (Mason Reference Mason1963; Gupta & Storvick Reference Gupta and Storvick1970; Porodnov, Kulev & Tuchvetov Reference Porodnov, Kulev and Tuchvetov1978; Wu et al. Reference Wu, Li, Liu and Ubachs2020) can also be measured; we will show in the following section that there are still at least two elements in the thermal relaxation rates of heat fluxes  ${\boldsymbol {A}}$ that are not determined. Therefore, it is the aim of the present work to quantify these uncertainties caused by the variation of
 ${\boldsymbol {A}}$ in rarefied gas flows, although they rarely affect the continuum flow described by the Navier–Stokes–Fourier equations when the shear viscosity, bulk viscosity and total thermal conductivity are fixed.
To fulfil this goal, a kinetic model which is able to recover the relaxation rates in (1.1) and (1.2) is urgently needed. In this paper, the model of Wu et al. (Reference Wu, White, Scanlon, Reese and Zhang2015) is first introduced, which is then modified to include the general relaxations for both temperatures and heat fluxes. The modified model is validated by DSMC when both models have the same relaxation rates. Finally, the new kinetic model is used to study the influence of thermal relaxation rates in rarefied gas flows, by keeping other parameters unchanged. Note that here we do not use DSMC because when the shear viscosity, bulk viscosity and Schmidt number (i.e.  $Sc=\mu /\rho D$, where
 $\rho$ is the mass density and
 $D$ is the diffusion coefficient) are fixed, the matrix
 $\boldsymbol {A}$ in DSMC is fixed, but the resulting thermal conductivities may not be equal to the experimentally measured values (Wu et al. Reference Wu, Li, Liu and Ubachs2020), not to mention its translational and internal components.
2. Thermal relaxation and transport coefficients
The essential difference between monatomic and molecular gases is that molecules exhibit internal relaxation that exchanges the translational and internal energies, which lead to several new transport coefficients including the bulk viscosity and internal thermal conductivity. For simplicity, we consider the case where only rotational modes are activated and treated in the way of classical mechanics.
2.1. Bulk viscosity
In dilute gas, the exchange of translational and internal energy through inelastic collisions leads to a resistance in the compression or expansion of the gas, which is quantified by the bulk viscosity  $\mu _b$. According to the expansion of Chapman & Cowling (Reference Chapman and Cowling1970) , when the relaxation time
 $Z\mu /p_{tr}$ between the translational and rotational energies is much shorter than the characteristic time of gas flow, the bulk viscosity is expressed as
 \begin{equation} {\mu_b}=\frac{2d_rZ}{3(d_r+3)}\mu. \end{equation}
The most widely used phenomenological model for molecular gas in DSMC is the model of Borgnakke & Larsen (Reference Borgnakke and Larsen1975), in which the relaxation rate is controlled by making a fraction of collisions inelastic. This fraction gives the inverse of the rotational collision number in DSMC, denoted as  $Z_{{DSMC}}$. Note that when the variable-soft-sphere model is used in DSMC,
 ${Z_{{DSMC}}}$ is related to the rotational collision number
 ${Z}$ in (1.1) as
 \begin{equation} {Z}=\frac{\alpha(5-2\omega)(7-2\omega)}{5(\alpha+1)(\alpha+2)}{Z_{{DSMC}}}, \end{equation}
where  ${\omega }$ is the viscosity index such that
 $\mu (T)=\mu (T_0)(T/T_0)^{\omega }$,
 $T_0$ is the reference temperature and
 $\alpha$ is the parameter that determines the scattering angle after binary collision; it can be chosen freely, but in the variable-soft-sphere model it is usually determined by the Schmidt number (to simulate the diffusion process) through the following equation (Bird Reference Bird1994):
 \begin{equation} Sc=\frac{5(2+\alpha)}{3(7-2\omega)\alpha}. \end{equation}
Therefore, the bulk viscosity of the molecular gas can be exactly recovered by adjusting the value of  $Z_{{DSMC}}$ in DSMC simulations.
2.2. Thermal conductivity
Compared with the monatomic gas, the thermal relaxations not only reduce the value of the translational thermal conductivity  $\kappa _{tr}$, but also result in the rotational thermal conductivity
 $\kappa _{rot}$. According to the expansion of Chapman & Cowling (Reference Chapman and Cowling1970), the translational and rotational thermal conductivities satisfy (Mason & Monchick Reference Mason and Monchick1962)
 \begin{equation} \left[ \begin{array}{ccc} \kappa_{tr} \\ \kappa_{rot} \end{array} \right] = \frac{{k_B}{\mu}}{2m} \left[ \begin{array}{ccc} A_{tt} & A_{tr} \\ A_{rt} & A_{rr} \end{array} \right]^{{-}1} \left[ \begin{array}{ccc} 5 \\ d_r \end{array} \right], \end{equation}
where  $k_B$ is the Boltzmann constant and
 $m$ is the molecular mass.
It will be convenient to express the thermal conductivity  $\kappa$ of a molecular gas in terms of the dimensionless factors reported by Eucken (Reference Eucken1913):
 \begin{equation} \frac{\kappa{m}}{\mu{k_B}}=\frac{3}{2}f_{tr}+\frac{d_r}{2}f_{rot}=\frac{3+d_r}{2}f_{u}, \end{equation}
where  ${f_{u}}$ is the total Eucken factor, while
 $f_{tr}$ and
 $f_{rot}$ are the translational and internal Eucken factors, respectively,
 \begin{equation} {f}_{tr}=\frac{2}{3}\frac{{m{\kappa}_{tr}}}{k_B\mu}, \quad {f}_{rot}=\frac{2}{d_r}\frac{{m{\kappa}_{rot}}}{k_B\mu}. \end{equation}
From (2.4) and (2.6a,b), it is clear that the Eucken factors are determined by the four relaxation rates in the matrix  $\boldsymbol {A}$. However, the values of these relaxation rates are difficult to be obtained experimentally. For monatomic gas,
 $A_{tr}=A_{rt}=A_{rr}=0$ and
 $A_{tt}=2/3$, so the translational Eucken factor is 2.5. In molecular gas, the energy exchange between translational and rotational energy makes the off-diagonal components
 $A_{tr}$ and
 $A_{rt}$ negative, which leads to a translational Eucken factor
 ${f}_{tr}$ lower than 2.5.
In DSMC, as the only parameter modifying the energy exchange between different energy modes, the collision number  $Z$ determines the values of relaxation rates
 $\boldsymbol {A}$ (and hence the thermal conductivities). Considering the discussion in § 2.1, both bulk viscosity and thermal conductivity of a molecular gas are determined by
 $Z$, so that they cannot be adjusted independently in DSMC. Therefore, in general, these two transport coefficients cannot be matched to the experimental values simultaneously in the conventional DSMC method with the Borgnakke–Larsen model.
2.3. Extraction of thermal relaxation rates in DSMC
Because DSMC does not allow free adjustment of  $\boldsymbol {A}$ but only the collision number
 ${Z_{{DSMC}}}$, here we extract the relaxation rates
 $\boldsymbol {A}$ by varying
 ${Z_{{DSMC}}}$. To this end, we consider both nitrogen and hydrogen chloride, which have only classical rotational motions excited (with
 ${d_r=2}$) at room temperature.
We extract the thermal relaxation rates  $\boldsymbol {A}$ in the spatial-homogeneous relaxation problem:
 ${10^6}$ simulation particles are generated over a cubic cell of the size
 $(10\ \textrm {nm})^{3}$, where the periodic condition is employed at all the boundaries. The gas density is
 ${n_0=2.69\times 10^{25}}\ \textrm {m}^{-3}$ and the temperature is
 $T_0=300\ \textrm {K}$. At the beginning of the DSMC simulation, simulation particles with positive velocity in the
 $x$ direction are generated from the Maxwell velocity distribution of
 $T=200\ \textrm {K}$, while the rest are generated from the Maxwell velocity distribution of
 $T=400\ \textrm {K}$, see figure 1(a); similarly, the rotational energy assigned to the particles with
 $v_x>0$ is generated from the Maxwell distribution of
 $T=200\ \textrm {K}$, while those moving to the opposite direction obey the Maxwell distribution of
 $T=400\ \textrm {K}$, see figure 1(b). In this manner, we generate an initial velocity and energy distribution, which leads to initial non-zero values of translational and rotational heat fluxes. Then, the system with prescribed initial heat fluxes evolves with respect to time, and both the translational and rotational heat fluxes are monitored until the entire system reaches thermal equilibrium. Both nitrogen and hydrogen chloride are simulated to extract the relaxation rates
 $\boldsymbol {A}$ with the variable-soft-sphere molecular collision model and the corresponding parameters are listed in table 1. One hundred independent runs were conducted to get smooth results.
The initial distribution of  ${(a)}$ molecular velocity and
 ${(b)}$ rotational energy of nitrogen molecules in DSMC (the open-source code SPARTA is used), where the abscissas are normalized by
 $\sqrt {2k_BT_0/m}$ and
 ${k_BT_0}$, respectively.
 ${(c{,}d)}$ The evolution of heat fluxes and their time derivatives, where the circles in
 ${(d)}$ represent the numerical fitting used to extract the relaxation rates
 ${\boldsymbol {A}}$ from DSMC.
 ${(e\text {--}h)}$ Extracted
 ${\boldsymbol {A}}$ from DSMC for nitrogen (squares) and hydrogen chloride (circles). DSMC simulation parameters are summarized in table 1.

Parameters in the variable-soft-sphere model of DSMC, for  $\mathrm {N}_2$ and
 $\mathrm {HCl}$, which are collected from tables A1 and A3 in the book of Bird (Reference Bird1994). In this case and all the following cases, the simulation time step is chosen to be one-fifth of the minimum cell size divided by the most probable speed
 $\sqrt {2k_BT_0/m}$, which is much smaller than the average collision time of gas molecules. It follows the standard procedure in DSMC simulations to guarantee the convergence in terms of time step (Bird Reference Bird1994).

Figure 1(c,d) plots the evolution of the translational and rotational heat fluxes and their time derivatives for nitrogen with  $Z_{DSMC}=4.0$. It can be seen that the time derivative of the translational heat flux is significantly increased, owing to its strong coupling with the rotational heat flux: from (1.2), it can be inferred that
 $A_{tr}$ is negative. And the time derivative of rotational heat flux decreases monotonically with respect to the time, which implies that
 $|A_{rt}|$ is very small if
 $A_{rt}$ is negative.
We adopt the least squares method to solve the linear regression problem (1.2) to extract the relaxation rates  ${\boldsymbol {A}}$, and the results in figure 1(e–h) show that these parameters exhibit a linear dependence with
 ${1/Z_{{DSMC}}}$. When the collision number
 $Z_{DSMC}$ is increased, the energy exchange between translational and internal motions vanishes gradually, hence the relaxation rates
 ${A_{tr}}$ and
 ${A_{rt}}$ approach zero, while
 $A_{tt}$ and
 $A_{rr}$ approach
 $2/3$ and
 $Sc$, respectively. According to (2.4),
 $A_{rr}$ approaching
 $Sc$ means that the translational thermal conductivity is proportional to the diffusion coefficient. This is comprehensible because the diffusion of gas molecules transports the heat; the detailed discussion can be seen in Appendix A.
Given the thermal relaxation rate  ${\boldsymbol {A}}$, the Eucken factors can be calculated by (2.4) and (2.6a,b). We find that to match the experimental thermal conductivity (or equivalently
 $f_u=1.993$) of nitrogen at
 $T_0=300\ \textrm {K}$, the collision number has to be chosen as
 ${Z_{{DSMC}}=4.0}$, and the corresponding relaxation rates are
 $A_{tt}=0.786, A_{tr}=-0.201, A_{rt}=-0.059\ {\rm and}\ A_{rr}=0.842$; hence we have
 $f_{tr}=2.365$ and
 $f_{rot}=1.435$. Note that this value of
 $Z_{{DSMC}}$ may not lead to the correct value of the bulk viscosity. However, for hydrogen chloride, no matter what is the value of
 ${Z_{{DSMC}}}$, the calculated total thermal conductivity from DSMC can never recover the experimental value (Wu et al. Reference Wu, Li, Liu and Ubachs2020). This is the problem of DSMC which, in general, cannot recover the bulk viscosity and translational/internal thermal conductivity of molecular gas simultaneously in the phenomenological Larsen–Borgnakke collision model.
3. The modified Wu model and its validation
Owing to the limitation of the DSMC method, a kinetic model is developed in this section, which allows free adjustment of relaxation rates (and hence free adjustment of the bulk viscosity and translational/internal thermal conductivities). To this end, we modify the model of Wu et al. (Reference Wu, White, Scanlon, Reese and Zhang2015) so that it can reflect the general relaxations for temperature and heat flux. Then, we validate the accuracy of the proposed model by comparing its solutions for the normal shock wave and creep flow driven by Maxwell's demon with the DSMC results. To make a consistent comparison, the relaxation rates in the modified model of Wu et al. (Reference Wu, Li, Liu and Ubachs2020) should be the same as those in the DSMC simulations.
3.1. The modified kinetic model
Like the equation of Wang-Chang & Uhlenbeck (Reference Wang-Chang and Uhlenbeck1951), all the kinetic models divide the binary collision into the elastic and inelastic collisions. The elastic collision conserves the translational energy, while the inelastic collision exchanges the translational and rotational energies. The linearized kinetic model for molecular gas is developed by Hanson & Morse (Reference Hanson and Morse1967), while one of the practical models for nonlinear flows is proposed by Rykov (Reference Rykov1975). As an extension of the Rykov model, the kinetic model equation developed by Wu et al. (Reference Wu, White, Scanlon, Reese and Zhang2015) also treats the elastic and inelastic collision separately. While to improve the modelling accuracy, the Wu model replaces the elastic collision operator in the Rykov model with the Boltzmann collision operator for a monatomic gas, and thus introduces a more realistic elastic collision relaxation time that is dependent on the molecular velocity (i.e. in the limit without translational–internal energy exchange, it is reduced to the Boltzmann equation for a monatomic gas).
In the original model of Wu et al. (Reference Wu, White, Scanlon, Reese and Zhang2015), two velocity distribution functions,  $G(\boldsymbol {x},\boldsymbol {v},t)$ and
 $R(\boldsymbol {x},\boldsymbol {v},t)$, where
 ${\boldsymbol {x}}$ and
 ${\boldsymbol {v}}$ are respectively the spatial coordinates and molecular velocity, are used to describe the translational and rotational motions of gas molecules; their evolutions are governed by the following kinetic equations:
 \begin{equation} \left. \begin{aligned} \frac{\partial{G}}{\partial{t}}+{\boldsymbol{v}}\boldsymbol{\cdot}\frac{\partial{G}}{\partial{\boldsymbol{x}}}+{\boldsymbol{a}}\boldsymbol{\cdot}\frac{\partial{G}}{\partial{\boldsymbol{v}}} & = Q(G)+\frac{G_{rot}-G_{tr}}{Z{\tau}},\\ \frac{\partial{R}}{\partial{t}}+{\boldsymbol{v}}\boldsymbol{\cdot}\frac{\partial{R}}{\partial{\boldsymbol{x}}}+{\boldsymbol{a}}\boldsymbol{\cdot}\frac{\partial{R}}{\partial{\boldsymbol{v}}} & = \frac{R'_{tr}-R}{\tau}+\frac{R_{rot}-R_{tr}}{Z{\tau}}, \end{aligned} \right\} \end{equation}
where  $\boldsymbol {a}$ is the external acceleration,
 $\tau =\mu /p_{tr}$ is the characteristic collision time related to the translational motion of gas molecules and
 $Q(G)$ is the Boltzmann collision operator for monatomic gases (Wu et al. Reference Wu, White, Scanlon, Reese and Zhang2013; Wu, Reese & Zhang Reference Wu, Reese and Zhang2014). The four reference distribution functions
 $G_{tr}$,
 $G_{rot}$,
 $R_{tr}$ and
 $R_{rot}$ are modelled as
 \begin{equation} \left. \begin{gathered} G_{tr}=n\left(\frac{m}{2{\rm \pi}{k_B}{T_{tr}}}\right)^{3/2}\exp\left(-\frac{mc^2}{2k_B{T_{tr}}}\right)\left[1+\frac{2m\boldsymbol{q}_{0}\boldsymbol{\cdot}\boldsymbol{c}}{15k_BT_{tr}{p_{tr}}}\left(\frac{mc^2}{2k_BT_{tr}}-\frac{5}{2}\right)\right],\\ G_{rot}=n\left(\frac{m}{2{\rm \pi}{k_B}T}\right)^{3/2}\exp\left(-\frac{mc^2}{2k_BT}\right)\left[1+\frac{2m\boldsymbol{q}'_{0}\boldsymbol{\cdot}\boldsymbol{c}} {15k_BTp}\left(\frac{mc^2}{2k_BT}-\frac{5}{2}\right)\right],\\ R_{tr}=\frac{d_rk_BT_{rot}}{2}G_{tr}+\left(\frac{m}{2{\rm \pi}{k_B}T_{tr}}\right)^{3/2}\exp\left(-\frac{mc^2}{2k_BT_{tr}}\right)\frac{m\boldsymbol{q}_1\boldsymbol{\cdot}\boldsymbol{c}}{k_BT_{tr}},\\ R_{rot}=\frac{d_rk_BT}{2}G_{rot}+\left(\frac{m}{2{\rm \pi}{k_B}T}\right)^{3/2}\exp\left(-\frac{mc^2}{2k_BT}\right)\frac{m\boldsymbol{q}'_1\boldsymbol{\cdot}\boldsymbol{c}}{k_BT}, \end{gathered} \right\} \end{equation}
and  ${R'_{tr}}$ in the elastic collision operator is
 \begin{equation} R'_{tr}=\frac{d_rk_BT_{rot}}{2}\left[\tau Q(G)+G\right]+\left(\frac{m}{2{\rm \pi}{k_B}T_{tr}}\right)^{3/2}\exp\left(-\frac{mc^2}{2k_BT_{tr}}\right)\frac{m\boldsymbol{q}_1\boldsymbol{\cdot}\boldsymbol{c}}{k_BT_{tr}}, \end{equation}
where  $\boldsymbol {c}=\boldsymbol {v}-\boldsymbol {U}$ is the peculiar velocity, and
 \begin{equation} \left. \begin{aligned} \boldsymbol{q}_0 & = \boldsymbol{q}_{tr}, \quad \boldsymbol{q}'_0 = \omega_0\boldsymbol{q}_{tr},\\ \boldsymbol{q}_1 & = (1-Sc)\boldsymbol{q}_{rot}, \quad \boldsymbol{q}'_1 = (1-Sc)\omega_1\boldsymbol{q}_{rot}, \end{aligned} \right\} \end{equation}
where  $\omega _0$ and
 $\omega _1$ are the constants to recover both the translational and rotational thermal conductivity coefficients of molecular gases. Further, the macroscopic quantities, number density
 $n$, flow velocity
 ${\boldsymbol {U}}$, translational temperature
 ${T}_{tr}$, rotational temperature
 ${T}_{rot}$, translational heat flux
 ${\boldsymbol {q}}_{tr}$, the rotational heat flux
 ${\boldsymbol {q}}_{rot}$ and pressure tensor
 $p_{ij}$ are calculated from the velocity moments of the two distribution functions
 $G$ and
 $R$:
 \begin{equation} \left. \begin{aligned} n & =\int {G}\mathrm{d}{\boldsymbol{v}}, \quad {\boldsymbol{U}}=\frac{1}{{n}}\int{G}{\boldsymbol{v}}\mathrm{d}{\boldsymbol{v}},\\ {T}_{tr} & =\frac{1}{3nk_B}\int{mG}{c}^2\mathrm{d}{\boldsymbol{v}}, \quad {T}_{rot}=\frac{2}{d_rnk_B}\int{R}\mathrm{d}{\boldsymbol{v}},\\ {\boldsymbol{q}}_{tr} & =\frac{1}{2}\int{mG}{c}^2{\boldsymbol{c}}\mathrm{d}{\boldsymbol{v}}, \quad {\boldsymbol{q}}_{rot}=\int{R}{\boldsymbol{c}}\mathrm{d}{\boldsymbol{v}}, \quad {p_{ij}}=\int{mG}{c_i}{c_j}\mathrm{d}{\boldsymbol{v}}. \end{aligned} \right\} \end{equation}
The total temperature  $T$, total pressure
 $p$ and its translational counterpart are
 ${T}=(3T_{tr}+d_rT_{rot})/(3+d_r)$,
 $p=nk_BT$ and
 $p_{tr}=nk_BT_{tr}$, respectively. It can be verified that (1.1) and (1.2) are satisfied in the kinetic model.
Considering the general expression of thermal conductivity coefficients (or Eucken factors equivalently) based on (2.4) and (2.6a,b), there are still two unknown values in relaxation rates  ${\boldsymbol {A}}$ even when both
 $f_{tr}$ and
 $f_{rot}$ have been fixed. This implies that the coefficients
 $\omega _0$ and
 $\omega _1$ in the kinetic model above, which is determined by the thermal conductivities, may not able to give a full recovery of all the transport information in molecular gases. Therefore, we modify the kinetic model by incorporating the relaxation rates
 ${\boldsymbol {A}}$ into the reference distribution functions as
 \begin{equation} \left. \begin{aligned} \boldsymbol{q}_0 & = \boldsymbol{q}_{tr}, \quad \boldsymbol{q}'_0 =\left[{-}3Z\left(A_{tt}-\frac{2}{3}\right)+1\right]\boldsymbol{q}_{tr}-3ZA_{tr}\boldsymbol{q}_{rot},\\ \boldsymbol{q}_1 & = 0, \quad \boldsymbol{q}'_1 ={-}Z\left[A_{rt}\boldsymbol{q}_{tr}+(A_{rr}-1)\boldsymbol{q}_{rot}\right], \end{aligned} \right\} \end{equation}
3.2. Numerical validation
Now we assess the accuracy of the kinetic model (3.1) with (3.2) and (3.6), by comparing its numerical solutions of a normal shock wave and thermal creep flow in nitrogen with the DSMC results. To make fair comparisons, the relaxation rates  $\boldsymbol {A}$ are equal to those extracted from the DSMC. Therefore, the collision number and relaxation rates take the values determined in § 2.3, and the rotational collision number in (3.1) is
 ${Z=2.6671}$ according to (2.2).
The obtained macroscopic flow quantities will be shown in non-dimensional values: the number density, temperature, spatial coordinate, velocity, pressure and heat flux are normalized by  ${n_0=2.69\times 10^{25}\ \mathrm {m}^{-3}}$,
 ${T_0=300}\ \textrm {K}$, the characteristic length
 ${L_0}$, the most probable speed
 ${v_m}=\sqrt {2k_BT_0/m}$,
 ${n_0k_BT_0}$ and
 ${{n_0k_BT_0}v_m}$, respectively. The Knudsen number is defined as
 \begin{equation} Kn=\frac{\mu(T_0)}{n_0L_0}\sqrt{\frac{\rm \pi}{2mk_BT_0}}. \end{equation}
3.2.1. Normal shock wave
First, we consider the normal shock wave when the Mach number is  ${Ma}=4$ and the upstream mean free path (
 $L_0=59.59\ \textrm {nm}$) is chosen as the characteristic length. The simulation domain used in both the kinetic model and DSMC is
 $30L_0$ in the
 $x$ direction with the wavefront in the centre of it, so that the equilibrium states determined by the Rankine–Hugoniot relation can be applied at both ends of the domain. The kinetic model equation is solved by the discretize velocity method with the fast spectral method dealing with its Boltzmann collision term (Wu et al. Reference Wu, White, Scanlon, Reese and Zhang2015). The entire domain is divided into 150 non-uniform cells, with more cells located around the shock centre. Additionally,
 $48\times 32\times 32$ discrete velocities, which are uniformly distributed within the range
 $[-7.5v_m,7.5v_m]$, are used. In the DSMC simulation, 360 uniform spatial cells with size of 5 nm are applied, and there are
 $7.2\times 10^5$ simulation particles in the whole computational domain. When the steady state is reached, by time averaging over 2500 sampling steps, we get the final results as the reference for comparison. The accuracy is guaranteed because the cell size is much smaller than the molecular mean free path and there are approximately 2000 simulation particles per cell.
Figure 2 compares the structures of the normal shock wave obtained from the kinetic model and the DSMC simulation. Good agreement in macroscopic quantities demonstrates the accuracy of the proposed kinetic model.
Comparison between the DSMC (circles) and the modified Wu model (lines) for a normal shock wave in nitrogen with  ${Ma}=4$. The macroscopic quantity
 ${Q}=\rho , u, T$ is normalized by
 ${(Q-Q_u)}/{(Q_d-Q_u)}$, where the subscripts
 ${u}$ and
 ${d}$ represent the upstream and downstream, respectively. Note that the shock wave is shifted so that the density at
 $x=0$ is
 $(\rho _d+\rho _u)/2$, and other profiles are shifted accordingly.

3.2.2. Creep flow driven by the Maxwell demon
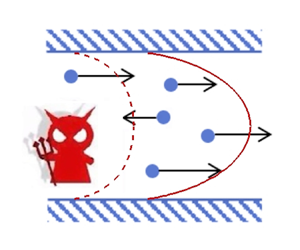
Second, we consider the microflow. In the thermal creep along an infinite channel, the gas flow is driven by a temperature gradient at the wall, which is equivalent to applying a small external acceleration. Here, as a thought test, we consider the creep flow driven by the Maxwell demon, where each molecule is subject to an external acceleration based on its kinetic energy:
 \begin{equation} a_y=a_0\left(\frac{v^2}{v^2_m}-\frac{3}{2}\right) \end{equation}
see figure 3. It can be seen that the direction of the acceleration is determined by the magnitude of molecular velocity. We solve this creep flow in a one-dimensional domain, which is bounded by two parallel walls with a fully diffuse boundary condition at the same temperature. Here, the characteristic length  $L_0$ is the distance between the walls and
 ${a_0}$ is a small value set by
 ${2{a_0}{L_0}/{v^2_m}=0.0718}$ to guarantee that the gas flow deviates slightly from the global equilibrium.
Comparison between the DSMC (markers) and the modified Wu model (lines) in the creep flow driven by the Maxwell demon. The velocity and heat flux are further normalized by the dimensionless acceleration 0.0718.

The modified Wu model is solved by the general synthetic iterative scheme (Su, Zhu & Wu Reference Su, Zhu and Wu2020; Su, Zhang & Wu Reference Su, Zhang and Wu2021). There are 100 spatial cells inside the computational domain, with more cells located in the vicinity of the solid walls to capture the Knudsen layer structure. Additionally,  $48\times 48\times 48$ non-uniformly distributed discrete velocities within the range
 $[-6v_m,6v_m]$ are applied, with dense velocity grids around zero velocity to capture the discontinuity of velocity distribution function therein. In the DSMC simulations, there are 100 uniform cells and
 $2\times 10^4$ simulation particles between two walls, and both time and ensemble averaging are used which include 10 independent runs with
 $2.5\times 10^6$ sampling times for each one.
The results of kinetic model and DSMC are compared in figure 3, for typical Knudsen numbers. It is observed that the flow velocity and heat fluxes obtained from the kinetic model are in good agreement with those from the DSMC. Furthermore, the rotational heat flux is negligibly small, when compared with the translational heat flux. This implies that the translational thermal conductivity plays the dominant role in the flow velocity in this problem.
4. Uncertainty quantification: rate effect of thermal relaxation
It can be learned from (2.4) that, even when the translational and rotational thermal conductivities (i.e.  $\kappa _{tr}$ and
 $\kappa _{rot}$) are determined, two elements in the matrix
 $\boldsymbol {A}$ remain unknown; and there will be three undetermined elements if only the total thermal conductivity is known as in many experiments. Here we investigate the effects of these uncertain values based on the modified Wu model, as the DSMC does not have the capability to adjust the thermal relaxation rates once the rotational collision number and Schmidt number are fixed. The uncertainties in rarefied gas flows will be quantified in the following two ways. First, we vary the values of
 ${A_{ij}}$ when the translational and rotational Eucken factors (i.e.
 ${f_{tr}}$ and
 ${f_{rot}}$) are given. Second, we fix the total Eucken factor
 ${f_{u}}$,
 $A_{tr}$ and
 $A_{rt}$, but vary the translational and rotational Eucken factors.
4.1. Normal shock wave
When  ${f_{tr}}$ and
 ${f_{rot}}$ are fixed on top of the fixed shear viscosity and bulk viscosity, the gas dynamics is uniquely determined in the continuum flow. However, different values of
 ${A_{ij}}$ could lead to different results in rarefied gas flows. The normal shock wave of nitrogen is first studied to demonstrate this uncertainty. Specifically,
 ${A_{tr}}$ and
 ${A_{rt}}$ are selected to vary within
 $[-5/6Z,0]$ and
 $[-1/3Z,0]$, respectively, while
 ${A_{tt}}$ and
 ${A_{rr}}$ are determined according to (2.4) and (2.6a,b) to recover the assigned values of
 $f_{tr}=2.365$ and
 $f_{rot}=1.435$. Given
 ${Z=2.6671}$, the considered minimum values of
 ${A_{rt}}$ and
 ${A_{tr}}$ are
 $-0.3124$ and
 $-0.1250$, respectively, which are approximately
 $1\sim 2$ times larger, in magnitude, than those extracted from the DSMC simulation in § 2.3.
Figure 4 shows the density, temperature and heat flux in the normal shock wave of Mach number  ${Ma}=4$, where the red solid lines illustrate the reference solutions with
 ${\boldsymbol {A}}$ extracted from the DSMC, while blue shaded regions show the divergences caused by the variations of
 ${\boldsymbol {A}}$. It can be seen that the variation of thermal relaxation rates slightly shifts the profiles of rotational temperature and heat fluxes, mainly in the regions
 $x\in [-2,-1]$ and
 $x\in [0.5,2]$. However, the thermal relaxation rates have almost no influence on the profiles of the density (hence velocity owing to mass conservation) and normal pressure (not shown here). Therefore, there is also little change in the thickness of the shock wave.
Influence of the thermal relaxation rates in a normal shock wave. The red solid lines are the results of the modified Wu model with  ${\boldsymbol {A}}$ extracted from DSMC, while the blue shaded regions show the results from the modified Wu model, with
 ${A_{rt}}\in [-0.3124,0.0]$,
 ${A_{tr}}\in [-0.1250,0.0]$,
 $f_{tr}=2.365$ and
 $f_{rot}=1.435$.

Now we consider different values of  $f_{tr}$ and
 $f_{rot}$, but a fixed value of total thermal conductivity. Figure 5 summarizes the numerical results from the modified Wu model with
 ${f_{tr}=1.5, 2.0, 2.5}$, while
 $A_{tr}$ and
 $A_{rt}$ take the values of
 ${-5/6Z}$ and
 ${-1/3Z}$, respectively. Note that small values of
 $f_{tr}$ are possible, especially in polar gases where the translational Eucken factor can be much smaller than 2.5, e.g.
 $f_{tr}=1.78$ for water and
 $f_{tr}=0.41$ for
 $\mathrm {CH}_3\mathrm {OH}$ (Mason & Monchick Reference Mason and Monchick1962). Significant discrepancies in macroscopic quantities with different values of
 $f_{tr}$ are observed, especially in the profiles of temperature. First, larger
 ${f_{tr}}$ makes the translational temperature rise earlier to its maximum value, and then decrease faster to the equilibrium value downstream; the same trend is also observed in the deviation pressure
 \begin{equation} P_{xx}=\frac{m}{2}\int{\left(c_x^2-\frac{c^2}{3}\right)Gd\boldsymbol{v}}, \end{equation}
and the magnitude of total heat flux. Second, the influence of Eucken factors on the rotational temperature, however, concentrates around the centre of the shock structure: lower  ${f_{tr}}$ and hence higher
 $f_{rot}$ result in larger rotational temperature. Third, larger
 ${f_{tr}}$ results in a faster rise of density.
Influence of the translational Eucken factor in normal shock waves. All cases have the same total Eucken factor  ${f_{u}}$, but the translational Eucken factor
 $f_{tr}$ for the green dash-dot, blue dashed and red solid lines are 1.5, 2 and 2.5, respectively; the rotational Eucken factor is changed accordingly to make
 $f_u$ fixed. The modified Wu model is used.

4.2. Creep flow driven by the Maxwell demon
The same sets of values of  ${\boldsymbol {A}}$ in normal shock wave cases are used here to study the influence on the velocity and heat flux in the creep flow driven by the Maxwell demon, and the results with
 ${Kn=0.2}$ are shown in figure 6 when
 $f_{tr}$ and
 $f_{rot}$ are fixed. In contrast to the situations in a normal shock wave, a significant variation in the results with different relaxation rates
 ${\boldsymbol {A}}$ is observed: the maximum relative uncertainty is
 $16.7\,\%$ and
 $17.6\,\%$ for the velocity and translational heat flux, respectively. Meanwhile, it is seen that the uncertainty occurs in the middle part of the creep flow, while the velocity slip and heat flux in the vicinity of the wall rarely change.
Influence of the thermal relaxation rates in the creep flow driven by the Maxwell demon. Red solid lines are the results with  ${\boldsymbol {A}}$ obtained from the DSMC, the blue shaded region shows the results from the modified Wu model, with
 ${A_{rt}}\in [-0.3124,0.0]$ and
 ${A_{tr}}\in [-0.1250,0.0]$. Other parameters are
 ${Kn=0.2}$,
 $f_{tr}=2.365$ and
 $f_{rot}=1.435$.

To further investigate the influence of the translational Eucken factor,  ${f_{tr}=1.5, 2.0, 2.5}$ are considered in the modified Wu model with
 ${Kn=0.2}$ and
 $f_u=1.993$, while
 $A_{tr}$ and
 $A_{rt}$ take the values of
 ${-5/6Z}$ and
 ${-1/3Z}$, respectively. As shown in figure 7, both the velocity and translational heat flux vary significantly with
 ${f_{tr}}$: the values of velocity and translational heat flux of
 ${f_{tr}=2.5}$ are
 ${68\,\%}$ larger than those of
 ${f_{tr}=1.5}$. In contrast to the results in figure 6, where the velocity slip and heat flux around the solid wall do not change with fixed
 ${f_{tr}}$, figure 7 shows a significant dependence of the velocity and heat flux on
 ${f_{tr}}$, i.e. both velocity and heat flux on the walls increase with
 ${f_{tr}}$. Thus, it can be concluded that the translational Eucken factor
 ${f_{tr}}$ plays a dominant role in this problem.
Influence of the translational Eucken factor in the creep flow driven by the Maxwell demon. All cases have the same total Eucken factor  ${f_{u}}$ and
 ${Kn=0.2}$, while the translational Eucken factor
 $f_{tr}$ for the green dash-dot, blue dashed and red solid lines are 1.5, 2.0 and 2.5, respectively. The modified Wu model is used.

The importance of the translational Eucken factor in this problem can be understood as follows. It can be seen from (1.2) that the elements  ${A_{tr}}$ and
 ${A_{rt}}$ are related to the energy exchange between the translational and rotational motions. Therefore, when
 ${A_{tr}}$ (or
 ${A_{rt}}$) is zero, the relaxation of the translational (or rotational) heat flux will not be affected by the other one. For instance, by varying
 ${\boldsymbol {A}}$, it is found that when
 ${A_{rt}=0}$, the rotational heat flux is always zero. The reason is that in the creep flow driven by the Maxwell demon, only translational energy is changed directly by the external driving force, thus the rotational energy and flux are only affected via the energy exchange, which are determined by
 ${A_{tr}}$,
 ${A_{rt}}$ and
 $Z$. Because
 ${A_{rt}}$ is very small compared with the other three relaxation rates in the matrix
 ${\boldsymbol {A}}, \boldsymbol {q}_{rot}\approx 0$ and
 $\boldsymbol {q}_{tr}$ (or
 $f_{tr}$) is dominant.
4.3. Thermal transpiration in a cavity
Thermal transpiration is a classical phenomenon that has many applications, such as the Knudsen pump (Vargo et al. Reference Vargo, Muntz, Shiflett and Tang1999), where the mass flow and pressure difference are the quantities of interest. To study this problem, a two-dimensional cavity with an aspect ratio of 5 is considered. The temperature of the left and right walls are  $200\, ^{\circ }\textrm {C}$ and
 $400\, ^{\circ }\textrm {C}$, respectively, while the temperature of the horizontal walls increases linearly from
 $200\,^{\circ }\textrm {C}$ to
 $400\, ^{\circ }\textrm {C}$. Owing to symmetry, only the lower half of the cavity is simulated, and the results of
 ${Kn=0.5959}$ are shown in figure 8. At the initial stage, owing to the thermal transpiration, the gas molecules are moved towards the hot ends by the temperature gradient along the solid surfaces, which increases the pressure there. As a consequence, the pressure driven flow is formed in the opposite direction and several vortices are eventually generated in the steady state. Comparisons in the flow velocity and normal pressure in figure 8(a,b) support that the modified Wu model can give good agreement with DSMC simulations.
Comparison between the DSMC and the modified Wu model in the thermal transpiration inside a closed cavity. (a) Horizontal velocity. Solid lines are results from the kinetic model, while dots are from the DSMC. (b) Normal pressure  $P_{xx}=({m}/{2})\int {c_x^2Gd\boldsymbol {v}}$ along
 ${y=0.5}$. (c) Flow field in the lower half of the cavity; from top to bottom, the translational Eucken factors are
 ${f_{tr}=2.37, 2.0, 1.75}$, respectively.

Similar to the one-dimensional creep flow, the flow fields are expected to be determined by  ${f_{tr}}$ other than
 ${f_{u}}$ in thermal transpiration, where both the normal pressure and the velocity magnitude increase with
 ${f_{tr}}$, see figure 8(b,c). Therefore, the mass flow rate follows the same trend. For the situations with small
 ${f_{tr}}$, which may happen for some polar molecular gases, the flow pattern and flow rate could be very different from those of non-polar molecular and monatomic gases.
4.4. Uncertainty in different flow regimes
In the above cases, the gas flows are in the transition regime, for example,  $Kn=0.2$ in the creep flow driven by the Maxwell demon. In this section, we investigate the uncertainties of thermal relaxation rates when the gas flow is in the near-continuum and free molecular regimes. To this end,
 $Kn=0.001, 0.1, 10$ are considered for the case of creep flow driven by Maxwell's demon, and the translational Eucken factors are
 ${f_{tr}=1.5, 2.0, 2.5}$ with
 ${f_{u}=1.993}$. The thermal relaxation rates
 $\boldsymbol {A}$ are chosen in the same way as that in § 4.2.
Both the velocity and heat flux distribution are examined in figure 9. In the near-continuum regime with  $Kn=0.001$, the thickness of Knudsen layers becomes negligible and the velocity and heat flux are uniformly distributed in the bulk regime. However, the difference caused by different values of
 ${f_{tr}}$ is still significant. Specifically, the magnitude of velocity and translational heat flux increases by
 $77.3\,\%$ and
 $73.6\,\%$ when
 ${f_{tr}}$ is changed from 1.5 to 2.5. However, it should be noted that although the relative error is large, the variation of thermal relaxation rates in
 $\boldsymbol {A}$ is not so important because the flow velocity and heat flux approaches zero along with the Knudsen number.
Influence of the Knudsen number  $Kn$ in the creep flow driven by Maxwell's demon. All cases have the same
 ${f_{u}}$, while
 $f_{tr}$ for green dash-dot, blue dashed and red solid lines are 1.5, 2.0 and 2.5, respectively. Additionally, the Knudsen number are 0.001, 0.1 and 10 from (a,d), (b,e) and (c,f), respectively.

When  $Kn=0.1$, the variations of velocity and heat flux caused by different
 ${f_{tr}}$ are approximately the same as those when
 $Kn=0.001$, which are
 $76.1\,\%$ and
 $72.3\,\%$ when
 ${f_{tr}}$ changes from 1.5 to 2.5. However, the magnitudes of these macroscopic quantities increase by 100 times, compared with those when
 $Kn=0.001$. This implies a roughly linear dependence of the Knudsen number. It can be concluded that the rarefaction effects disappear gradually when the system approaches the continuum limit, while the relative uncertainty becomes even larger instead.
However, at large Knudsen numbers (e.g.  $Kn=10$), the magnitudes of the velocity and heat flux become even larger, but the relative uncertainty caused by the changing of
 ${f_{tr}}$ reduces to
 $7.4\,\%$ and
 $7.3\,\%$ for the velocity and translational heat flux, respectively. This is comprehensible, because the effect from collisions between gas molecules is weakened when
 $Kn$ approaches infinity. Therefore, the uncertainty caused by the thermal relaxation rates of collision becomes negligible at large
 $Kn$, though the rarefaction effect is more significant at this regime.
Based on these results, we conclude that the uncertainties in thermal relation rates are only important in the transition flow regime, where, roughly,  $0.01\precapprox {Kn}\precapprox 10$.
5. Conclusions
In summary, the relaxation rates of translational and rotational heat fluxes play an important role in rarefied flows of molecular gas. Because in experiment only the translational and rotational thermal conductivities are measured (in most cases only the total thermal conductivity is known), there are two (three) underdetermined coefficients. For the first time, these uncertainties are properly quantified in this paper. First, a kinetic model which is able to describe the relaxations of energy and heat fluxes is designed. Second, the kinetic model is validated by the DSMC method with the Borgnakke–Larsen collision rule, which can only reflect some fixed values of relaxation. Finally, by varying the thermal relaxation rates in the modified Wu model, we study the influence of thermal relaxation rates on the normal shock wave structures, the creep flow driven by Maxwell's demon and the thermal transpiration in a cavity.
This work demonstrates the importance to obtain exact values of the thermal relaxation rates used in the kinetic model for rarefied gas flow simulations, and to develop a better collision model in DSMC that is able to recover realistic relaxation rates. Research in this direction will help to build correct models for thermal conductivity of molecular gas, especially for molecular gas mixtures and non-equilibrium chemical reactions. In the future work, we plan to investigate whether the molecular dynamics simulation can be used to reduce or remove the uncertainties.
Acknowledgements
This work is supported by the UK's Engineering and Physical Sciences Research Council under grant EP/R041938/1, and Guangdong-Hong Kong-Macao Joint Laboratory for Data-Driven Fluid Mechanics and Engineering Applications in China under grant 2020B1212030001.
Declaration of interests
The authors report no conflict of interest.
Appendix A. The Schmidt number and internal thermal conductivity
The internal thermal conductivity is related to the diffusion coefficient, or the Schmidt number. This can be understood approximately from the simple kinetic theory, although more accurate calculation of transport coefficients, however, should be based on the Chapman–Enskog expansion (Mason & Monchick Reference Mason and Monchick1962). Considering the simplest case where the translational and internal energies do not exchange, every molecule travels with the average speed  $\bar {c}$ and the number density of molecules travels in the positive x-direction is
 $n/6$. Within one mean free path
 $\lambda$, there is no collision, therefore, the number flux is
 \begin{equation} J=\frac{\bar{c}}{6}n(x-\lambda)-\frac{\bar{c}}{6}n(x+\lambda) \approx{-}\frac{\bar{c}}{3}\lambda\frac{\textrm{d}n}{\textrm{d}x}. \end{equation}
Thus, the diffusion coefficient is
 \begin{equation} D=\frac{\bar{c}}{3}\lambda. \end{equation}
Similarly, the rotational heat flux is
 \begin{equation} q_{rot}=\frac{mn\bar{c}}{6} \left[\frac{d_r}{2}\frac{k_B}{m}T(x-\lambda) -\frac{\textrm{d}_r}{2}\frac{k_B}{m}T(x+\lambda)\right] \approx{-}\frac{nk_Bd_r\bar{c}}{6}\lambda\frac{\partial T}{\partial x}, \end{equation}
which gives the expression for the rotational thermal conductivity
 \begin{equation} \kappa_{rot}=\frac{nk_Bd_r\bar{c}}{6}\lambda. \end{equation}
Therefore, we have
 \begin{equation} {\kappa_{rot}}=\frac{\mu{}k_Bd_r}{2m}\times\frac{\rho{}D}{\mu}=\frac{\mu{}k_Bd_r}{2m}\times\frac{1}{Sc}. \end{equation}
Based on (2.4), it can be seen that if there is no cross-exchange coefficients, we have
 \begin{equation} \kappa_{rot}=\frac{\mu{}k_B{d_r}}{2m}\times\frac{1}{A_{rr}}. \end{equation}
Therefore, in § 2.3, it is stated that  $A_{rr}=Sc$ when
 $Z_{{DSMC}}$ is large (i.e. effectively no exchange of translational and internal energies).



