Introduction
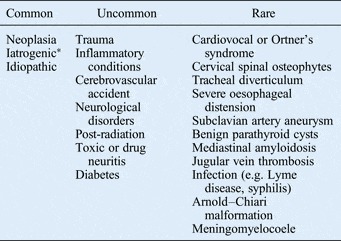
Vocal fold paralysis is defined as the loss of normal adduction and/or abduction of the vocal folds. Paralysis is due to the dysfunction of the motor innervation of the larynx, which is supplied by two branches of the vagus nerve: the superior and the recurrent laryngeal nerve (RLN). Neck surgery and tumours involving the RLN are the most common causes of vocal fold paralysis, whereas nearly a third of cases are reported as being idiopathic.Reference Myssiorek1–Reference Chen, Jen, Wang, Lee and Lin6 Fairly common causes include: trauma, endotracheal intubation, inflammatory conditions, benign neck and thyroid masses, radiation, toxic or drug-induced neuritis, skull base tumours, cerebrovascular disease, and other neurological disorders (Table I).Reference Myssiorek1–Reference Lin, Jen and Lin7
Aetiology of vocal fold paralysis

*Post-surgery
Cross-sectional imaging can help detect many of these causes and is usually used in the investigation of vocal fold palsy. This article aimed to highlight the uncommon and rare causes of vocal fold paralysis that can be detected (and thus diagnosed) on cross-sectional imaging.
Imaging and anatomy
In about 30 per cent of patients with vocal fold paralysis, the cause can be diagnosed on the basis of trauma or surgical history alone.Reference Richardson and Bastian8 In the remaining cases, cross-sectional imaging plays an integral role in establishing aetiology by detecting pathology along the course of the vagus nerve or RLNs.
Given only a clinical history of vocal fold immobility, with no associated palatal, pharyngeal or other cranial neuropathy symptoms, contrast-enhanced computed tomography (CT) extending from the skull base to the tracheal carina is the imaging modality of choice. This exploration has high sensitivity in terms of detecting space-occupying lesions involving the pathway of the vagus nerve and RLNs.Reference Song, Jun, Cho, Lee, Kim and Park9 Magnetic resonance imaging (MRI) can also be used, but may not be adequate in demonstrating thoracic or bony pathology.
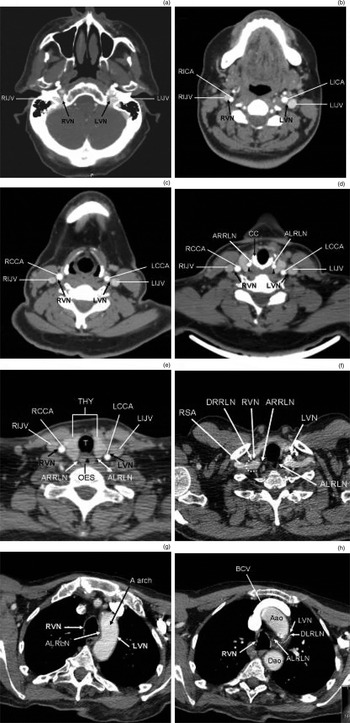
The vagus nerve course is evaluated from its cranial exit via the jugular foramen (along the neck) within the carotid sheath, behind and between the internal jugular vein and the common carotid artery. The RLN course differs depending on the side. On the right, the RLN originates at the level of the subclavian artery and loops underneath it. On the left, the RLN originates at the level of the aortic arch and loops under it through the aorto-pulmonary window. After their loops, both RLNs run upwards to reach their respective tracheoesophageal groove. In their ascending course, the RLNs are intimately associated with the thyroid gland, before entering the larynx just behind the articulation of the posterior cornu of thyroid cartilage with the cricoid cartilage (Figure 1).Reference Myssiorek1–Reference Van der Goten4, Reference Larson, Aulino and Laine10–Reference Garcia, Magalhães, Dadalto and de Moura14
Axial, contrast-enhanced computed tomography images showing normal pathways of the vagus nerve and recurrent laryngeal nerves (RLNs) at the level of: (a) skull base, (b) oropharynx, (c) hypopharynx and larynx, (d) larynx, (e) thyroid gland, (f) thoracic inlet, (g) aortic arch and (h) aorto-pulmonary window. RIJV = right internal jugular vein; RVN = right vagus nerve; LVN = left vagus nerve; LIJV = left internal jugular vein; RICA = right internal carotid artery; LICA = left internal carotid artery; RCCA = right common carotid artery; LCCA = left common carotid artery; ARRLN = ascending right RLN; CC = cricoid cartilage; ALRLN = ascending left RLN; Thy = thyroid; OES = oesophagus; RSA = right subclavian artery; DRRLN = descendant right RLN; A arch = aortic arch; BCV = brachiocephalic vein; Aao =ascending aorta; DLRLN = descendant left RLN; Dao = descending aorta

If the vocal fold paralysis is associated with symptoms such as dysphagia or with other cranial neuropathies, a high vagal lesion in the upper neck or skull base must be suspected. In these cases, contrast-enhanced MRI of the skull base and neck is recommended. This imaging modality is (compared with CT) better able to differentiate soft tissue.Reference Becker, Mafee, Valvassori and Becker3, Reference Van der Goten4, Reference Richardson and Bastian8 If contrast-enhanced MRI shows no abnormality associated with the clinical picture, high resolution CT of the temporal bone and skull base should be performed to exclude the possibility of bony lesions not detected by MRI.Reference Richardson and Bastian8
Uncommon and rare causes of vocal fold paralysis
These include cardiovocal or Ortner's syndrome, cervical spinal osteophytes, tracheal diverticulum, severe oesophageal distension, subclavian artery aneurysm, benign parathyroid cysts, mediastinal amyloidosis, and jugular vein thrombosis (Table I).Reference Bickle, Kelly and Brooker15–Reference Virk, Majithia, Lingam and Singh32
This review is composed of case histories of the uncommon and rare causes of vocal fold palsy that can be detected on cross-sectional imaging, and demonstrates the radiological features that form the diagnosis.
Cardiovocal or Ortner's syndrome
Mitral valve stenosis with left atrial enlargement
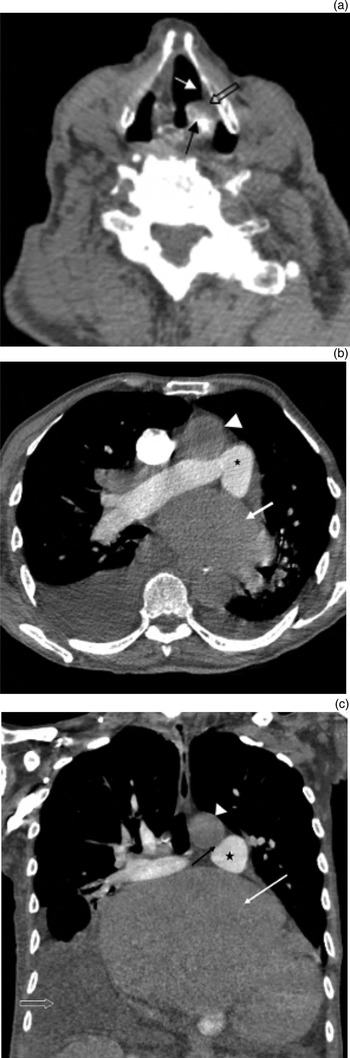
A 90-year-old male patient was referred to the out-patients clinic with a long history of hoarseness and dysphonia. Flexible nasopharyngolaryngoscopy revealed a fixed left vocal fold in a paramedian position. Contrast-enhanced CT of the neck and upper chest was performed. The images of the larynx revealed thickening of the ipsilateral aryepiglottic fold, enlargement of the left laryngeal ventricle, and anteromedial positioning of the ipsilateral arytenoid cartilage, all of which were in keeping with left vocal fold paralysis (Figure 2a). The CT images of the thorax showed severe left atrial enlargement with mitral valve calcification. The enlarged left atrium was displacing the pulmonary artery upwards and anteriorly, resulting in diminishment of the space between the pulmonary artery and the aorta (Figures 2b and 2c), and hence compressing the left RLN in the aorto-pulmonary window.
(a) Axial, contrast-enhanced computed tomography (CT) image showing: enlargement of the left laryngeal ventricle (white arrow), thickening of the ipsilateral aryepiglottic fold (hollow arrow) and antero-medial positioning of the ipsilateral arytenoid cartilage (black arrow). Axial (b) and coronal (c), contrast-enhanced CT images showing an enlarged left atrium (white arrow in b and c) displacing the pulmonary artery upwards and anteriorly (asterisk in b and c), resulting in reduced space between the pulmonary artery and aorta (arrowhead in b and c); this represents cardiovocal syndrome in the aorto-pulmonary window (black arrow in c).

Pseudoaneurysm of the aortic arch
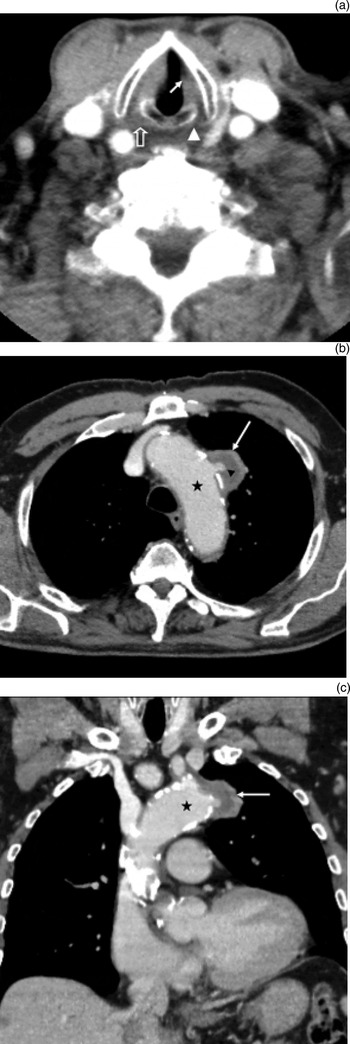
A 79-year-old male patient with a history of hypertension and arteriosclerosis presented with hoarseness of voice, which was sudden in onset. Flexible nasopharyngolaryngoscopy indicated left vocal fold paralysis. Contrast-enhanced CT of the neck and thorax was performed. The examination demonstrated a 31 mm saccular pseudoaneurysm of the aortic arch (Figures 3b and 3c). The location of the pseudoaneurysm, within the course of the left RLN, was the cause of the left vocal fold paralysis. On imaging, this was indicated by the decreased size and density of the left true vocal fold, and the thinning of the left posterior cricoarytenoid muscle (Figure 3a).
(a) Axial, contrast-enhanced computed tomography (CT) image showing diminished size of the left thyroarytenoid muscle (true vocal fold) with decreased density (white arrow) compared with the opposite side, in keeping with fatty atrophy. The posterior cricoarytenoid muscle on the involved side (arrowhead) is thinner than that on the normal side (hollow arrow), secondary to denervation atrophy. Axial (b) and coronal (c), contrast-enhanced CT images showing a saccular pseudoaneurysm (white arrow in b and c) of the aortic arch (asterisk in b and c) in the course of the left vagus nerve.

These two cases represent cardiovocal or Ortner's syndrome. This is a rare clinical condition characterised by vocal fold paralysis resulting from cardiovascular disease.Reference Chen, Jen, Wang, Lee and Lin6, Reference Ong and Chong11, Reference Bickle, Kelly and Brooker15–Reference Gupta, Vishvkarma and Shandilya21 Specifically, RLN injury is secondary to compression caused by changes in the anatomy of the heart or great vessels.Reference Annema, Brahim and Rabe16
This syndrome was first described in 1897 by Ortner in three patients with mitral valve stenosis and subsequent left atrial enlargement.Reference Ortner17 Since then, various authors have reported cases of cardiovocal syndrome associated with different underlying cardiovascular disorders such as atrial septal defect, cor pulmonale, mitral valve prolapse, cardiac tamponade, pulmonary hypertension and various types of aortic aneurysms.Reference Chen, Jen, Wang, Lee and Lin6, Reference Bickle, Kelly and Brooker15–Reference Gupta, Vishvkarma and Shandilya21 In cases of left atrial enlargement, there is compression of the left RLN as it loops around the aortic arch and passes through the narrowed aorto-pulmonary window.Reference Ortner17–Reference Morgan and Mourant19 In cases of aortic arch aneurysms (both true aneurysms and pseudoaneurysms), the injury is secondary to direct compression of the left RLN.Reference Bickle, Kelly and Brooker15, Reference Annema, Brahim and Rabe16, Reference Subramaniam, Adarsha Herle, Mohammed and Thahir18, Reference Gupta, Vishvkarma and Shandilya21 Five per cent of thoracic aortic aneurysms present clinically with hoarseness secondary to RLN paralysis.Reference Bickle, Kelly and Brooker15
Cervical spinal osteophytes
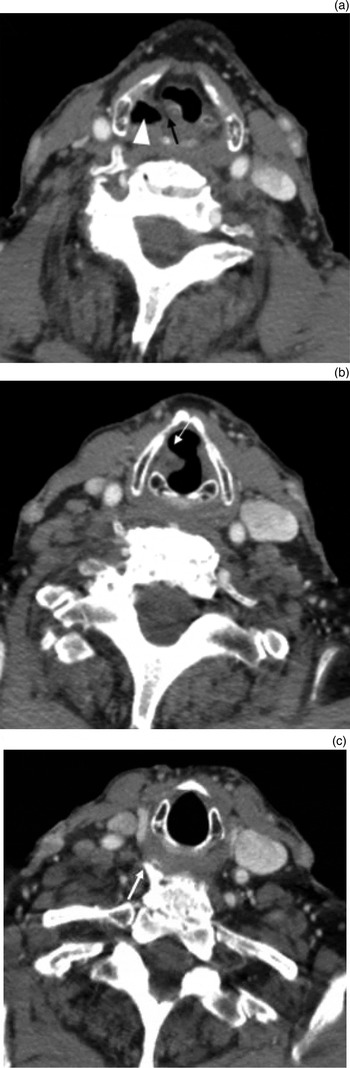
A 92-year-old male presented with a 3-month history of hoarseness of voice, which had deteriorated gradually.Reference Virk, Majithia, Lingam and Singh32 Fibre-optic laryngoscopy revealed immobility of the paramedian right vocal fold. Contrast-enhanced CT of the neck and upper thorax was performed. This demonstrated age-related degenerative changes in the cervical spine, with a prominent anterior, right-sided osteophyte at the level of C6–C7, which was protruding into the line of the right RLN (Figure 4c).Reference Virk, Majithia, Lingam and Singh32 Images at the level of the hypopharynx and larynx revealed: thickening and medial positioning of the right aryepiglottic fold, enlargement of the ipsilateral piriform sinus, and a flaccid atrophic right vocal fold with secondary enlargement of the ipsilateral laryngeal ventricle. These features were in keeping with right vocal fold paralysis (Figures 4a and 4b).Reference Virk, Majithia, Lingam and Singh32
Axial, contrast-enhanced computed tomography images showing: (a) thickening and medial positioning of the right aryepiglottic fold (black arrow), and enlargement of the piriform sinus (arrowhead); (b) flaccid atrophic right vocal fold with secondary enlargement of the laryngeal ventricle (white arrow); and (c) soft tissue and bone windows revealing a prominent anterior right-sided cervical osteophyte (white arrow), protruding in the line of the right recurrent laryngeal nerve along its pathway. Adapted with permission.Reference Virk, Majithia, Lingam and Singh32

Large anterior cervical spinal osteophytes can occasionally cause vocal fold paralysis via extrinsic compression or impingement of the RLN. Some authors have previously reported this association.Reference Yoskovitch and Kantor22, Reference Aydin, Ulug and Simsek23, Reference Virk, Majithia, Lingam and Singh32 The most common location for compression of the RLN by osteophytes is behind the inferior cornu of the thyroid cartilage, near the cricothyroid articulation.Reference Aydin, Ulug and Simsek23
Tracheal diverticulum
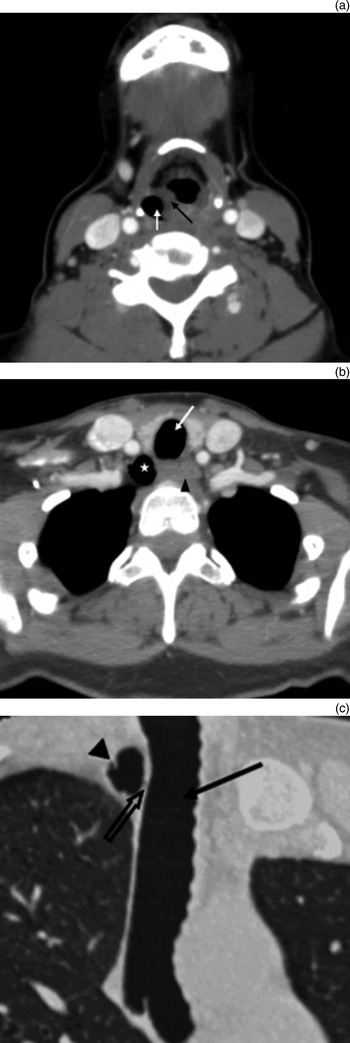
A 49-year-old female presented with a 1-month history of voice hoarseness. Flexible nasendoscopy demonstrated right vocal fold paralysis. Contrast-enhanced CT images of the neck and upper thorax revealed a 13 mm, air-filled structure on the right posterolateral aspect of the trachea, which demonstrated a small connection to the tracheal lumen (Figures 5b and 5c). This feature was consistent with a tracheal diverticulum in the line of the right RLN in the tracheoesophageal groove. The resulting vocal fold paralysis was revealed on imaging by right aryepiglottic fold thickening and enlargement of the ipsilateral piriform sinus (Figure 5a).
Axial, contrast-enhanced computed tomography (CT) images showing: (a) thickening of the right aryepiglottic fold (black arrow) and enlargement of the ipsilateral piriform sinus (white arrow), and (b) air-filled structure (asterisk) on the right postero lateral side of the trachea (white arrow) and on the right side of the oesophagus (arrowhead). (c) Coronal, oblique reconstruction of contrast-enhanced CT with lung window setting showing connection (hollow arrow) between the tracheal diverticulum (arrowhead) and the tracheal lumen (black arrow).

A tracheal diverticulum is a benign condition characterised by an outpouching of the trachea, secondary to congenital or acquired weakness of the tracheal wall.Reference Caversaccio, Becker and Zbären24, Reference Kokkonouzis, Haramis, Kornezos, Moschouris, Katsenos and Bouchara33, Reference Bodet Agustí, Martínez Vecina, Romeu Figuerola and Monzón Gaspà34 It is an uncommon entity usually found in post-mortem examinations, with a prevalence of 1 per cent reported in an autopsy series.Reference Caversaccio, Becker and Zbären24, Reference Kokkonouzis, Haramis, Kornezos, Moschouris, Katsenos and Bouchara33, Reference Bodet Agustí, Martínez Vecina, Romeu Figuerola and Monzón Gaspà34 The condition is commonly asymptomatic. However, it may act as a reservoir for secretions, and manifest as chronic cough, repetitive episodes of respiratory infections, haemoptysis, stridor or dyspnoea.Reference Caversaccio, Becker and Zbären24, Reference Kokkonouzis, Haramis, Kornezos, Moschouris, Katsenos and Bouchara33, Reference Bodet Agustí, Martínez Vecina, Romeu Figuerola and Monzón Gaspà34 The diverticulum may also produce a mass effect on the RLN. To our knowledge, there has only been one case of tracheal diverticulum causing vocal fold paralysis reported.Reference Caversaccio, Becker and Zbären24 On CT, a tracheal diverticulum appears as an air-filled paratracheal structure, with connection to the tracheal lumen. In most cases, it is located at the right posterolateral aspect of the trachea.Reference Caversaccio, Becker and Zbären24, Reference Kokkonouzis, Haramis, Kornezos, Moschouris, Katsenos and Bouchara33, Reference Bodet Agustí, Martínez Vecina, Romeu Figuerola and Monzón Gaspà34 The differential diagnosis of an air-filled paratracheal structure includes laryngocoele, pharyngocoele, oesophageal diverticulum, apical hernia of the lungs and apical paraseptal bullae.Reference Kokkonouzis, Haramis, Kornezos, Moschouris, Katsenos and Bouchara33
Tortuous oesophagus
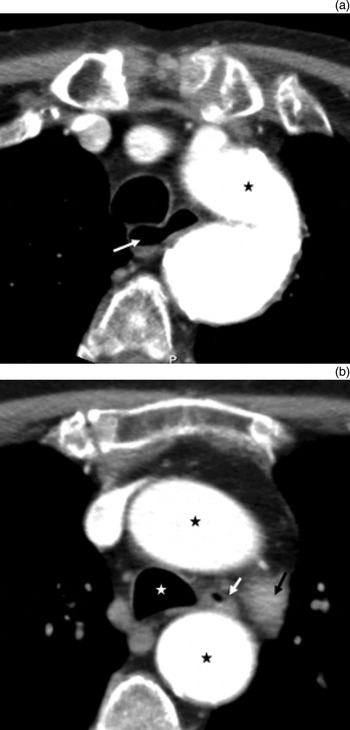
A 98-year-old male patient presented with hoarseness of voice. Fibre-optic laryngoscopy showed left vocal fold paresis. Contrast-enhanced CT of the neck and upper chest was performed. This demonstrated an unusually tortuous thoracic oesophagus coursing in the aorto-pulmonary window. This was likely to have been compressing the left RLN, resulting in vocal fold paralysis (Figure 6). In addition, the aorto-pulmonary window was narrow and tight secondary to an ectatic aortic arch. Gross distension of the cervical oesophagus secondary to achalasia has been reported to be the cause of compression of both RLNs, resulting in bilateral vocal fold paralysis.Reference Wickramasinghe, Chowdhury, Pillai and Ghosh25, Reference Chegar and Emko26 However, to the best of our knowledge, RLN paralysis caused by a non-dilated, tortuous oesophagus has not been previously reported in the literature.
Axial, contrast-enhanced computed tomography images showing an unusually tortuous thoracic oesophagus (white arrow in a and b) coursing between the aorta (black asterisk(s) in a and b) and the pulmonary artery (black arrow in b). White asterisk = trachea

Conclusion
Cross-sectional imaging, typically CT, can detect some of the uncommon and rare causes of vocal fold paralysis. Both radiologists and clinicians should trace the route of the vagus nerve and its laryngeal branches on imaging, and be aware of the various causes of vocal fold paralysis, including the uncommon and rare causes, when making their diagnosis.
Acknowledgement
The stay of BSG in the Department of Radiology of North West London Hospitals NHS Trust was supported by the European Society of Radiology (ESR)/European School of Radiology (ESOR) Exchange Programme for Head and Neck Imaging Fellowship.