Introduction
Oats (Avena sativa L.), a biennial grass in the Poaceae family, rank as the seventh most widely produced crop worldwide, following maize, rice, wheat, barley, sorghum, and millet (www.fao.org; accessed January 2025). The genus Avena comprises species with diploid, tetraploid, and hexaploid genomes (Rines et al. Reference Rines, Molnar, Tinker and Phillips2006; Carlson et al. Reference Carlson, Fiedler, Naraghi, Nazareno, Ardayfio, McMullen and Kianian2023). Among them, the hexaploid species A. sativa is predominantly cultivated. Other species, such as A. byzantina and A. strigosa, are occasionally utilized in specific regions for food or fodder purposes. Oat grains are rich in β-glucan and dietary fiber, and the plant is tender and highly palatable to animals, making it suitable for both human consumption and animal feed (Al-Ajmi and Al-Refai Reference Al-Ajmi and Al-Refai2020; Carlson et al. Reference Carlson, Fiedler, Naraghi, Nazareno, Ardayfio, McMullen and Kianian2023). Historically, oats have been one of the seven major globally cultivated crops, but their production areas have decreased in recent decades. Nonetheless, oats have recently regained attention owing to their nutritional value (Tang et al. Reference Tang, Yan, Wang, Li, Wei, Ren, Zhao and Peng2014). Despite this increased interest, research and interest in oats are still limited compared to other major crops such as wheat, barley, and rice.
Genetic resources play a crucial role in plant breeding as they provide a diverse gene pool. Phenotypic evaluation of genetic resources is essential not only for breeding purposes but also for maintaining genetic diversity and ensuring efficient resource management. Previous studies on oat genetic resources have been conducted at the global level (Peltonen-Sainio Reference Peltonen-Sainio1990; Vilaró et al. Reference Vilaró, Rebuffo, Miranda, Pritsch and Abadie2004; Vaisi and Golparvar Reference Vaisi and Golparvar2013; Sheikhehpour et al. Reference Sheikhehpour, Bahraminejad and Cheghamirza2014; Tang et al. Reference Tang, Yan, Wang, Li, Wei, Ren, Zhao and Peng2014; Boczkowska et al. Reference Boczkowska, Łapiński, Kordulasińska, Dostatny and Czembor2016; Nikoloudakis et al. Reference Nikoloudakis, Bladenopoulos and Katsiotis2016; Arora et al. Reference Arora, Sood, Chaudhary, Banyal, Kumar, Devi, Kumari and Yograj2021; Ihsan et al. Reference Ihsan, Nazir, Ghafoor, Khalil, Zahoor, Nisar, Khames, Ullah and Shah2021; Carlson et al. Reference Carlson, Fiedler, Naraghi, Nazareno, Ardayfio, McMullen and Kianian2023; Uddin et al. Reference Uddin, Babar, Harrison, Fatema and Khan2023). However, a phenotypic assessment of oat genetic resources from various origins under South Korean environmental conditions has not been conducted yet.
In Korea, studies on oats have been limited. For example, Lee et al. (Reference Lee, Yoon, Lee, Oh, Rauf, Hur, Ro, Yi, Hyun, Cho, Ko and Cho2019) evaluated the characteristics of oat genetic resources from Korea, China, and Japan by analyzing traits such as days to heading (DTH), plant height (PH), days to maturity, ear length and 100-seed weight. They also analyzed nutritional elements such as β-glucan, protein, lipid, and fiber. Additionally, Kim et al. (Reference Kim, Shin, Kim, Kwon, Park, Hyun, Kim, Oh and Park2018) investigated the nutritional aspects of Korean oat varieties, focusing on β-glucan, protein, and lipid. For this reason, this study aimed to evaluate the phenotypes of genetic resources of diverse origins and further analyze seven key phenotypic traits, such as DTH, PH, and grain characteristics. The primary objective was to evaluate the genetic diversity of oats and identify their potential as breeding materials from the perspective of food and feed purposes and Korean environmental adaptability.
Multivariate methods were commonly employed in similar studies, such as those by Kim et al. (Reference Kim, Sohn, Hong, Lee, Kim, Suh, Nam, Chang, Park and Kim2020) on buckwheat and by Sheikhehpour et al. (Reference Sheikhehpour, Bahraminejad and Cheghamirza2014), Tang et al. (Reference Tang, Yan, Wang, Li, Wei, Ren, Zhao and Peng2014), Nikoloudakis et al. (Reference Nikoloudakis, Bladenopoulos and Katsiotis2016) and Ihsan et al. (Reference Ihsan, Nazir, Ghafoor, Khalil, Zahoor, Nisar, Khames, Ullah and Shah2021) on oats. Multivariate analysis is particularly effective for interpreting genetic resources with complex trait characteristics and has been widely utilized in the assessment of genetic resources across various crops.
In this study, seven agronomic characteristics of 506 oat genetic resources maintained by the National Institute of Crop Science (NICS), Rural Development Administration (RDA) were examined to analyze phenotypic diversity. To our understanding, no extensive assessment of Avena germplasm has been conducted under Korean spring conditions, especially considering both fodder and grain use in the same environment. This study provides fundamental information not only for germplasm conservation but also for future oat breeding, thereby filling an important knowledge gap in the characterization of global oat resources.
Materials and methods
Experimental materials
A total of 506 oat genetic resources were obtained from USDA GRIN and the oat breeding department of the NICS, including two Korean oat varieties, ‘Highspeed’ and ‘Samhan’, which served as standard varieties (Supplementary Table 1).
Field trials were conducted over three consecutive years (2021–2023) at the Central-Northern Region Crop Research Center of the NICS. While all plots were located at the same research station, different field plots within the site were used each year. No artificial control of environmental conditions was applied; trials were conducted under natural spring conditions each year.
Due to seed and space limitations, field experiments were conducted using a non-replicated augmented block design, and were performed on standard varieties 10 or 11 times each year, with each accession planted in a single 2-m row per year and arranged sequentially by field number (OG) without randomization due to the convenience of management and prevention of confusion (Supplementary Table 1).
Sowing was conducted on 12 March 2021 and 7 March 2022, employing row seeding with 6–12 g seeds. Sowing was also conducted on 3 March 2023, using hill seeding. Fertilizer was applied at a rate of 6.0-7.4-3.9 kg/10 a for N-P₂O₅-K₂O. Half of the nitrogen was applied as a basal fertilizer, while the remaining half was applied as a topdressing.
Phenotypic evaluation
Phenotypic characteristics, such as DTH, PH, and plant type (PT), were visually evaluated in the field in 2021, 2022 and 2023, following the manual for agricultural investigation by RDA, Korea (Rural Development Administration 2012). Grain traits, including dehulling characteristics (DC), 1,000-grain weight (TGW), seed length (SL) and seed width (SW), were evaluated post-harvest using grains collected in 2022 and 2023, respectively. DC was visually observed, whereas TGW was measured using an electronic balance (OHAUS EOf110; Ohaus Co., Parsippany, NJ, USA). SL and SW were each measured five times annually using Vernier calipers (CD-15APX; Mitutoyo Co., Kanagawa, Japan).
Statistical analysis
The arithmetic means and coefficient of variation for each trait in Table 1 were calculated using observed raw data of 506 oat germplasm.
Statistical summaries of seven agronomic traits evaluated in 506 oat genetic resources over a period of two to three years under Korean spring conditions. Raw observed data without Best Linear Unbiased Predictions adjustment. The data are represented by units, the mean ± standard deviation (SD), observed range and parameter code, coefficient of variation and evaluation years for each trait

Table 1 Long description
The table presents statistical summaries of seven agronomic traits in oat genetic resources evaluated over multiple years in Korea. Plant height averages 130.60 cm with a 12.61% variation, while 1,000-grain weight averages 25.36 g with a 23% variation. Days to heading date shows a mean of 85.06 days, and plant type varies from erect to prostrate. Seed length and width are measured in millimeters, with seed length averaging 10.92 mm and seed width 2.57 mm. Dehulling characteristics are categorized as hulled or hulless. The data spans from 2021 to 2023, with some traits evaluated only in specific years, indicating variability in agronomic performance.
DTH, days to heading date; PH, plant height; PT, plant type; DC, dehulling characteristics; TGW, 1,000-grain weight; SL, seed length; SW, seed width.
As an augmented design was employed, Best Linear Unbiased Predictions (BLUP) was performed to address single replication per year and environmental bias. The standard varieties, ‘Highspeed’ and ‘Samhan’, were repeated 11 and 12 times each year. Among the replication ‘Highspeed (PAS001 or OG001)’ and ‘Samhan (PAS383 or OG398)’ were treated as germplasm, and the remaining 10 and 11 replication were calculated as standard for BLUPs (Supplementary Table 1). In 2021, missing values of PT, SL and SW existed, and they were addressed by averaging the 2022 and 2023 values prior to calculating BLUPs. After obtaining BLUP values, the values of the two standard varieties were excluded from further statistical analyses.
The average BLUP values were used for Pearson correlation analysis. P-values of correlation coefficients were calculated using a two-sided t-test at a significance level of 5%. For principal component analysis (PCA), BLUP values were standardized (mean = 0, standard deviation = 1) to account for differences in units and range among traits. Correlation analysis and PCA were conducted using six numeric traits (excluding the categorical trait DC).
K-prototype clustering analysis was performed to group Avena accessions based on all seven traits, including the nominal DC, by combining the first two PCs and DC. The optimal number of clusters was determined using the elbow method based on the within-cluster sum of squares.
All statistical analyses were performed using R software (version 4.2.1). BLUPs were estimated using the lme4 package, while data processing was performed using the dplyr package. Correlation analysis was conducted using the Hmisc package. PCA was carried out using the Prcomp function, and cluster analysis (CA) was performed using the Clustmixtype package.
Results
Phenotypic evaluation of oat genetic resources
DTH
For three consecutive years (i.e., 2021–2023), DTH – a key phenotypic trait in oats – was evaluated across 506 genetic resources and the two standard varieties (Supplementary Table 1) and the histograms and statistical summaries such as mean, range and coefficient of variation are shown in Fig. 1 and Table 1, respectively.
Histograms of seven agronomic traits among 506 oat genetic resources. Values of six traits days-to-heading (DTH), plant height (PH), plant type (PT), 1,000-grain weight (TGW), seed length (SL), and seed width (SW) with the categorical trait, dehulling characteristics (DC) were averaged across years and subsequently adjusted using Best Linear Unbiased Predictions. DC represents the observed frequency. x-axis represents trait values, and units of each trait are days for DTH, cm for PH, no unit for PT and DC, g for TGW, and mm for SL and SW. y-axis indicates their respective frequencies.

Figure 1 Long description
The image contains seven histograms, each representing different agronomic traits of oats. The first histogram shows 'Days to Heading (DTH)' with the x-axis labeled in days and the y-axis labeled as frequency. The second histogram displays 'Plant Height (PH)' with the x-axis in centimeters and the y-axis as frequency. The third histogram illustrates 'Plant Type (PT)' with no unit on the x-axis and frequency on the y-axis. The fourth histogram represents 'Thousand Grain Weight (TGW)' with the x-axis in grams and the y-axis as frequency. The fifth histogram shows 'Seed Width (SW)' with the x-axis in millimeters and the y-axis as frequency. The sixth histogram depicts 'Seed Length (SL)' with the x-axis in millimeters and the y-axis as frequency. The seventh histogram presents 'Dehulling Characteristic (DC)' with no unit on the x-axis and frequency on the y-axis. Each histogram provides a visual representation of the frequency distribution of these traits among oat genetic resources.
The observed DTH ranges vary across different studies. For instance, Peltonen-Sainio (Reference Peltonen-Sainio1990) reported a DTH range of 49–67 d (mean = 56 d), whereas Boczkowska et al. (Reference Boczkowska, Łapiński, Kordulasińska, Dostatny and Czembor2016) reported a range of 60–82 d (mean = 74.8 ± 4.5 d). Lee et al. (Reference Lee, Yoon, Lee, Oh, Rauf, Hur, Ro, Yi, Hyun, Cho, Ko and Cho2019) reported a range of 74–104 d (mean = 90.5 ± 7.5 d). In contrast, longer durations were observed by Arora et al. (Reference Arora, Sood, Chaudhary, Banyal, Kumar, Devi, Kumari and Yograj2021) as 125–164 d (mean = 145 ± 0.95 d), Canales et al. (Reference Canales, Montilla-Bascón, Bekele, Howarth, Langdon, Rispail, Tinker and Prats2021) as 125–181 d (mean = 156.90 ± 9.73 d), and Ihsan et al. (Reference Ihsan, Nazir, Ghafoor, Khalil, Zahoor, Nisar, Khames, Ullah and Shah2021) as 142–167 d (mean = 152.56 ± 4.67 d) in 2019 and 144–165 d (mean = 150.55 ± 4.54 d) in 2020. Additionally, Sheikhehpour et al. (Reference Sheikhehpour, Bahraminejad and Cheghamirza2014) reported 152–184 d (mean = 163.66 d), whereas Nikoloudakis et al. (Reference Nikoloudakis, Bladenopoulos and Katsiotis2016) reported 161–179 d (mean = 169.88 ± 4.21 d). These variations in DTH likely arise from differences in sowing conditions. For instance, the studies of Peltonen-Sainio (Reference Peltonen-Sainio1990), Boczkowska et al. (Reference Boczkowska, Łapiński, Kordulasińska, Dostatny and Czembor2016), and Lee et al. (Reference Lee, Yoon, Lee, Oh, Rauf, Hur, Ro, Yi, Hyun, Cho, Ko and Cho2019) adopted spring sowing, whereas other studies used autumn sowing.
The variability observed in this study showed the genetic diversity of heading dates, which is crucial for breeding programs that target specific environmental conditions or cropping systems. A recent study on hexaploid oats reported heritability estimates for heading dates as ranging from 0.46–0.68, varying by population and indicating a strong genetic influence alongside environmental factors (Mazurkievicz et al. Reference Mazurkievicz, Krause and Nava2019).
DTH variation observed in this study showed that photoperiod sensitivity and temperature response are crucial factors determining the heading date, as this study was conducted under natural field conditions without an artificial control (data not shown). An assessment of introduced oat accessions in Bangladesh revealed that earlier-heading genotypes were positively linked to adaptability to shorter growing seasons (Uddin et al. Reference Uddin, Babar, Harrison, Fatema and Khan2023). This finding aligns with our results showing that early-heading genotypes, such as PAS346 and PAS354, could be beneficial under conditions requiring rapid maturity, whereas late-heading genotypes, such as PAS244, might perform better in environments with longer growing periods.
PH
PH of 506 genetic resources was estimated over three years; the histograms and statistical summaries are shown in Fig. 1 and Table 1, respectively.
Ihsan et al. (Reference Ihsan, Nazir, Ghafoor, Khalil, Zahoor, Nisar, Khames, Ullah and Shah2021) reported PH ranges of 59.6–145.2 cm (mean = 106.81 ± 18.43 cm) in 2019 and 69.2–140.0 cm (mean = 108.99 ± 19.90 cm) in 2020. Sheikhehpour et al. (Reference Sheikhehpour, Bahraminejad and Cheghamirza2014) observed a range of 61.87–147.84 cm (mean = 101.16 cm), which was similar to the range reported in this study. Arora et al. (Reference Arora, Sood, Chaudhary, Banyal, Kumar, Devi, Kumari and Yograj2021) reported a range of 91.91–131.11 cm (mean = 110.51 ± 0.90 cm), focusing on forage oats. The oat genetic resources utilized in this study exhibited taller PH values compared with those reported by Peltonen-Sainio (Reference Peltonen-Sainio1990), Sheikhehpour et al. (Reference Sheikhehpour, Bahraminejad and Cheghamirza2014) and Ihsan et al. (Reference Ihsan, Nazir, Ghafoor, Khalil, Zahoor, Nisar, Khames, Ullah and Shah2021). This difference is attributed to the emphasis in Korea on developing forage oat varieties with increased PHs, biomass and dry matter content for forage purposes, including genetic resources with taller PHs.
PT
Plant juvenile growth habit, or PT, is evaluated as a nominal variable, which was classified into three groups: 1 (erect), 3 (intermediate) and 5 (prostrate), and treated as a continuous variable in the statistical analysis since arithmetic means of values observed over three years were used (Fig. 1; Table 1).
Nikoloudakis et al. (Reference Nikoloudakis, Bladenopoulos and Katsiotis2016) categorized PTs based on tiller angle during the vegetative growth stage, using criteria similar to those of RDA (RDA 2012), revealing that 82% of resources were identified as the semi-prostrate type. Vilaró et al. (Reference Vilaró, Rebuffo, Miranda, Pritsch and Abadie2004) determined PT by evaluating the PH-to-plant width ratio during the vegetative growth stage. A ratio of 0.5 or less was classified as prostrate, whereas a ratio of 1.5 or more was considered erect. The research highlighted significant distinctions among landraces, new cultivars, Estanzuela 1095a, RLE 115 breeding lines and collected germplasm. The average PT for collected germplasm was 0.42, indicating a prostrate type, whereas landraces averaged 1.21 (intermediate type), and new cultivars and breeding lines averaged 1.70 and 1.96, respectively, indicating a preference for more erect types in selection and breeding.
Grain characteristics
TGW, SL, SW and DC were evaluated over two or three years and the histograms and statistical summaries are shown in Fig. 1 and Table 1, respectively.
The observed range of TGW in this study was wider than that in previous research. Nikoloudakis et al. (Reference Nikoloudakis, Bladenopoulos and Katsiotis2016) reported a TGW range of 13–37 g (mean 24.84 ± 6.49) of oat landraces, whereas Ihsan et al. (Reference Ihsan, Nazir, Ghafoor, Khalil, Zahoor, Nisar, Khames, Ullah and Shah2021) observed TGW ranges of 15.4–37.2 g (mean 20.78 ± 4.93) in 2019 and 15.0–31.8 g (mean 25.18 ± 4.15) in 2020. Sheikhehpour et al. (Reference Sheikhehpour, Bahraminejad and Cheghamirza2014) reported a TGW range of 17–36.27 g (mean 25.47), whereas Lee et al. (Reference Lee, Yoon, Lee, Oh, Rauf, Hur, Ro, Yi, Hyun, Cho, Ko and Cho2019) reported a 100-grain weight range of 1.8–4.2 g (mean 2.7 ± 0.4). Boczkowska et al. (Reference Boczkowska, Łapiński, Kordulasińska, Dostatny and Czembor2016) reported a TGW range of 22.9–35.11 g (mean 28.4 ± 3.1), and Peltonen-Sainio (Reference Peltonen-Sainio1990) reported single grain size ranging from 23.1 to 35.8 mg (mean 29.1). Arora et al. (Reference Arora, Sood, Chaudhary, Banyal, Kumar, Devi, Kumari and Yograj2021) reported a 100-grain weight ranging from 2.86 to 4.83 g (mean 3.74 ± 0.34). According to previous research, TGW of oats was influenced by environmental factors such as drought (Sadras et al. Reference Sadras, Mahadevan and Zwer2017).
Vilaró et al. (Reference Vilaró, Rebuffo, Miranda, Pritsch and Abadie2004) reported the SL of Uruguayan oats, with old varieties ranging from 6.90 to 10.72 mm (mean 9.14 ± 0.736), modern lines from 8.12 to 10.18 mm (mean 9.19 ± 0.627), selections from 8.69 to 10.36 mm (mean 9.47 ± 0.502), and farmers’ varieties from 7.97 to 10.28 mm (mean 9.34 ± 0.670), showing less variability than the results observed in the present study. To our knowledge no prior research has explored SW diversity in oats, making this study the first to investigate this trait. Tang et al. (Reference Tang, Yan, Wang, Li, Wei, Ren, Zhao and Peng2014) categorized oat seed plumpness into three stages: shrunken, medium, and plump. However, continuous measurement of variables is likely to offer a more accurate assessment. Therefore, measuring SW is considered a more precise method for evaluating grain plumpness.
DC was presented as a nominal variable, as 0 (hulled oats) or 1 (hulless oats) (Table 1). The present study included 404 hulled oats accessions and 102 hulless oat accessions. Diederichsen (Reference Diederichsen2008) identified 183 out of 10,105 genetic resources as hulless oats, representing 1.81% of the total. Nikoloudakis et al. (Reference Nikoloudakis, Bladenopoulos and Katsiotis2016) reported that among 50 resources, one was hulless, accounting for 2% of the collection. Out of the 506 resources analyzed in this study, 102 were hulless oats, representing 20.2% of the total collection. While hulled oats are predominantly utilized for breeding and cultivation internationally, in Korea, hulless oats serve various purposes, including blending with rice for cooking, resulting in a significant number of hulless oat resources being available.
Correlation analysis of oat genetic resources
Phenotypic relationships between oat agronomic traits
To indicate the relations between six numeric agronomic traits of 506 oat genetic resources (Supplementary Table 1), Pearson correlation coefficients were employed, and the results are presented in Supplementary Table 2.
Specifically, a strong positive correlation (r = 0.84) was observed between TGW and SW, consistent with previous studies indicating that larger seeds tend to have greater weights due to larger endosperm size. Peltonen-Sainio (Reference Peltonen-Sainio1990) and Boczkowska et al. (Reference Boczkowska, Łapiński, Kordulasińska, Dostatny and Czembor2016) reported a correlation of 0.6 or higher between TGW and grain yield, suggesting that selecting wider or heavier seeds could improve grain yield. A moderate positive correlation (r = 0.53) was observed between PH and DTH, indicating that taller plants were likely to have longer vegetative periods. This aligns with earlier studies on oats and other cereals, which suggest that delayed heading often extends vegetative growth, resulting in increased PH (Peltonen-Sainio Reference Peltonen-Sainio1990; Boczkowska et al. Reference Boczkowska, Łapiński, Kordulasińska, Dostatny and Czembor2016).
Multivariate analysis of oat genetic resources
PCA
Given that DC was a categorical variable (hulled or hulless oats), PCA was performed on the BLUP values of the remaining six traits of the 506 oat genetic resources: DTH, PH, TGW, PT, SL and SW (Supplementary Table 3). As the parameters and units of these six traits were all different, scaling of the mean and variance was preprocessed (data not shown).
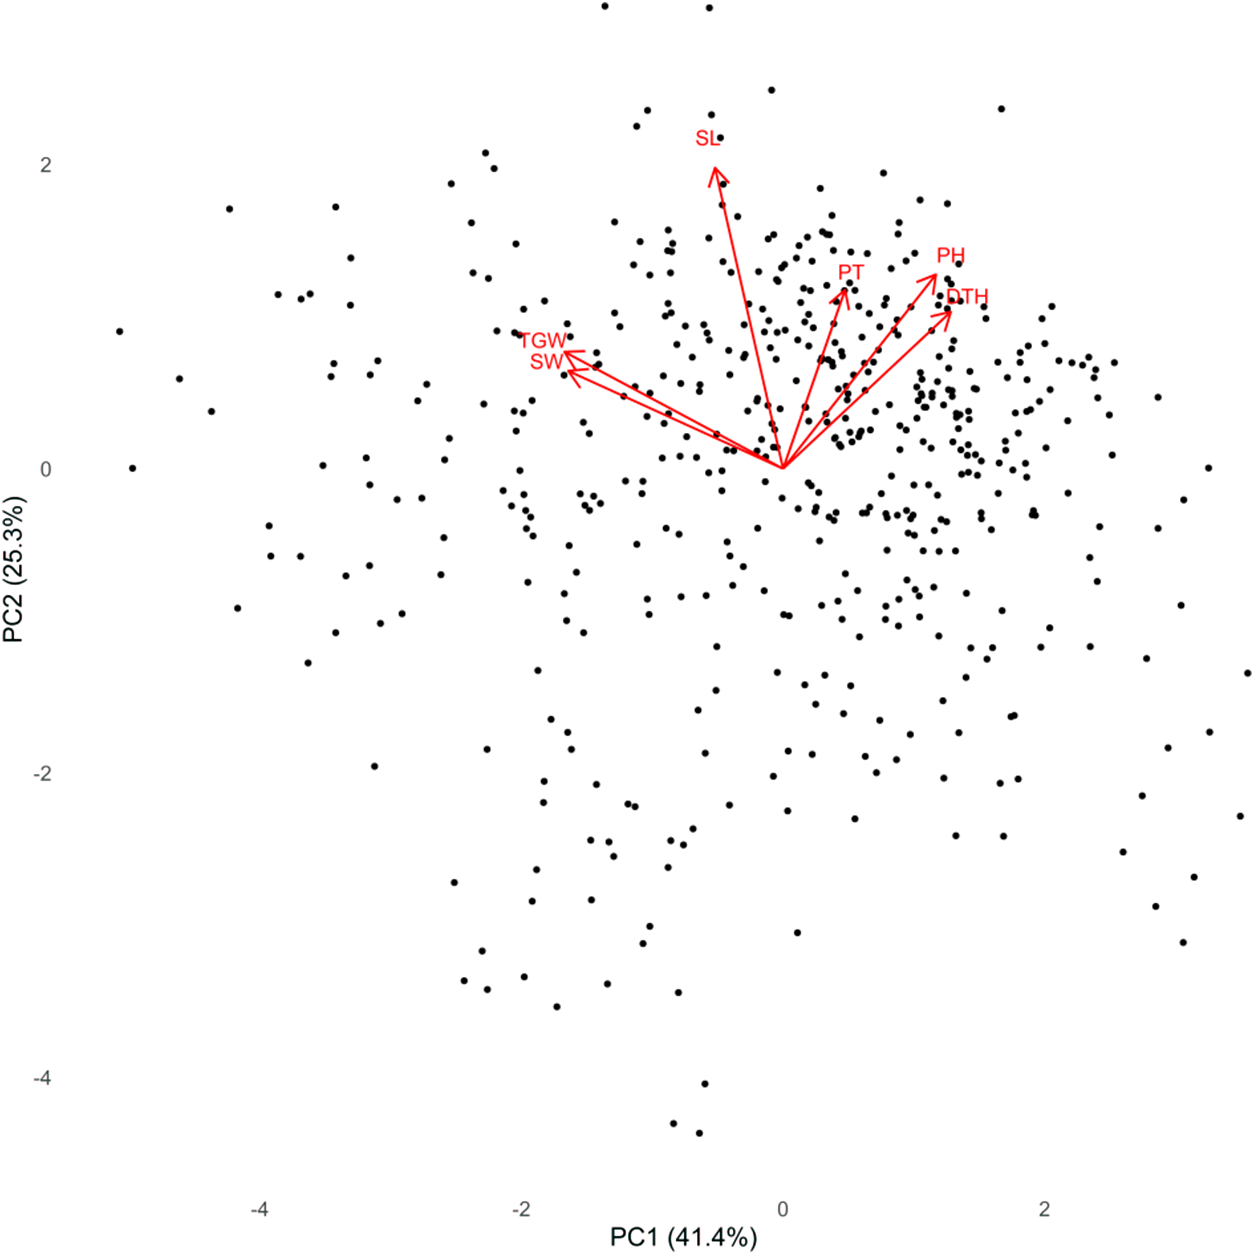
Typically, only a few primary components that account for most of the variance are chosen. Following Kaiser’s rule, which retains components with eigenvalues exceeding one, the first two principal components (PCs), PC1 and PC2 were selected. The PCA results indicate that the first two PCs accounted for 66.88% of the total variance, with PC1 contributing 41.68% and PC2 contributing 25.19% (Supplementary Table 3). These components effectively accounted for most of the variation in the dataset, providing an understanding of the effect of each trait on phenotypic diversity. PC1 was strongly associated with TGW and SW, and PC2 primarily reflected variations in SL, indicating that factors related to grain characteristics were the major contributors to the overall variation of the first two PCs.
CA
CA was conducted by combining the first two PCs obtained from PCA with the nominal variable DC. The K-prototype algorithm was selected owing to its ability to handle both continuous and categorical data, integrating concepts from K-means and K-modes (Huang Reference Huang1998). The optimal number of clusters (k) was determined to be four using the elbow method, where a noticeable slowdown in the total within-cluster sum of squares (WSS) decline was observed (data not shown). Although the silhouette coefficient indicated that k = 3 would be the most optimal, k = 4 was selected to better capture the characteristics of the clusters (data not shown).
The clustering results were visually represented in the 2D cluster plot (Fig. 3, left) and dendrogram (Fig. 3, right). The assigned cluster for each accession is presented in Supplementary Table 1. Table 2 lists the mean values of agronomic traits within each cluster and the geographical origins of the accessions. Cluster 1 primarily comprised hulless oat varieties, with large DTH and PH means and the smallest grain weight (20.58 g). Cluster 2 consisted of hulled oats with the largest grains in terms of TGW (32.14 g), SL (11.97 mm) and SW (2.90 mm). Most of the Korean hulled oat varieties were clustered in Cluster 2. Cluster 3 consisted of hulled oats with the tallest mean PH (139.05 cm) and the latest mean heading dates (88.69 d). The Avena accessions in Cluster 3 were the most prostrate type. Cluster 4 comprised mainly hulless oat germplasm with the shortest DTH and PH means among the clusters. Also, they were the most erect type, with a relatively small grain and the shortest SL mean. This cluster likely represents early maturing genotypes suitable for short growing seasons, characterized by relatively hulless and round grains.
K-prototype clustering analysis of 506 oat genetic resources, integrating the first two principal components of the principal component analysis which was conducted on six continuous traits, days-to-heading (DTH), plant height (PH), plant type (PT), 1,000-grain weight (TGW), seed length (SL), and seed width (SW) with the categorical trait, dehulling characteristics (DC). The elbow method identified four distinct clusters (data not shown). The table presents the number of hulled and hulless samples per cluster, mean values for agronomic traits (DTH, PH, PT, TGW, SL, and SW). The SL/SW ratio, calculated as SL divided by SW, indicates that smaller values correspond to rounder grain of oat genetic resources. Geographical origin of the accessions according to the Zeven and Zhukovsky (Reference Zeven and Zhukovsky1975) regional classification
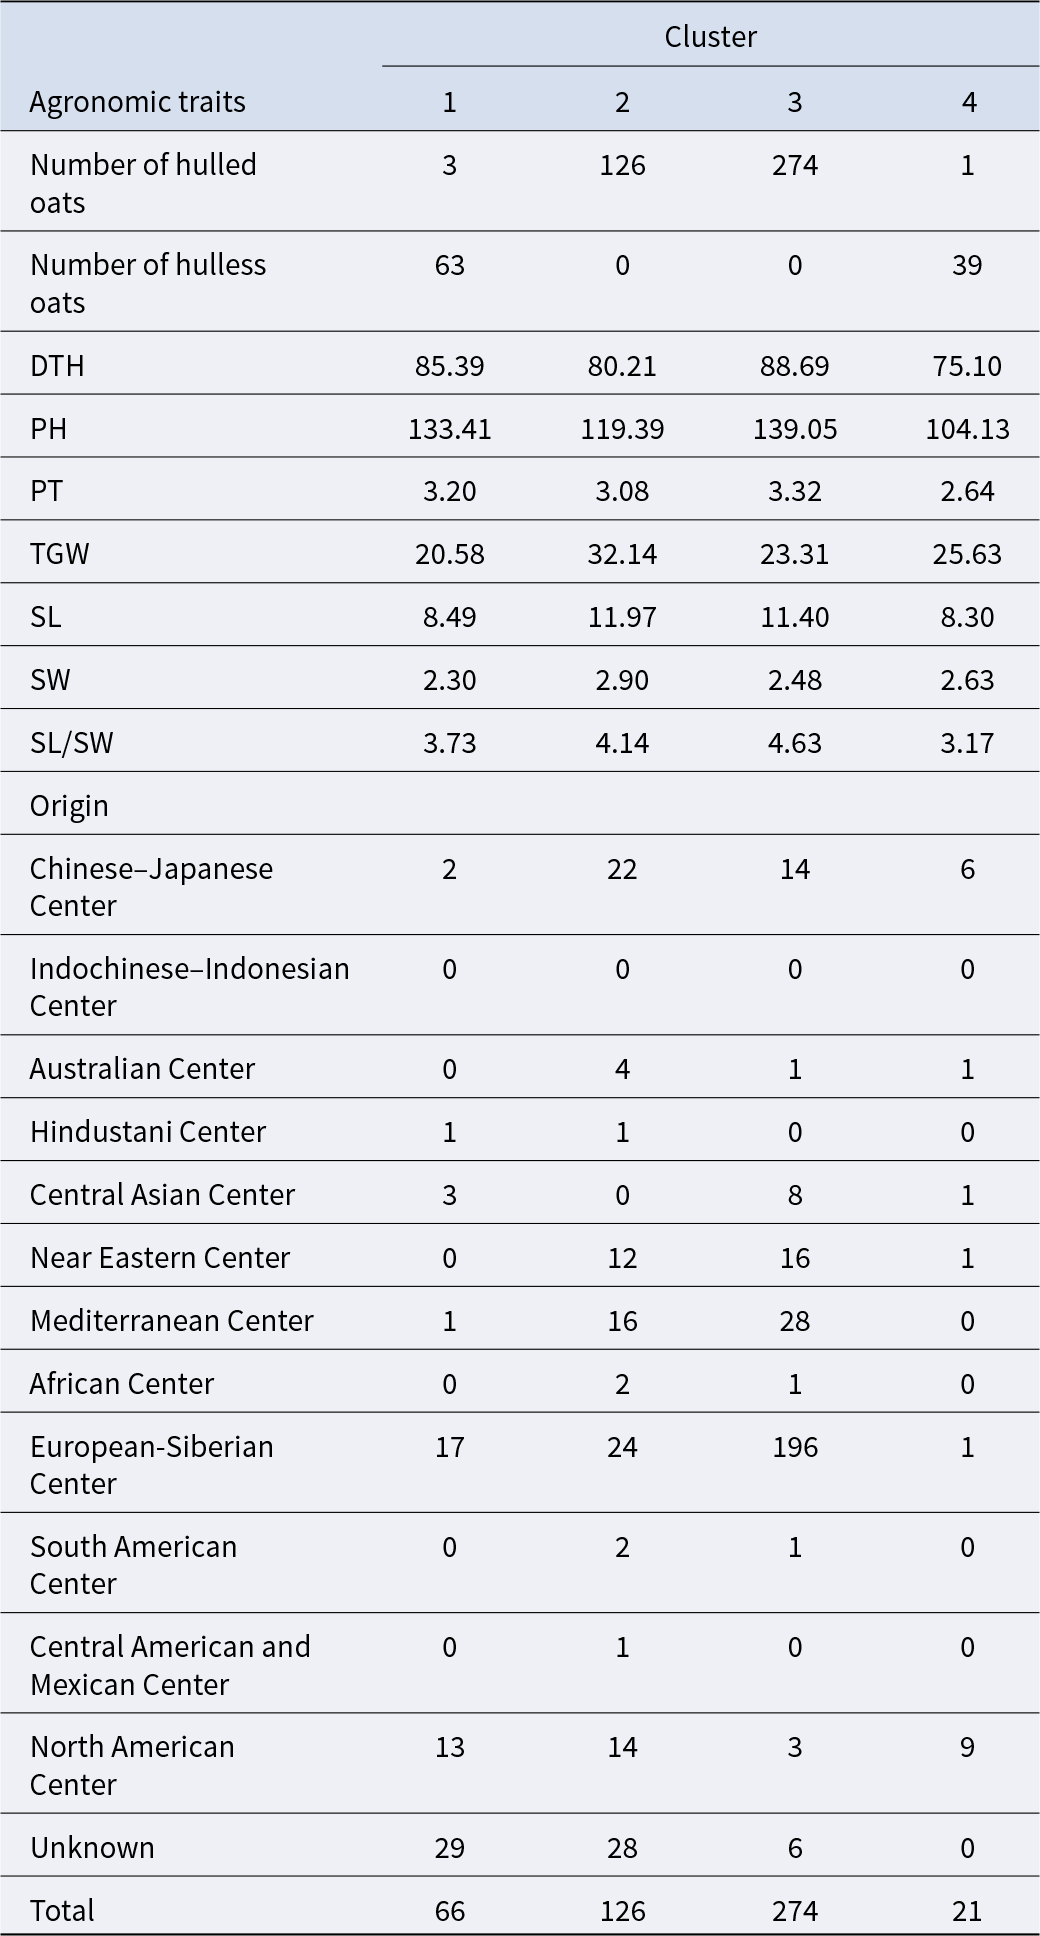
Table 2 Long description
The table presents a k-prototype clustering analysis of 506 oat genetic resources, focusing on agronomic traits and geographical origins. Cluster 3 contains the highest number of hulled oats (274) and the tallest plants (139.05 cm), while Cluster 1 has the most hulless oats (63) and a diverse geographical origin, with 17 accessions from the European-Siberian Center. Cluster 2 has the highest mean 1,000-grain weight (32.14 g) and seed length (11.97 mm), while Cluster 4 has the lowest days-to-heading (75.10) and plant type (2.64). The SL/SW ratio indicates that Cluster 3 has the longest grains relative to width (4.63), suggesting less roundness compared to other clusters. The geographical distribution shows a significant number of accessions from the European-Siberian Center across all clusters, with Cluster 3 having the most. Unknown origins are notably high in Cluster 1.
Geographic distribution
The geographical origins of the 506 oat genetic resources were detailed in Supplementary Table 1.
These resources originated from 49 countries, including 84 accessions of unknown origin. They covered 11 of the 12 regions defined by Zeven and Zhukovsky (Reference Zeven and Zhukovsky1975), excluding the Indochina–Indonesia region. In the case of Mongolia, it was classified as part of Eastern Asia geographically, however, it is located on the ecological boundary of Central Asia and Eastern Asia, and it was considered as part of Central Asia in this study.
Although most of the Avena accessions from the European–Siberian Center were grouped in Cluster 3, other accessions did not exhibit any clear pattern (Table 2).
The Middle Eastern–Mediterranean region was acknowledged as the primary center of origin for oats (Rines et al. Reference Rines, Molnar, Tinker and Phillips2006). The absence of resources from the Indochina–Indonesia region was likely due to its hot and humid climate, rendering it unsuitable for oat cultivation. Of the oat genetic resources assessed, Russia possessed the highest quantity (64 accessions), followed by Korea (41 accessions), Ukraine (36 accessions), Germany (31 accessions) and Poland (31 accessions). According to FAOSTAT (www.fao.org; accessed January 2025), the most extensive regions for oat cultivation included Russia, Canada, Australia, Brazil, Poland, Spain, and the United States. The highest production volumes were reported in Canada, Russia, Australia, Poland, and Brazil. The concentration of genetic resources in these regions suggested active breeding programs and resource exploration in areas with prominent oat cultivation.
Discussion
Correlation analysis and PCA using the mean values of the traits over the years revealed strong associations between DTH and PH, as well as between TGW and SW (Fig. 2; Supplementary Table 2 and 3). The observed correlations in this study correspond with the results from earlier research (Peltonen-Sainio Reference Peltonen-Sainio1990; Boczkowska et al. Reference Boczkowska, Łapiński, Kordulasińska, Dostatny and Czembor2016), indicating that these associations can be utilized as valuable indicators for indirect selection in pedigree-based breeding. Plant breeders may use either direct or indirect selection methods to achieve their breeding goals. A drawback of direct selection is that an enormous time is needed to observe a desired trait (Peltonen-Sainio Reference Peltonen-Sainio1990). In contrast, indirect selection, focusing on traits correlated with the target trait, can decrease the selection process in initial generations or before harvest. Analysing correlations can help breeders uncover the relationships among these traits, thus enhancing the effectiveness of indirect selection.
Biplot of principal component analysis results based on six continuous traits (DTH, PH, PT, TGW, SL, and SW). The first two principal components (PC1 and PC2) explain 41.7% and 25.2% of the total variance, respectively. Each point represents an Avena accession, positioned according to its PC1 (x-axis) and PC2 (y-axis) loadings. PC1 was mainly influenced by TGW and SW in the negative direction, while being influenced by DTH, PH, and PT in the positive direction. In PC2, all traits contributed positively, with SL exerting the strongest influence.

Figure 2 Long description
A biplot illustrating principal component analysis results with PC1 on the x-axis labeled as PC1 left parenthesis 41.4 percent right parenthesis and PC2 on the y-axis labeled as PC2 left parenthesis 25.3 percent right parenthesis. Numerous data points are scattered across the plot. Several vectors labeled TGW, SW, SL, PT, PH and DTH extend from the origin, indicating the direction and influence of these traits on the principal components. The vectors vary in length and angle, showing different contributions to the components.
Based on the K-prototype method, CA classified the 506 oat accessions into four distinct clusters (Fig. 3; Table 2). Upon examining the clusters for oat breeding objectives suitable for the Korean environment, Cluster 4 showed promise for grain use as it has short growth periods and short heights. Early maturing varieties offer advantages, and shorter plants are preferred because the monsoon season coincides with the grain-filling season in Korea. In addition, Cluster 2 can serve as another candidate for grain-focused breeding in Korea as Avena accessions in Cluster 2 have high TGW and TGW has a positive correlation with grain yield according to previous studies. Indeed, most of Korean oat varieties are grouped in Clusters 2 and 4. Clusters 1 and 3, featuring longer growth periods and tall plants, exhibiting potential for forage oat breeding since PH is one of the yield components in forage crops. In oats, it is commonly harvested either before or after heading for utilization as hay, haylage, or silage. In the context of forage production, seed production is not a primary concern, and because high biomass is the main objective, late heading may still be advantageous for practical use.
K-prototype clustering analysis (four clusters) incorporating two principal components (PC1 and PC2) from PCA on six continuous traits, along with the categorical DC. Left panel presents a two-dimensional scatter plot of PC1 and PC2, with points color-coded by cluster and shape by DC. Right panel shows a dendrogram illustrating cluster relationships. The dendrogram was constructed using hierarchical clustering with Gower distance and Ward.D2 method. The y-axis represents the dissimilarity (Gower distance) between clusters.

Figure 3 Long description
The left panel displays a two-dimensional scatter plot with axes labeled PC1 and PC2. Points are color-coded by cluster and shaped by DC, showing four distinct clusters. The right panel features a dendrogram illustrating hierarchical clustering relationships among the clusters. The y-axis represents dissimilarity between clusters, with branches indicating cluster connections.
Although this trial was conducted using a non-replicated and non-randomized design, multi-year evaluation and augmented design with two standard varieties which were repeated over 10 times each year partially compensate for the limitations of the experimental design. Statistical evaluation of the augmented design yielded t-values exceeding 8 (data not shown), indicating that, for 2022 and 2023, replication of the standard varieties provided meaningful adjustment for environmental effects. In 2021, traits such as PT, SL, and SW were not measured, and thus, the means of each trait were adjusted using the mixed linear model, BLUPs. Although sowing methods were confounded with the year effect, the year effect was treated as a random effect, and variation in sowing methods and seeding rates was partially incorporated within the year effect in the model.
Also, although the results emphasize the usefulness of multivariate analysis, it is important to consider limitations such as information loss resulting from PCA-based dimensionality reduction and the impact of environmental variability on trait expression. CA was performed based on PCA results and DC. Traits that primarily explain PC1 and PC2 were also related to grain characteristics, indicating that clustering was mainly driven by seed-related traits. Although both WSS and silhouette analyses suggested that three clusters would be the most optimal, four clusters were chosen to allow for finer differentiation. If three clusters were selected, Clusters 1 and 4 of the four-cluster solutions merged into a single cluster. These two clusters differed substantially in traits considered important by breeders, such as DTH and PH, but were grouped together due to being hulless oats with relatively small seeds (Table 2).
This study provides data on multi-year evaluations of global oat germplasm under Korean environmental conditions, which have previously been lacking. Previous studies by Diederichsen (Reference Diederichsen2009) and Tang et al. (Reference Tang, Yan, Wang, Li, Wei, Ren, Zhao and Peng2014) evaluated morphological features such as color and the dorsal awn of the lemma. Though these qualitative characteristics can be helpful in cultivar identification, they lack agronomic significance. Given that most of breeding goals target quantitative traits (Ko et al. Reference Ko, Kim, Park, Seo, Ahn and Jeong2010), optimizing genetic resources in breeding schemes requires multi-year assessments of quantitative traits in specific environmental settings. With respect to the environment, Lee (Reference Lee, Yoon, Lee, Oh, Rauf, Hur, Ro, Yi, Hyun, Cho, Ko and Cho2019) focused on overwintering trials in southern regions in Korea and components of grain. Our study, however, evaluated quantitative and breeding-relevant traits of spring-sown oats which have diverse origins under the central and northern regions in Korea. Recent climate changes have made stable overwintering increasingly difficult in Korea, thus increasing prevalence of spring-sown cultivation. Therefore, performance data for spring-sown oats adapted to Korean conditions are critical for guiding breeding programs and selecting genotypes suitable for the changing climate.
Additionally, this phenotypic evaluation may support genome-wide association studies. Recently, the complete genome sequence of hexaploid oats was disclosed (Peng et al. Reference Peng, Yan, Guo, Deng, Wang, Wang, Kang, Zhou, Yu, Dong, Liu, Sun, Peng, Zhao, Deng, Xu, Li, Jiang, Li, Wei, Wang, Ma, Hao, Li, Kang, Peng, Liu, Jia, Zheng, Ma, Wei, Lu and Ren2022), and studies on orthologous genes for diverse traits in other Poaceae species, such as rice, wheat, and barley, have been undertaken. Therefore, generating phenotypic data of oats could establish a basis for identifying oat genes by improving the accuracy and precision of oat breeding, thereby expediting the breeding process.
Supplementary material
The supplementary material for this article can be found at https://doi.org/10.1017/S1479262125100403.
Acknowledgements
This study received support from the Cooperative Research Program for Agriculture Science and Technology Development (Project No. PJ017257022025) of the Rural Development Administration of the Republic of Korea.
Author contributions
All authors, including Byeong Gyu Lee, contributed to the conception and design of this study. Material preparation, data collection and analyses were performed by Kyungyoon Ra and Ja-Hwan Ku. Myeong Sook Lee and Ki Sun Kim assisted in the collection of germplasm and contributed to the trait evaluation and oat field experiments. Su Jeong Kim and Sujung Kim supervised the experiments, and Yuchan Choi assisted with the statistical analysis. The first draft of the manuscript was written by Kyungyoon Ra, and all authors commented on previous versions of the manuscript. Kwang Soo Cho contributed to the review of this study. Although Myeong Sook Lee, Ki Sun Kim, Yuchan Choi and Kwang Soo Cho are not listed as authors, their support was invaluable, and we sincerely appreciate their contributions.
Funding statement
This work was supported by the Rural Development Administration under Grant number PJ017257022025.
Data availability
No datasets were generated or analyzed during the current study.
Competing interests
The authors report there are no competing interests to declare.
Use of artificial intelligence (AI) tools
Minor assistance was provided by AI tools for English translation and grammar checking only. All analyses and writing were conducted by the authors.