

Considerations of power in the public forum have long focused on its dark and poisonous nature. In Julius Caesar, Shakespeare's Brutus compares Caesar's potential rise to power as the hatching of a mischievous serpent's egg and suggests that Caesar be killed before the egg has a chance to hatch (i.e., before his coronation) and power ‘change[s] his nature’ (Act 2, Scene 1). Other influential thinkers share Shakespeare's legendary antipathy toward power; James Madison, fourth President of the United States, opined, ‘The truth is that all men having power ought to be mistrusted.’ These conceptualisations of power carry the assumption that the powerful are functioning in a disharmonious social landscape in which they manipulate and abuse those around them (but see Raven & French, Reference Raven and French1958; Yukl, Reference Yukl2006). Like these revered thinkers, many developmentalists have neglected to consider possible relational benefits of power. The purpose of this article is to explore not only the well-expected relational drawbacks of being powerful or having powerful friends, but also consider the overlooked relational benefits of power.
The premise that power begets disharmony has been a mainstay in both classical and modern literature and philosophy. Humanist psychologist David Bakan (Reference Bakan1966) highlighted what he deemed the two fundamental modalities of social life: agency (self-assertion, self-expansion) and communion (connection with others). Bakan's exposition focuses on a dialectic relationship between what he construed as two opposing forces: agency differentiates one from the crowd and sets one to isolation, whereas communion is union with the social group. From this perspective, individuals must balance their agentic motivations (e.g., power-seeking) with their communal motivations (e.g., relationship-seeking) because too much agency (without concomitant relationships) can lead to exploitation, whereas too much communion (without concomitant power) can lead to subservience or subjugation (Bakan, Reference Bakan1966; McAdams, Healy, & Krause, Reference McAdams, Healy and Krause1984). This work has been recently invoked in the child development peer relations literature to highlight differences between being liked and being perceived as popular by one's peers (Cillessen, Reference Cillessen, Cillessen, Schwartz and Mayeux2011).
The present study challenges the characterisation that power and communality operate as opposing forces. Instead, power and communality may act in concert: resource-seeking involves the pursuit of social capital, and social capital is found within one's positive social relationships (Hawley, Reference Hawley1999). In other words, individuals may gain power through the relationships they cultivate, particularly through relationships with powerful others (Dijkstra, Cillessen, Lindenberg, & Veenstra, Reference Dijkstra, Cillessen, Lindenberg and Veenstra2010). The primary purpose of this article is to demonstrate the necessity of studying power and communal relationships together. Specifically, this project focuses on how perceptions of power (i.e., resource control) can affect not only influence within dyadic friendships, but also the functioning of the relationships themselves.
Power Processes in Relationships
Keltner, Gruenfeld, and Anderson (Reference Keltner, Gruenfeld and Anderson2003) explicitly describe power as ‘an individual's capacity to modify other's states by providing or withholding resources . . . or administering punishments. . . . The perceived freedom with which individuals can deliver resources and punishments to others also influences the individual's level of power’ (pp. 265–266). Thus, according to Keltner, power involves not only autonomous social functioning and ascension in the social hierarchy (a concept reminiscent of Bakan's agency modality), but also the regulation of resources in the social environment. From this resource-based perspective, power can in part be construed as resource control: one's relative ability to attain and maintain resources (material, informational) in social groups (Hawley, Reference Hawley1999). Indeed, resource control has been positively linked with directing behaviour and negatively linked with both complying and imitating behaviours, suggesting that resource control is associated with agency and influence (Hawley & Little, Reference Hawley and Little1999).
Though numerous studies have outlined the benefits and drawbacks of power for individuals (e.g., Cillessen & Mayeux, Reference Cillessen and Mayeux2004; LaFontana & Cillessen, Reference LaFontana and Cillessen2002; Mayeux, Sandstrom, & Cillessen Reference Mayeux, Sandstrom and Cillessen2008), they tend to leave relational outcomes associated with power unexplored. For example, we have limited knowledge of the relationship dynamics of children and adolescents perceived as popular by their peers (i.e., perceived popularity), a construct that has been construed as an index of power in the peer relations literature (Cillessen, Schwartz, & Mayeux, Reference Cillessen, Schwartz and Mayeux2011; Parkhurst & Hopmeyer, Reference Parkhurst and Hopmeyer1998). Whereas children perceived as popular seem to enjoy benefits such as influence over and emulation by peers (Adler & Adler, Reference Adler and Adler1998), costs are explicitly expected to appear in the form of poor long-term relationship functioning (Cillessen & Rose, Reference Cillessen and Rose2005). These expectations, however, have yet to manifest in empirical results.
Further, most peer relations work has focused on friendships of young children or those in middle childhood, relationships marked by social play and similarity. As children develop into adolescents, their friendships begin to include elements of dyadic intimacy and social support (while still rooted in similarity; Hartup, Reference Hartup1996). Perhaps the focus on friendship similarity and social harmony has obstructed the potential role of power in late adolescent and early adulthood friendships (the ages represented in the current study). For example, adolescents and adults (and children to some extent) are able to autonomously choose their friends, and power plays a role in their choices; and those with more power receive more friendship nominations (Dijkstra, Berger, & Lindenberg, Reference Dijkstra, Berger and Lindenberg2011; Dijkstra, Cillessen, & Borch, Reference Dijkstra, Cillessen and Borch2013; Hawley, Little, & Card, Reference Hawley, Little and Card2007). Little is known, however, about the state of those friendships.
In contrast to the peer relations literature, the anticipated link between power and relationship dynamics has been addressed in the context of romantic relationships. Though romantic relationships and friendships differ markedly in their functioning and expectations (romantic relationships are more private and carry monogamous expectations whereas friendships occur in a more public forum, typically with the understanding that individuals have multiple friends), both relationship types satisfy relational needs by providing a similar social context of intimacy, trust, loyalty, and practical and emotional support (Davis & Todd, Reference Davis and Todd1982). Therefore, examining power in romantic relationships is instructive for the current project.
Like the literary work, the romantic relationship literature has been disproportionately focused on relational costs. For instance, those who experience a power differential with their romantic partner are more likely to feel angry, depressed and frustrated (Beach & Tesser, 1994; Bentley, Galliher, & Ferguson, Reference Bentley, Galliher and Ferguson2007; Gray-Little & Burks, Reference Gray-Little and Burks1983; Whisman & Jacobson, Reference Whisman and Jacobson1990), and, accordingly, report more dissatisfaction than those in egalitarian relationships (Blood & Wolfe, Reference Blood and Wolfe1960; Gray-Little & Burks, Reference Gray-Little and Burks1983; Shukla & Kapoor, Reference Shuka and Kapoor1990).Footnote 1
Very little research, however, has been devoted to investigating the relations between power and friendship functioning (but see Laursen & Hartup, Reference Laursen, Hartup, Laursen and Graziano2002, for a theoretical review) or to exploring potential relational benefits associated with having power or having a powerful friend (but see Dijkstra et al., Reference Dijkstra, Cillessen, Lindenberg and Veenstra2010). This work, by its nature, would challenge commonly accepted assumptions, such as those advanced by Bakan (i.e., that agency and communion are opposing forces; but see Buhrmester, Reference Buhrmester, Bukowski, Newcomb and Hartup1996) and those widely held by peer relations researchers (e.g., that friendships are relatively egalitarian relationships; Bukowski, Motzoi, & Meyer, Reference Bukowski, Motzoi, Meyer, Rubin, Bukowski and Laursen2009). Indeed, Veniegas and Peplau (Reference Veniegas and Peplau1997) explicitly questioned whether the ‘equitability’ assumption of dyadic friendships is tenable, given that 60% of their young adult sample reported that they were involved in unbalanced relationships, with one individual holding a disproportionate amount of influence within a friendship. Like Veniegas and Peplau (Reference Veniegas and Peplau1997), Davidson and Duberman (Reference Davidson and Duberman1982) also found that half of their sample were voluntarily involved in unbalanced friendships; half of the unbalanced friendships included stable, acknowledged influence differences and the other half involved a continuous struggle for influence. These findings question the equitability assumption of friendships and demonstrate the importance of examining friendships and power structures together. Unbalanced friendships, though cost-bearing, may also be acceptable to those involved.
Given that individuals who are friends are typically both part of the same hierarchically organised power structures, navigating those power structures can involve navigating friendships. Indeed, reputation and status can be enhanced in groups by becoming friends with numerous group members (Anderson & Kilduff, Reference Anderson and Kilduff2009); thus, social connectedness (communality) can serve reputation (agency) goals. Cooperation in group situations not only provides a key ingredient to friendship formation and maintenance (Newcomb & Bagwell, Reference Newcomb and Bagwell1995), but also predicts increased power within groups (Charlesworth, Reference Charlesworth1996; Hardy & Van Vugt, Reference Hardy and Van Vugt2006; Hawley, Reference Hawley1999), suggesting that individuals may use generosity or ingratiation for status enhancement. Taken together, these studies suggest that friendships and friendly behaviours can serve status or power goals.
Exchange Processes in Relationships
Though not commonly adopted in developmental circles, economically oriented theories (e.g., social exchange theory, interdependency theory, resource control theory) are instructive in their combining the study of power with the study of friendship. These theories similarly argue that balancing rewards and costs within a relationship are particularly important for a variety of relationship processes and outcomes (e.g., Homans, Reference Homans1961; Kelley & Thibaut, Reference Kelley and Thibaut1978; Rusbult & Van Lange, Reference Rusbult and Van Lange2003); on average, individuals seek to maximise rewards and minimise costs in relationships (Blau, Reference Blau1964). When individuals obtain the rewards they desire (e.g., assistance, advice, status, access to others; Bentley et al., Reference Bentley, Galliher and Ferguson2007; Blau, Reference Blau1964), they are satisfied with the relationship (Laursen & Hartup, Reference Laursen, Hartup, Laursen and Graziano2002). However, all relationships bear costs to some extent (e.g., investment in one friendship thwarts opportunities for alternatives) though some costs are more onerous than others (e.g., criticism, exclusion, aggression). Likewise, some friendships are more beneficial than others. For example, resource-controlling powerful individuals are social resources in and of themselves; friendships with them give one access to the material and social world that one may not attain on one's own. These processes are likely automatic and subconscious (Bargh & Morsella, Reference Bargh, Morsella, Agnew, Carlston, Graziano and Kelly2009).
Resource Control Theory
Like exchange theories in general, resource control theory proposes that evolution has predisposed us to calculate costs and benefits associated with many behaviours, including behaviours related to material or social resource pursuit (i.e., resource control strategies). Those who are best able to access resources wield power, thus becoming attractive social partners. This prediction is rooted in the ‘social centrality hypothesis’ of resource control theory (Hawley, Reference Hawley1999) and is borne out in the positive association between resource control and friendship aspiration, a construct denoting desired affiliation (e.g., ‘Who do you wish was your friend?’; Hawley et al., Reference Hawley, Little and Card2007). By extension, powerful individuals should have the most friendship choices and freedom to enter and leave relationships at will. Because they have so many friendship opportunities, powerful individuals may refrain from fully engaging in their relationships as engagement reduces possibilities to pursue more attractive alternatives. At the same time, friends of powerful individuals may fully engage in the relationship in an effort to dissuade friends with power from pursuing alternative friendships (and thereby preserving their access to resources). Though they strive to maintain the relationship, friends of powerful individuals may also experience more costs in the friendship (such as exclusion and conflict) because their powerful friends have so many opportunities for other friendships. Powerful individuals, however, would be less likely to experience these same costs. Questions of resource control and its association with relationship influence (i.e., power imbalance within friendships), friendship enjoyment and engagement (rewards), and friendship conflict and criticism (costs) form the crux of the current project.
Current Project and Hypotheses
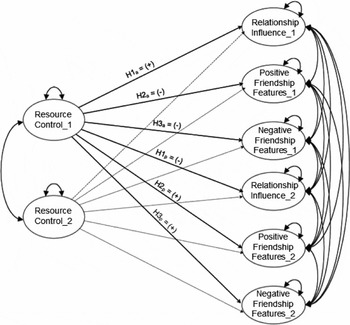
The current project utilises a latent actor-partner interdependence model (APIM; Kenny, Kashy, & Cook, Reference Kenny, Kashy and Cook2006) with interchangeable dyads to assess the effect that resource control (i.e., power) has on friendship features. Footnote 2,Footnote 3 Friendship features include: (a) the perceived influence that each individual has in the relationship (friend-reported), (b) the positive features of the friendship (companionship, disclosure, satisfaction, support, approval), and (c) the negative features of the friendship (pressure, conflict, criticism, exclusion).
All hypotheses are illustrated in Figure 1. There are three sets of hypotheses; we refer to them as ‘sets’ because each association involves two versions: an actor effect and a partner effect. An actor effect involves a within-person regression effect (i.e., how one's predictor affects one's own outcome) and a partner effect involves an across-person regression effect (i.e., how one's predictor affects one's partner's outcome).
Summation of Hypothesised Relationships

Hypotheses Regarding Influence in the Relationship
Keltner and colleagues (Reference Keltner, Gruenfeld and Anderson2003) contend that success in the material world is related to the ability to wield influence at the relationship level. Thus, we expect one's own perceived resource control to be positively associated with one's own perceived influence in the relationship (an actor effect) and negatively associated with one's friend's perceived influence in the relationship (a partner effect).
Hypotheses Regarding Positive Friendship Features
Positive friendship features involve components like companionship, disclosure, satisfaction, support and approval, features that characterise engagement or closeness in a friendship. As described above, powerful individuals may be reluctant to fully engage in friendships because engagement could prevent them from investing time in other friendships. Therefore, we expect that the more powerful an individual is perceived to be (i.e., the more perceived resource control one has), the less engagement (positive friendship features) he or she will report in the relationship (an actor effect). At the same time, the more powerful one is perceived to be, the more motivated his/her friends will be to maintain the positive aspects of a relationship by engaging in the friendship. We expect that the more perceived resource control an individual has, the more positive friendship features his/her friends will report (a partner effect).
Hypotheses Regarding Negative Features
Negative friendship features such as pressure, criticism, exclusion and conflict undermine friendship stability and the willingness of a partner to remain in a relationship. In other words, negative friendship features may be cost-bearing. Relationships with powerful individuals are valuable, therefore those with more perceived power should experience fewer negative features; otherwise they may be motivated to terminate the relationship. In sum, the more perceived power (i.e., perceived resource control) one has, the less likely one would report negative features in the relationship (an actor effect). At the same time, the more powerful an individual is perceived to be, the more negative features his/her friend may experience. For example, friends of powerful individuals may be criticised or excluded from activities on a regular basis. Thus, we expect one's own perceived resource control to be positively associated with one's friend's experienced negative friendship features (partner effect).
Method
Participants
The present study represents a portion of a larger project designed to study social relations, wellbeing and health in college students. Non-overlapping portions of these data have been published elsewhere on unrelated questions about attachment and sexual fantasy (Hawley & Hensley, Reference Hawley and Hensley2009; Hawley, Shorey, & Alderman, Reference Hawley, Shorey and Alderman2009). The current sample consists of 135 same-sex, college student self-identified friendship pairs (92 female dyads, 43 male dyads; mean age = 19.59 years; 84.9% Caucasian) who were recruited through the introductory psychology human subjects pool and from six group living residences at a large Midwestern campus. Participants who were recruited through the human subjects pool were asked to bring a close friend with them to the research session to represent a reciprocated friendship. Participants recruited from the group living residences were asked to nominate their two closest friends from within the hall. Research assistants matched friendship nominations so that all dyads consisted of individuals who mutually nominated each other and thus formed reciprocated friendships. Individuals, however, could nominate two friends and then report the relationship features of each friendship, thus creating the possibility that an individual might appear as a member of two friendship dyads. To ensure that friendship dyads were independent (i.e., that each participant was represented in one and only one dyad), research assistants and the authors checked all identification numbers to ensure that each individual appeared in the dataset only once. This procedure yielded 135 dyads.
All participants completed a paper and pencil battery of questionnaires under the supervision of research assistants. Participants within friendship dyads were asked to sit apart from and facing away from each other. All earned either course credit or a five-dollar voucher to a local movie theatre as compensation for their participation.
Measures
Perceived resource control (friend-reported)
Perceived resource control was assessed using the Friendship Inventory (Hawley, Reference Hawley2006), in which each participant was asked to report the resource control level of his or her friend. Resource control was represented by three items (‘How often does this friend get important information that others need or want?’ ‘How often does this friend get attention from high status/important people?’ ‘How often does this friend get material things that others value?’). Responses could range from (1) never to (5) always.
Perceived relationship influence, positive friendship features, and negative friendship features: Network of Relationships Inventory
The Network of Relationships Inventory (NRI; Furman & Buhrmester, Reference Furman and Buhrmester1985) is a questionnaire in which children and adolescents report their experiences in and the features of friendships. Each member of the friendship dyad completed the NRI to assess features within that dyad, and about behaviours of their dyadic partner. The NRI was modified for use in a college sample by altering language to be more appropriate for older samples.
Perceived relationship influence (friend-reported)
Within the NRI, each participant rated the influence that his or her friend wields in the relationship in terms of making decisions and driving the friendship. Relationship influence was assessed using three items from the NRI. An example item was: ‘How often does this friend get their way when you two do not agree about what to do?’ Responses could range from (1) never to (5) always, such that higher scores suggest participants believe that their friends have more power in the relationship.
Positive friendship features
Each participant was asked about the positive features that they perceived themselves to experience within their friendship. The positive friendship features construct was comprised of five subscale parcels (see below): companionship (e.g., ‘How often do you and this friend go places and do things together?’), disclosure (e.g., ‘How often do you share secrets and private feelings with this friend?’), satisfaction (e.g., ‘How happy are you with your relationship with this friend?’), support (e.g., ‘How often do you turn to this friend for support with personal problems?’), and approval (e.g., ‘How often does this friend seem really proud of you?’). Responses could range from (1) never to (5) always. Each subscale contained three items. Based on a confirmatory factor analysis model, all subscale parcels loaded onto a single higher order construct that we are labelling ‘Positive friendship features’, signifying rewards and benefits in a friendship.
Negative friendship features
The negative friendship features construct was comprised of four subscales: pressure (e.g., ‘How often does this friend push you to do things that you don't want to do?’), conflict (e.g., ‘How often do you and this friend disagree and quarrel with each other?’), criticism (e.g., ‘How often does this friend point out your faults or put you down?’), and exclusion (e.g., ‘How often does it seem like this friend ignores you?’). Responses could range from (1) never to (5) always. Each subscale parcel contained three items and, based on the factor structure, loaded onto a single higher order construct that we are labelling ‘Negative friendship features’, signifying costs in a friendship.
Analytic Strategy
Missing data
The dataset included less than 1.5% missing data on all variables. The missing data were imputed using a single imputation with the EM algorithm imputation procedure PROC MI in SAS (see Brown, Reference Brown2006). Auxiliary variables from the dataset relating to demographics, wellbeing and health were included in the imputation model to aid in the procedure. Including auxiliary variables in the imputation process can produce less biased estimates (Allison, Reference Allison2003).
Parcelling
Due to the large number of items comprising the positive and negative friendship features constructs (positive friendship features included 15 items and negative friendship features included 12 items), items were parcelled into subscales. Parcelling is an analytic technique that creates aggregates out of specific items and yields a more parsimonious and reliable structural model (Little, Cunningham, Shahar, & Widaman, Reference Little, Cunningham, Shahar and Widaman2002). Empirically, parcelling provides researchers with higher reliability as well as decreased Type 1 error rate and likelihood of dual factor loadings than item-level modelling (Little et al., Reference Little, Cunningham, Shahar and Widaman2002). After parcelling, the positive friendship features construct included five parcels: companionship, disclosure, satisfaction, support and approval. The negative friendship features construct included four parcels: criticism, conflict, pressure and exclusion.
Latent actor-partner interdependence model
Traditional regression-based statistical methods operate under the assumption of independence of observations and are inappropriate for dyadic data analysis because of the inherent dependency in dyadic data (Kenny et al., Reference Kenny, Kashy and Cook2006). Therefore, a latent actor-partner interdependence model was adopted for the present study (APIM; Kenny et al., Reference Kenny, Kashy and Cook2006; Olsen & Kenny, Reference Olsen and Kenny2006). The APIM can be used not only to model statistical dependency, but also allows for simultaneous estimation of the within-person (i.e., actor) and between-person (i.e., partner) regression paths that are characteristic of our hypotheses. In other words, the APIM allows us to estimate the impact that one's predictor variables has on one's own outcome variables (i.e., actor effects) and one's friend's outcome variables (i.e., partner effects). Including intraclass correlation estimates in the APIM serves to control for initial similarity in friends’ perceived resource control levels.
Modelling dependency and interchangeability in dyads requires statistically equating all corresponding estimates across dyad members. We followed the procedure outlined in Olsen and Kenny's (Reference Olsen and Kenny2006) paper for modelling interchangeable dyads, using structural equation modelling. Multiple constraints and parameter estimates were included in the structural model to model dyadic dependency and the interchangeable nature of the dyads. To model dyadic dependency, intraclass covariances and corresponding indicator residual covariances (e.g., Indicator 1 for resource control for Friend 1 and Indicator 1 for resource control for Friend 2) were freely estimated (Cook & Kenny, Reference Cook and Kenny2005). To model the interchangeability of the dyads, all corresponding pathways were equated across dyad members. That is, all parallel factor loadings, indicator residual variances, factor variances and covariances, actor effects and partner effects were equated across members of the dyads, yielding a model in which estimates for Friend 1 were equal to estimates for Friend 2. Finally, after the model was estimated, model fit statistics were corrected using Olsen and Kenny's (Reference Olsen and Kenny2006) recommendations.
Results
Preliminary Analyses
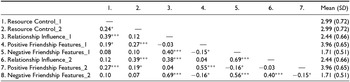
Table 1 includes means and standard deviations and intraclass correlations among variables of interest. Based on the correlational values, friendship dyads display a moderate level of homophily for all variables. The intraclass correlation among friends for resource control was 0.238, relationship influence was 0.384, positive friendship features was 0.552, and negative friendship features was 0.563. These correlations suggest that friends share some similarity in terms of power and perceptions of friendship, but friends are not identical on any measures.
Means, Standard Deviations, and Intraclass Correlations Among Primary Study Variables

Note: Variables labelled with _1 represent power and friendship variables for Friend 1; variables labelled _2 represent power and friendship variables for Friend 2. All parameters are constrained to be equal for Friend 1 and Friend 2. Results are controlling for gender.
*p < .05, **p < .01, ***p < .001
Structural Model
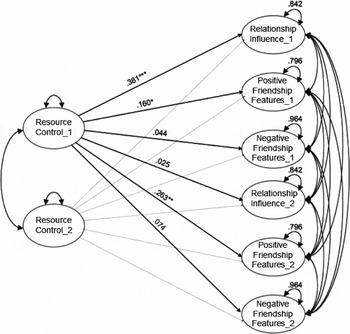
The final structural model is illustrated in Figure 2. The structural model fit the data, χ2(272) = 429.641, RMSEA = 0.066, TLI = 0.950; CFI = 0.946. The model explained 16% of the variance in relationship influence, 20% of the variance in positive friendship features, and only 4% of the variance in negative friendship features. Two significant actor effects and one significant partner effect emerged from the analysis.
Completely standardised regression paths for final model.

Resource control and relationship influence
As expected from our first prediction, one's perceived resource control is positively associated with one's perceived relationship influence (β = 0.381, p < .001). Thus, consistent with our first hypothesis, one's broader power level (resource control) is positively related to one's power within his or her friendships (an actor effect).
We expected one's perceived resource control to be negatively associated with one's friend's relationship influence, such that the more perceived power individuals have, the less willing they would be to allow their friends to drive their relationships (a partner effect). However, results indicate that one's perceived resource control is unrelated to one's friend's perceived relationship influence (β = 0.025, ns).
Resource control and positive friendship features
Contrary to our expectation, instead of one's perceived resource control being negatively associated with one's positive friendship features, we found resource control to be positively associated with one's own positive friendship features, β = 0.160, p < .05. Therefore, the more perceived power individuals have, the more positively they view their own dyadic friendships (an actor effect).
As expected, one's perceived resource control is positively associated with one's partner's positive friendship features (β = 0.263, p < .01). Therefore, the more powerful individuals are, the more positively their friends experience friendships (a partner effect).
Resource control and negative friendship features
Whereas we expected one's perceived resource control to be negatively associated with one's own negative friendship features (an actor effect), results indicate that resource control is unrelated to one's own negative friendship features (β = 0.044, ns), suggesting that one's power does not underlie one's negative perceptions of his or her friendships. Likewise, one's perceived resource control was also unrelated to one's friend's negative friendship features (a partner effect; β = 0.074, ns).
Discussion
The purpose of the current project was to illustrate the importance of studying friendships in the context of power. Power structures and interpersonal relationships are the two prominent features of social life that remain salient across the lifespan. Recent work has found that powerful individuals receive a disproportionate amount of friendship nominations (Hawley et al., Reference Hawley, Little and Card2007) and that friends of powerful individuals become more powerful over time (Dijkstra et al., Reference Dijkstra, Cillessen, Lindenberg and Veenstra2010; Marks, Cillessen, & Crick, Reference Marks, Cillessen and Crick2011). Taken together, these studies highlight the merit of researching power and friendships together. To date, however, little work has examined how power specifically affects the functioning of friendships themselves. We focused on how perceived power levels (resource control) affect perceptions of relationship influence, positive friendship features and negative friendship features for each member in dyadic friendships. Results suggest that, contrary to conventional wisdom, power is not poisonous to friendship functioning. In fact, even we had overestimated the negative associations between one's perceived power and one's partner's outcomes (i.e., partners do not suffer relationship costs) and underestimated the positive associations of one's perceived power on one's own outcomes (i.e., power did not reduce the desire to engage).
Resource Control and Relationship Influence
We expected to find patterns indicating that broad power levels (resource control) would relate to dyadic power levels (relationship influence) in different ways for members of friendship dyads. Namely, we expected one's own resource control to be positively associated with one's own influence in the relationship and negatively associated with one's friend's influence in the relationship. Hypotheses were partially supported.
Results indicate that one's own perceived resource control is positively associated with one's own relationship influence. Thus, individuals who are perceived to occupy a higher place in the broad power hierarchy are perceived to have more influence within their dyadic friendships, a finding that aligns well with Keltner et al.'s (Reference Keltner, Gruenfeld and Anderson2003) view of power. At the same time, however, one's resource control is unrelated to one's friend's influence in the relationship. We expected to find a pattern in which one's own resource control would be associated with the subjugation of one's friend's relationship influence. In essence, we expected perceptions of power to be associated with ‘driving’ a friendship and preventing others’ influence. Instead, an individual's perceived resource control appears to function as a benefit for that person, but does not carry the expected costs for the partner; higher influence for one person in a friendship does not necessitate lower influence for the other.
Alternatively, this pattern of results may vary, based on personal characteristics or contextual effects. For example, individuals with different motivational characteristics (agentic, affiliative, separate, submissive; Ojanen, Gronroos, & Salmivalli, Reference Ojanen, Gronroos and Salmivalli2005) may view the purpose or function of friendship differently and act accordingly. The association between perceptions of resource control and friendship characteristics may be different for those who display a primarily agentic motivational profile versus those who are more submissive. Distinguishing dyad members by their relative motivations may reveal a different pattern in friendship functioning. Second, according to resource control theory and some ethological work (Pellegrini, Reference Pellegrini2008), resource control can be gained through multiple avenues: individuals can gain resources coercively (e.g., taking resources by force) or prosocially (e.g., mutual reciprocation). Patterns of behaviour within friendships could depend on how power is gained and wielded. Individuals who gain their power coercively (coercive controllers; Hawley, Reference Hawley1999) may be unwilling to yield some of the decision-making capabilities to their relationship partners. Those who gain their power through prosocial means (prosocial controllers; Hawley, Reference Hawley1999) or through a combination of prosocial and coercive strategies (bistrategic controllers; Hawley, Reference Hawley2003) may allow or encourage their friends’ involvement in the relationship. Aggregating these distinct behavioural profiles may have washed out some more nuanced effects. Unfortunately, for the present work, a lack of statistical power prevented us from testing these potential moderators.
Resource Control and Positive Friendship Features
We expected perceived resource control to show different patterns of association with one's own and one's friend's positive friendship features. First, we expected one's perceived resource control to be negatively associated with one's own positive friendship features (an actor effect). In essence, we hypothesised that perceived resource control may carry a reluctance to engage in friendships because engagement reduces opportunities to pursue more attractive alternative relationships. Instead, one's own resource control is positively associated with one's own positive friendship features, suggesting that an individual's resource control level does not serve as an impairment from engaging in his or her friendships. Instead, one's resource control may actually promote healthy friendships. Perhaps powerful individuals consider their friendships to be safe havens from status attacks, as the more power individuals have, the more they find themselves the target of these attacks (Eder, Reference Eder1985; Prinstein & Cillessen, Reference Prinstein and Cillessen2003).
Second, we expected one's own perceived resource control to be positively related to one's friend's positive friendship features (a partner effect). Maintaining friendships with powerful others facilitates one's own access to resources (LaFreniere & Charlesworth, Reference LaFreniere and Charlesworth1987); therefore, we expected that the more power an individual is perceived to have, the more his/her friends would engage in relationship enhancing behaviours (e.g., sharing secrets, showing support) to maintain the friendship. Indeed, results indicate that an individual's perceived resource control was positively associated with his/her friend's positive friendship features. Taken together, positive actor and partner effects suggest that perceived power functions as a relational benefit for both individuals in a friendship. As we consider friendships to be a social resource, both individuals may realise the social benefits associated with friendships and therefore work to engage and maintain healthy friendships.
These findings may again vary, based on behavioural profiles of each individual. Those who gain their power through prosocial means (either alone or in combination with coercive means; prosocial and bistrategic controllers) report higher levels of closeness and fun within their friendships than those who gain their power through purely coercive means (coercive controllers; Hawley et al., Reference Hawley, Little and Card2007). A lack of statistical power prevented us from exploring these possible differences.
Power and Negative Friendship Features
We expected one's own perceived resource control levels to be negatively associated with one's own negative friendship features and positively associated with one's friend's negative friendship features. Results indicate, however, that resource control was uncorrelated with negative friendship features for both friends. Resource control levels neither protect individuals from negative friendship experiences nor expose individuals to greater levels of negative friendship experiences.
This pattern of findings stands in stark contrast to the dark powerful figure characterised by classical literature and historical figures (as Shakespeare and Madison depicted), and mainstream thinking. Instead of power being associated with social malfunction and volatile relationship functioning, we detected uniformly positive associations between resource control and friendship functioning constructs. Power appears to denote a satisfaction in friendship for both individuals involved, without carrying expected direct relational costs. These unexpected results may again be the byproduct of aggregating multiple behavioural styles within friendships. Previous work has shown that those whose behavioural profiles include high levels of coercion (coercive controllers and bistrategic controllers) report higher levels of conflict within their friendships, and those whose behavioural profiles involve prosocial behaviours (prosocial controllers) report lower levels of conflict within their friendships (Hawley et al., Reference Hawley, Little and Card2007). Our restricted sample size precludes us from testing whether friendships function differently for bistrategic controllers versus coercive controllers versus prosocial controllers.
Limitations and Future Directions
All data for the current study are cross-sectional, so we are unable to describe or deduce causality. Hypotheses and discussions are framed in terms of perceptions of resource control affecting influence and positive and negative features within a friendship, but it could be that friendship functioning affects perceptions of resource control. Those who experience many positive friendship features may be more likely to view their friends as powerful and vice versa. Without dyadic follow-up data, important questions about how resource control shapes dyadic friendship over time (or how friendship affects perceived power levels over time) remain unanswered. These questions require longitudinal dyadic analyses (e.g., Kubacka, Finenauer, Rusbult, & Keijsers, Reference Kubacka, Finkenauer, Rusbult and Keijsers2011) paired with social network analyses to uncover complex processes.
Second, dyads in this study are treated as interchangeable. Whereas recent social network analyses suggest that adolescents maintain friendships with similar-status peers (Dijkstra et al., Reference Dijkstra, Cillessen and Borch2013), the intra-class correlation for resource control in the current study was 0.238, implying that friends are not identical in terms of power level. Taking a closer look at friendship balance in terms of higher and lower resource controlling friends may prompt interesting questions as associations may depend upon relative levels of resource control. However, initial analyses that involved identifying each dyad member in this sample as the higher or lower resource controlling friend resulted in models that did not fit the data (see Endnote 3). Collecting longitudinal data or expanding the sample size may yield different results.
Third, though including friend-reported resource control in analyses demonstrates that relationship partners are cognisant of each other's power levels (and provides ecological validity to the idea that perceptions of power can affect dyadic friendship functioning), assessing self-reported resource control may yield a different pattern of results. At the same time, however, one strength of the current study is the use of multiple perspectives (e.g., friend-reported resource control, self-reported positive friendship features) in pursuing some of the questions of interest.
Future work should examine additional potential moderators in the associations between resource control and friendship functioning variables. Associations may vary, based on individual personality characteristics or motivations, resource control strategies employed both within and outside friendships, or length of friendship. Larger studies, particularly those involving longitudinal work, are necessary to provide a more nuanced understanding of the role of resource control within friendships.
On the Pursuit of Power and Friendship
Despite methodological limitations, the current project contributes to theoretical understanding of power relations and dyadic friendships. Though we broadly examine how perceptions of power can affect general functioning of dyadic friendships, the overall goal is to initiate a research tradition that incorporates the pursuit of power into questions related to friendships. Until this point, few researchers have pursued research questions related to both friendship and power (but see Dijkstra et al., Reference Dijkstra, Cillessen and Borch2013; Dijkstra et al., Reference Dijkstra, Cillessen, Lindenberg and Veenstra2010; Marks et al., Reference Marks, Cillessen and Crick2011).
One reason why friendship and power are traditionally investigated separately is because they differ in their fundamental, defining components and assumptions. Individuals voluntarily organise themselves into egalitarian friendships, a system that appears in stark contrast to the hierarchically organised power system. However, studies suggest that many (if not most) dyadic friendships are not egalitarian (Davidson & Duberman, Reference Davidson and Duberman1982; Veniegas & Peplau, Reference Veniegas and Peplau1997) and that seeking out certain friendships can function as a gateway to power (Dijkstra et al., Reference Dijkstra, Cillessen, Lindenberg and Veenstra2010). Indeed, powerful individuals of many species enjoy a social allure (Hawley, Reference Hawley1999).
New research may be more fruitful if researchers consider Bakan's fundamental modalities of social life as complementary rather than opposing forces. Thinking of the social system in this way could open the floodgates for new research questions related to uncovering the complex and dynamic interplay between power structures and friendship functioning. Future work should take a more nuanced approach to uncover some potential moderators and mediators to the presented patterns of association. For example, examining relative power (resource control) and magnitude of power differences among members of friendship dyads may produce different patterns of results. Examining how entire friendship networks relate to power systems (and how changes in friendship networks are related to changes in power levels) could inform future work in analyses of bullying, risky decision making, substance use, and any number of other applied areas of interest. If power is associated with positive and healthy friendships, then powerful individuals enjoy large amounts of social support. Therefore, if powerful adolescents are engaging in negative behaviours such as bullying or substance use, then practitioners addressing those behaviours may face difficulty breaking through the supportive context. At the same time, if those in powerful positions display positive prosocial behaviours, those behaviours may spread through their healthy friendships as well.
Finally, adolescent friendships can act as a staging ground for future romantic relationships (Connolly, Furman, & Konarski, Reference Connolly, Furman and Konarski2000). In college, the roles of friends and romantic partners are often afforded equal importance (Furman & Wehner, Reference Furman and Wehner1997). Therefore, this study examining the role of perceived power in late adolescent friendships may be informative for the study of power in late adolescent romantic relationships. Though work has approached questions of dyadic power imbalance and its effects on relationship functioning (e.g., Gray-Little & Burks, Reference Gray-Little and Burks1983), questions regarding how broad power levels (e.g., resource control, or other group-level indices of power) affect romantic relationships are largely unexplored. Powerful individuals are attractive relationship partners (e.g., Hawley & Hensley, Reference Hawley and Hensley2009), but how (or if) those power levels affect romantic relationship functioning remains unknown.