Electoral fraud Footnote and election-related violence undermine the quality of democratic elections. Existing data suggest that both are pervasive. One estimate suggests that major incidents of fraud affected about a quarter of elections held worldwide between 1980 and 2004.Footnote 1 Electoral violence and voter intimidation are also widespread, especially in sub-Saharan Africa.Footnote 2 Large-scale violence occurred in around 10 percent of all elections held in the region between 1990 and 2008, while violent harassment and voter intimidation were prevalent in about 38 percent of elections.Footnote 3
To combat fraud and election-related violence, domestic and international organizations routinely deploy election observers to monitor elections.Footnote 4 In this article, we examine the causal effects of domestic election observers on these two strategies of electoral manipulation in Ghana. We address two sets of questions about how the presence of observers seems to coincide with election-day fraud and violence that occur in and around polling stations. First, we ask whether observers reduce fraud and intimidation at the polling stations that they monitor. Second, we investigate whether political parties respond to observers by shifting fraud or violence to polling stations without observers; that is, we examine whether observers have ‘spillover effects’.Footnote 5 By studying spillover effects and how they vary by strategy (fraud or violence) and by local political conditions, we are able to learn about the contexts in which political parties are likely to engage in electoral fraud or violence. Our analysis thus contributes to understanding how political parties select from the diverse ‘menu of manipulation’ in different political environments.Footnote 6
Our theoretical framework emphasizes the role of local party activists in committing or coordinating electoral malfeasance.Footnote 7 These activists commit electoral fraud in polling stations by, for example, voting multiple times, stuffing extra ballots into boxes, or co-opting local electoral officials to alter the final results. They are also often responsible for electoral violence and voter intimidation, engaging in it themselves or mobilizing others to do so. We highlight that electoral fraud and violence are shaped by the capacity and incentives of party activists.Footnote 8 Since observers reduce both capacity and incentives at the polling stations that they monitor, we expect that they should, therefore, reduce electoral fraud and election violence in monitored stations. However, because capacity and incentives vary across local contexts, we expect that the response of party workers to observers will vary with the local partisan and electoral context. In single-party dominant areas where one party controls local politics and enjoys strong partisan connections to the population, parties have a greater capacity to shift fraud to polling stations without observers and less incentive to engage in violence. By contrast, in competitive areas, parties have less capacity to shift fraud to polling stations without observers and greater incentive to engage in violence and intimidation. Thus, we expect to see spillover effects related to fraud in single-party dominant areas and spillover effects related to violence in electorally competitive areas.Footnote 9
We provide evidence for this with data from a field experiment conducted during Ghana’s 2012 presidential and parliamentary elections. Ghana provides an excellent setting for this research for at least two reasons. First, Ghana’s political system is characterized by the conditions that are expected to incentivize electoral fraud and election-related violence, including intense electoral competitionFootnote 10 and a majoritarian, single-member-district electoral system.Footnote 11 Indeed allegations of fraud and instances of violence and intimidation have occurred in each election since the return to multi-party democracy in 1992. The results of the 2012 elections were challenged in Ghana’s Supreme Court by the country’s main opposition party on grounds of widespread fraud and irregularities. And although Ghana has not witnessed large-scale electoral violence, elections have been fraught with localized incidents of violent harassment and voter intimidation.Footnote 12 Second, Ghana is characterized by substantial variation in partisan competition at the local level, which we leverage to test our hypotheses.
In line with past studies of election observers,Footnote 13 our research design involves the random assignment of an election observer to each of over 1,000 polling stations located in four of Ghana’s ten regions.Footnote 14 Each observer is assigned to a single polling station, and is present from the opening of the polls to the conclusion of the public vote count at the end of the day. We also go beyond much of the existing literature on observers and implement a randomized saturation experimental design,Footnote 15 detailed below, which allows us to estimate and account for spillover effects.
We study observers’ impact on several indicators of electoral fraud and electoral violence. As a proxy for fraud, we use the voter turnout rate at each polling station in our sample. High turnout rates are not always indicative of fraud – though we record turnout rates of over 100 percent at about 4 percent of polling stations – but turnout should not vary with the presence of a randomly assigned observer. If the turnout rate is lower in the presence of an observer, this suggests potential fraud at polling stations without observers. We also create indicators of fraud by coding a polling station as having suspiciously high turnout by examining significant deviations from mean and median turnout in individual constituencies.Footnote 16 To measure polling station violence and intimidation, we use survey data collected from election observers as well as officials and party representatives at polling stations.
We found that election observers reduced electoral fraud and violence at the polling stations that they had monitored. Regarding spillover effects, we found evidence suggesting that parties shift fraud to stations without observers in single-party dominant constituencies. We found no such displacement effect in competitive constituencies. By contrast, we found statistically strong evidence that parties move electoral violence to stations without observers in electorally competitive constituencies, while there was no evidence of this in single-party dominant areas. These patterns are consistent with our theoretical expectations.
Our study makes several contributions. First, our research is one of the few to study electoral violence experimentally. Our study relates to the work of Collier and Vicente, which experimentally examines the effects of an anti-violence campaign in Nigeria, and finds that the campaign reduced violence and increased voter turnout.Footnote 17 We study the impact of a different program and investigate how parties move violence spatially in response to interventions designed to reduce it. Our findings suggest that electoral violence is likely to occur in electorally competitive contexts, where parties lack the capacity or opportunity to engage in fraud.
Second, this article is among the first to study electoral fraud and election-related violence simultaneously.Footnote 18 Our evidence increases our understanding of how parties select from the diverse electoral manipulation strategies at their disposal in different contexts.Footnote 19 Our contribution relates to that of Weidmann and Callen, who studied the effects of non-election violence in Afghanistan on electoral fraud.Footnote 20 Our study is distinct in that we examine how parties use both electoral fraud and electoral violence to influence election results in a competitive democracy. This article also complements the work of Bratton, which studies vote buying and violence in a Nigerian election,Footnote 21 as well as that of Collier and Vicente and of Robinson and Torvik, who have predicted the conditions where parties will engage in fraud versus violence.Footnote 22
Finally, we advance the literature on election observation in several ways. First, similar to the work of Enikolopov et al. we focus on domestic rather than international observers, and provide evidence that domestic observers are able to reduce electoral fraud and violence.Footnote 23 Second, the election observation literature to date has focused on the effect of observers on patterns of electoral fraud. In investigating both electoral fraud and violence, we provide a more complete account of how observers have an effect on electoral manipulation.
ELECTORAL FRAUD, VIOLENCE, AND THE IMPACT MADE BY ELECTION OBSERVERS
Electoral fraud and violence may help to explain the mixed performance of formal democratic institutions around the world. Electoral fraud is problematic for democracy because it involves secret and illegal efforts to influence and distort election results.Footnote 24 In this article, we focus on election-day fraud that occurs at the level of the polling station. Instances of this form of fraud include unregistered voters casting ballots; multiple voting; stuffing the ballot box; and tampering with results at the close of polls. We focus on polling station fraud for a number of reasons. First, this is a form of fraud that can be widespread even in a competitive democracy, as our data corroborate. Second, political parties may be more likely to manipulate polls locally rather than nationally because of the limited scrutiny of local polls by journalists, opposition members, and the international community.Footnote 25 Third, election observers are deployed on the day of an election to monitor polling stations and are, therefore, most likely to have an effect on this type of fraud.
Electoral violence is equally problematic from the perspective of democratic accountability and representation as political parties typically use coercion and intimidation to demobilize and disenfranchise targeted populations.Footnote 26 Violence was, as we have already noted, not uncommon in Africa in the last quarter century. Violent harassment and voter intimidation – phenomena which include harassment or intimidation of voters, police or other security forces breaking up rallies, fights between party supporters, and arrests of political opponents – were prevalent in 38 percent of elections held in the region during the same time period. Our focus in this article is on violent harassment and voter intimidation, which the Straus and Taylor data show were prevalent during Ghana’s 1992, 2004, and 2008 elections.Footnote 27
Theoretical Expectations
To engage in electoral fraud and violence, political parties often rely upon their local party activists, sometimes called party brokers.Footnote 28 Together, these actors make up the local loyalty networks of the competing parties.Footnote 29 In Ghana, political parties are organized as decentralized networks of these activists. Much like political parties in other democracies, and in particular like most clientelist parties, the parties are organized hierarchically. Their structure includes many layers, beginning at the level of the individual polling station and rising up to the constituency, regional, and national levels.Footnote 30 Ghana’s two major political parties both have organizational presence in all of the country’s 275 electoral constituencies. Because in Ghana votes in the presidential contest count equally across the country, parties have strong incentives to maximize votes in all constituencies, regardless of the local level of electoral competition.
The most important role of the party activist is to mobilize and deliver votes.Footnote 31 Party brokers are motivated by a combination of ideological and material considerations. Many voters in Ghana often have strong partisan attachments,Footnote 32 and activists seek to advance the political agenda of their preferred party. Many brokers also seek career advancement in the party hierarchy: success as a party activist is perceived as a stepping stone toward candidacy for elected office or for a higher ranked party position.Footnote 33 Since votes are counted in public at each polling station and then collated and reported at the constituency level, party leaders are able to evaluate the performance of their activists on election day.
Party activists are often the main perpetrators of election-day fraud. They commit fraud by engaging in multiple voting, stuffing ballot boxes, or mobilizing ordinary citizens – for example, by coercing underage citizens or foreign nationals to vote. Activists often also co-opt local election officials so that they turn a blind eye on fraudulent activities or agree to inflate vote tallies.Footnote 34
To engage in violence and intimidation, party activists might act alone or enlist the services of vigilante groups – popularly known as ‘macho men’ in GhanaFootnote 35 – to intimidate voters, steal ballot boxes, and tear down campaign posters of opponents.
Direct Effects of Observers
We expect election observers to reduce electoral fraud and violence by affecting the incentives and capacity of party activists and electoral officials to engage in these illegal activities.Footnote 36 Since observers monitor one polling station from the opening of the polls through the counting of votes, the presence of an observer substantially increases the likelihood that fraud or violence will be detected. Therefore, observers increase the potential costs of manipulative tactics and constrain opportunities for party activists to engage in them.
The costs created by observers can come in many forms. Since observers usually report irregularities and intimidation of voters to central officials, party activists may fear legal action should their actions be detected. A second cost could be reputational. Party brokers are often recruited from their local communities and may fear social sanctions should their manipulation be exposed. The costs may also be psychological. Many people wish to avoid cheating in front of others.Footnote 37
Observers are also likely to constrain the capacity of local party activists to engage in fraud and violence. This is especially the case with respect to electoral fraud, as polling station fraud often depends on the co-optation of local electoral officials or on the complicity of ordinary people. The presence of an election observer likely diminishes the ability of party brokers to rely on these groups. Polling station officials, for example, face legal and reputational costs should they be found to facilitate ballot stuffing. They also risk losing access to government jobs in the future. Observers may also activate democratic norms, empowering citizens to speak out when they witness anti-democratic behavior. Therefore, we expect election observers to reduce the motivation and capacity of party activists and election officials to commit fraud and to engage in violence at the polling stations that are under observation.
HYPOTHESIS 1: Observers will reduce fraud at the polling stations that they monitor.
HYPOTHESIS 2: Observers will reduce violence and intimidation at the polling stations that they monitor.
Local Political Context and the Spillover Effects of Observers
Political parties are concerned about maximizing votes in the constituency or country as a whole. Political party activists engaged in illegal behavior are, therefore, likely to respond to the presence of observers by shifting these activities to stations without observers. That is, observers may create spillover effects. The existing literature provides evidence consistent with this. For example, Ichino and Schündeln show that parties responded to observers by moving fraud to nearby but unmonitored registration centers in the same constituency during Ghana’s 2008 voter registration process.Footnote 38 Observers may also deter fraud at unobserved polling stations, which Enikolopov et al. find in their study of Russian parliamentary elections.Footnote 39 The literature has yet to investigate, however, the effect of observers on patterns of violence.
Generally, networks of party activists coordinate a political party’s response to election observers. Thus, the precise way that spillovers work will vary across contexts depending on the structure of party organization and the technologies used by party activists to share information. In Ghana, party activists sit at the bottom of each party’s constituency level operation. Each constituency has a constituency organizer, who is responsible for running the party’s campaign in that constituency. At the more local level, each party elects Electoral Area (EA) and polling station organizers who coordinate the activities of party workers in each local area.Footnote 40 Within these sub-constituency networks, party activists can communicate with one another using cell phones to report which stations do and do not have observers. They can also travel the relatively short distances between polling stations in the same local area to communicate in person with party activists. EA organizers can also report information to the party’s constituency organizer, who can transmit that information to other party activists in the constituency. Because election observers in Ghana monitor a single polling station for the entire day, it is possible for party activists to record information on the locations of observers and to coordinate a response.
We expect that the local electoral and partisan context conditions whether this response is likely to center on efforts to engage in fraud or to intimidate voters at polling stations without an election observer. The local context is important because it shapes the opportunities and incentive of parties to engage in fraud and violence. We distinguish single-party dominant areas from electorally competitive ones. For reasons that we outline below, these local contexts vary in the opportunities that they afford parties to shift fraud to polling stations without observers and in the incentives to engage in violence and voter intimidation.
Regarding opportunity, we expect that political parties will have greater opportunities to shift fraud to polling stations without observers in single-party dominant constituencies. In such contexts, ordinary people and electoral officials – themselves recruited from the local population – are likely to be strong supporters of the dominant party. They thus have little incentive to report fraud and are likely easier to co-opt. Where parties are politically dominant, they also often control resources that can be used to pressure electoral officials, and potentially even opposition party brokers, into compliance. Because, by definition, dominant parties enjoy widespread partisan support and control local politics across an entire constituency, their options for shifting fraud away from monitored polling stations are vast. When an observer arrives at one, there are many options for party activists to choose from if they are seeking to commit fraud.
In competitive areas, parties do not enjoy strong partisan support across the entire constituency. They also face greater oversight and monitoring by the competing party. Party activists may, therefore, have the opportunity to commit fraud at only a small number of polling stations in the constituency. When an observer arrives at one, the options available for strategic relocation are limited. Thus, while motivations to commit fraud might be higher in electorally competitive areas,Footnote 41 the opportunities for parties to shift fraud in response to observers will be fewer.
Although parties have more opportunities to shift fraud around in their stronghold areas, their incentives to engage in violence or intimidation in these areas would be low. Electoral violence and intimidation are typically tools to demobilize voters and to drive down the turnout of targeted populations.Footnote 42 Single-party dominant areas are populated largely by supporters of the dominant partyFootnote 43 and the dominant party will have little interest in disenfranchising those who are most likely to vote for them. In addition, there are audience costs to violence. Since voters are normally averse to violence and it is easily observable, the activists of the dominant party risk alienating their supporters in core areas if activists use electoral violence there.Footnote 44 Thus, parties have less incentive to engage in voter intimidation in their strongholds.Footnote 45
In electorally competitive areas, by contrast, parties have more incentive to engage in violence. One reason is that local party organizations are interested in getting a majority in both presidential and parliamentary elections. In the presidential race, winning the constituency for the party can create opportunities for party activists and politicians in terms of jobs in the incoming administration. All else equal, party incentives to manipulate the election, using either fraud or violence, are therefore greater in competitive areas.Footnote 46 Because observers limit opportunities for fraud and parties have limited capacity to move fraud around in response to them, we expect parties to respond to observers by engaging in violence, a tactic that requires far less organizational capacity and complicity of the local population. A second reason is that electorally competitive areas are more populated with the types of voters that parties have incentives to target with violence. There is evidence from studies of African elections that suggest that parties often intimidate swing votersFootnote 47 or weakly aligned supporters of the opposition.Footnote 48 In Ghana, electorally competitive constituencies are home to large numbers of such voters. Thus, incentives to engage in violence and intimidation in response to observers are greater in competitive areas.
HYPOTHESIS 3: In single-party dominant areas, parties will respond to observer presence by shifting electoral fraud to polling stations without observers.
HYPOTHESIS 4: In electorally competitive areas, parties will respond to observer presence by shifting violence/voter intimidation to polling stations without observers.
GHANA’S POLITICAL CONTEXT
Since its transition to democracy in 1992, Ghana has conducted increasingly competitive presidential and parliamentary elections every four years. Three of these elections (2000, 2008, and 2016) resulted in alternations of executive office. In this article, we focus on the 2012 presidential race.Footnote 49 Ghana is divided into ten administrative regions. There are 275 electoral constituencies nested within these regions. The president is elected in a majoritarian run-off system from a single national constituency.Footnote 50 Although votes for the president are aggregated across the country, ballots are counted at individual polling stations at the close of polls and aggregated at the constituency level prior to transmission to the national office of the Electoral Commission. This procedure incentivizes local party activists to maximize the number of votes for their presidential candidates within their constituencies.
Ghana has a two-party system. The two major parties – the National Democratic Congress (NDC) and the New Patriotic Party (NPP) – routinely capture the vast majority of votes in presidential elections. In 2012, the two parties received over 98 percent of the presidential vote. The NPP and NDC are multi-ethnic and multi-regional in composition. However, each party has regions where its support is particularly concentrated:Footnote 51 the NDC attracts the support of most voters in Volta, whereas the NPP draws its strength from the Ashanti region.
Ghana’s elections have routinely suffered from allegations of fraud and malpractices.Footnote 52 Allegations of electoral irregularities prior to the December 2012 elections have been reported in each stage of the election process; during voter registration, on election day, and while votes are aggregated. In earlier elections, political parties alleged that the voter register was inflated with names of ghost voters, minors, and foreign nationals (from neighboring Togo and Côte d’Ivoire).Footnote 53 On election day, allegations of malpractice often involve attempts by party activists to stuff ballot boxes, to vote multiple times by impersonating absent voters, or to vote at more than one polling station. A consequence of multiple voting and ballot stuffing is an unreasonably high level of turnout at polling stations. Turnout figures above 95 percent, for example, were recorded in five constituencies in Ashanti during the 2008 elections.Footnote 54 The post-election petition presented to Ghana’s Supreme Court by the opposition NPP in 2012 centered on allegations of unrealistically high turnout, with rates above 100 percent at 1,826 (7 percent) polling stations.
While Ghana has not experienced large-scale electoral violence, low intensity violence and voter intimidation have been prevalent in each national election held since 1992.Footnote 55 According to Gyimah-Boadi and Brobbey, ‘Ghanaian elections have been fraught with extreme tension, including intimidation, organized thuggery, and sporadic flare-ups of interparty violence’.Footnote 56 Politicians regularly enlist the services of vigilante groups to intimidate voters, and to snatch ballot boxes and destroy campaign posters of opponents.Footnote 57 As Amankwaah notes, ‘macho men exist in the imagined national history … of Ghanaian election-related violence as thugs, who [sic] political leaders commonly hire during elections to snatch ballot boxes and intimidate voters at polling stations in various places around the country’.Footnote 58 Political parties often frame elections in military terms. Indeed one of the major political parties has established a ‘Heroes Fund’ for party activists who sustain injuries during campaigns.Footnote 59 Hate speech on local radio stations has also created tensions and led to pockets of violent clashes during national elections.
Domestic Election Observers
To promote clean elections, a coalition of civic organizations came together to observe the 1996 general elections. In 2000, the Coalition of Domestic Election Observers (CODEO) was formally established. Since then, CODEO has led domestic efforts to monitor elections.Footnote 60 CODEO is widely viewed as non-partisan and independent.
The Electoral Commission of Ghana accredits election observers. Accreditation gives observers the right to access and observe proceedings at any polling station or vote aggregation center. All observers swear a public oath to act impartially and support the conduct of free and fair elections. Each observer is assigned to one polling station that she observes from the opening to the close of polls, and remains on site for the public vote count that takes place at the end of the day at each polling place. Uniforms (i.e., official CODEO T-shirts and caps) ensure that observers are easily identifiable to election officials and voters. At polling stations, election observers usually position themselves away from other officials and party agents. Throughout the day, they report to a national co-ordination center using text messages. If an observer reports a serious incident of fraud, misuse of equipment, or violence, CODEO uses its communication structure to alert appropriate legal and security officials. CODEO also releases press statements throughout the day, as well as in the days and weeks following the close of polls.
RESEARCH DESIGN
To estimate the effects of election observers on fraud and violence, we implement a randomized saturation experimental design.Footnote 61 This section details the design.
Sampling
We conduct the study in four of Ghana’s ten regions: Ashanti, Central, Volta, and Western. These regions are located in the southern part of the country.Footnote 62 Each region is divided into political constituencies, from which Members of Parliament are elected. We selected these regions because they vary in their degree of electoral competitiveness. Ashanti and Volta are the historic strongholds of the two major political parties, while Central and Western are electorally competitive. Historical voting patterns illustrate the variation in electoral competition across these constituencies. In the 2008 elections, the NPP won 73 percent of the vote in its stronghold, Ashanti, while the NDC’s vote share in that region was 26 percent. In Volta, the NDC stronghold, the NDC won 83 percent of the vote in 2008, while the NPP won 15 percent. Western and Central, by contrast, were far more competitive. In Central, the NDC’s vote share was 51 percent and the NPP’s vote share was 46 percent. In Western, the NDC won 46 percent and the NPP won 50 percent.
We hypothesized that a party’s response to observers may be conditioned by local electoral competition. Accordingly, we sample to get a mix of electorally competitive and non-competitive constituencies. We code a constituency as electorally competitive if the vote margin between the top two presidential candidates was less than 10 percentage points in the 2008 election, and non-competitive otherwise.Footnote 63 As spillover effects may also be affected by the physical distance between polling stations, we distinguish constituencies by their polling station density. We code a constituency as having a high polling station density when it has a higher than the median number of polling stations per square kilometer.Footnote 64
There are 122 constituencies in our four study regions, and we randomly sample sixty. Twenty-three constituencies met our definition of electorally competitive. We sampled all of them. Of these, twelve have high polling station density and eleven have low polling station density. We then randomly selected thirty-seven non-competitive constituencies, eighteen from high and nineteen from low polling station density constituencies. In the final stage of our sampling process, we randomly selected 30 percent of polling stations in each of our sixty constituencies to form the sample.
Two-Stage Randomization
To assign treatment, we used a two-stage randomization process. In the first stage, we randomly assigned each constituency to one of three saturation levels: low, medium, and high. In the low condition, we treat 30 percent of sample polling stations with an observer. In the medium condition, we treat 50 percent of sample polling stations. In the high condition, we treat 80 percent.Footnote 65 To ensure that we have different types of constituencies at each saturation level, we randomly assign these saturations within the four groups of constituencies discussed above. To improve our ability to measure spillover effects precisely, we assign the low condition with 20 percent probability and the medium and high conditions each with 40 percent probability.Footnote 66 We denote the treatment condition of a constituency by S, where s is equal to one of the three saturation levels. Online Appendix A shows the allocation of our sixty constituencies to each constituency type.
In the second stage, we randomly assigned polling stations to treatment or control. The probability of treatment is determined by the constituency-level observer saturation. For example, in the low condition constituencies, polling stations in the sample are treated with probability 0.3. We denote polling station treatment status as T, where t is equal to 1 (treated) or 0 (control).
This procedure yields a 3× 2 experimental design. Our randomization process thus classifies polling stations into six groups: treated polling stations in low, medium, and high saturated constituencies, and control polling stations in low, medium, and high saturated constituencies. There are a total of 2,310 polling stations in our sample. Online Appendix B provides evidence of covariate balance.Footnote 67
Assumptions
Our framework relies on one central assumption: spillover effects will occur within constituency boundaries. This assumption is plausible given the structure of political parties in the country. Ghana’s two major parties are organized hierarchically, with relatively independent party organizations operating at the constituency level.Footnote 68 These constituency-level organizations are further organized into more localized networks of party activists. Given this structure, responses to observer presence are likely to be confined within constituency boundaries.Footnote 69
Our design allows us to measure average spillover effects within constituencies without making any other assumptions about the structure of spillover. This approach is beneficial in our application because spillover effects are likely to take multiple forms. For example, party activists might shift manipulative strategies to control stations that are nearby (spatial spillover), or they might coordinate via cell phone to relocate malfeasance as far away as possible from observers within the same constituency. If we were to assume that spillovers were only spatial, we would miss the latter. The benefit of our design is that it allows us to measure all forms of spillover on average within a constituency.
Estimation
Our unit of analysis is the individual polling station.Footnote 70 In our framework, potential outcomes at the polling-station level are determined by two factors: the individual station’s treatment status (treatment or control); and the treatment condition of the polling station’s constituency (low, medium, or high). Thus, potential outcomes can be written as follows:
 $$Y_{{i\,j}} (T_{{i\,j}} ,\,S_{j} )$$
where Y ij indicates fraud or violence at polling station i in constituency j. T ij indicates the treatment status of polling station i in constituency j (T ij =1 if an observer is present, and 0 otherwise). The constituency level treatment status is indicated by S j , where S j =s and s takes a value of low, medium, or high.
To estimate the direct effect of election observers, we first estimate the intention-to-treat (ITT) effect. We do so by comparing treated stations to control stations as follows:
 $$ITT{\,\equals\,}E(Y_{{i\,j}} \,\mid\,T_{{i\,j}} {\,\equals\,}{\rm 1}){\minus}E(Y_{{i\,j}} \mid T_{{i\,j}} {\,\equals\,}0)$$.
Because of our randomization procedure, polling stations at different levels of S j are assigned to treatment with different probabilities. Therefore, we use inverse probability weighting when estimating the ITT.Footnote 71
Equation 2 provides a preliminary estimate of the causal effect of observers but does not account for potential spillover effects. To account for spillover, we estimate the ITT conditional on the level of observer saturation. We refer to these quantities as ITT (s). The challenge in estimating ITT (s) is that we cannot simply compare outcomes at treated and control stations within the same saturation condition. In the presence of spillover, these estimates will be biased. Our solution, following Baird et al.,Footnote 72 is to compare outcomes at treated stations in each saturation level to control stations in constituencies assigned to the low saturation condition. We do this because the low saturation controls are the units least likely to be subjected to the impact of spillover effects.
Using control stations in low saturation constituencies to approximate ‘pure’ control units – that is, units that are not exposed to spillover – is justified given the basic model of spillover that we expect is operating within constituencies. In this model, each observer will on average produce a similar spillover effect (if indeed there are spillover effects). The need for parties to shift fraud or violence to control stations results from their desire to reach a target level of manipulation in a constituency.Footnote 73 Because election observers reduce parties’ opportunity to engage in malfeasance at treated stations, parties will need to engage in more shifting as the saturation of observers increases in order to reach their target levels. As a result, control units will be more likely to be affected by spillover in constituencies with greater concentrations of observers.Footnote 74
We thus estimate ITT(s) as follows:
 $$ITT\left( s \right){\,\equals\,}E(Y_{{i\,j}} \mid T_{{i\,j}} {\,\equals\,}{\rm 1},S_{j} {\,\equals\,}s){\minus}E(Y_{{i\,j}} \mid T_{{i\,j}} {\,\equals\,}0,S_{j} {\,\equals\,}low)$$.
We use inverse probability weighting to account for differences in treatment assignment probabilities across constituencies. The ITT(s) estimates are our main quantities of interest. They provide estimates of the direct effect of observers at different observer saturation levels.
To test our hypotheses on potential displacement of fraud and violence from treated to control polling stations within constituencies, we estimate the average spillover effect on the non-treated stations, conditional on constituency-level saturation (ASNT(s)). Again, we use outcomes from control stations in low saturation constituencies as the baseline level of malfeasance that would occur had no observers been deployed within a constituency. To estimate average spillover effects, we compare outcomes in control stations at medium and high saturation levels to outcomes in control stations at low saturation. Formally, we estimate average spillover effects as follows:
 $$ASNT\left( s \right){\,\equals\,}E(Y_{{i\, j}} \mid T_{{i\,j}} {\,\equals\,}0,S_{j} {\,\equals\,}s){\minus}E(Y_{{ij}} \mid T_{{i\,j}} {\,\equals\,}0,S_{j} {\,\equals\,}low)$$.
If ASNT(s) >0, and electoral malfeasance increases in control stations as observer saturation increases, this is evidence of a displacement effect. If ASNT(s) <0, violence and fraud decrease in control stations as observer saturation increases, which is evidence of a deterrence effect. If ASNT(s)=0, there is no evidence of spillover effects. To test Hypotheses 3 and 4, we also estimate the ASNT(s) in competitive and non-competitive constituencies.
MEASURING FRAUD AND VIOLENCE
Our first indicator of fraud is polling station turnout.Footnote 75 If turnout correlates with the placement of observers, this is evidence of fraud because it shows that turnout is artificially high at stations without observers. To construct this measure, we obtain data on the number of votes cast in each of our sample polling places using information from the official polling station results forms. Turnout is calculated as the total number of valid and rejected ballots divided by the number of persons registered to vote at the polling station. Since in Ghana voters are legally allowed to vote only at the polling station where they are registered, high levels of turnout at polling stations without observers suggests that multiple voting occurred, or that vote counts were artificially inflated.Footnote 76
We also analyze two alternative indicators of potential fraud, coding polling stations as fraudulent when the turnout rate at a station appears to be an outlier in the constituency. We measure outliers in two ways. First, we code a station as being an outlier when turnout is more than two standard deviations above the constituency mean. Second, we code a station as being an outlier when recorded turnout is greater than the sum of the upper quartile of its constituency turnout plus one-and-half times the interquartile range (a standard approach to defining outliers in distributions).Footnote 77
To measure election violence, we code whether a polling station experienced intimidation during voting. This outcome is one indicator from a survey that we conducted at each station in the sample. At treated stations, the information we use was reported by CODEO observers as part of their official duties. At control stations, our enumerators completed the same instrument that CODEO observers used to report activities at their assigned polling stations. To complete the survey, enumerators interviewed party agents and polling station officials.Footnote 78 To avoid ‘observing’ control stations, we could not send enumerators to control stations during the election process. We provided identical training to enumerators as that received by CODEO observers. The question wording is as follows: ‘Did anyone attempt to harass or intimidate voters or polling officials during voting?’ Possible responses to this question were Yes or No.
As we note, data for our violence indicator was collected using reports from two different sets of actors – election observers (treated stations) and party agents (control stations). The correlation between our treatment and data collection method is a potential concern as it could be a difference in the data collection procedure, rather than the impact of treatment, that drives differences we observe between treatment and control groups. There are at least two reasons why this should not be a major concern. First, if there is bias generated by the differences in data collection procedures, it is likely to be biased against the study hypotheses. For example, there is no reason to believe that election observers will be less likely to report intimidation at polling stations than party agents. During training, observers are instructed to report what they see and it is emphasized that observers are not responsible for what occurs at their polling stations. By contrast, if party monitors are involved in the organization of voter intimidation, they would be more likely to under-report such instances. This would provide a bias against a finding that observers reduce voter intimidation. It may, however, also be the case that some party agents over-report violence in an attempt to paint their competitors in a negative light. To guard against this concern, we only code a station as experiencing intimidation when both respondents, typically party agents from both of Ghana’s two major parties, agree that there was intimidation. We find it unlikely that the party agents of both major parties would collude and report violence when none took place.
Second, and importantly, the variation in data collection method is not a relevant concern for our spillover estimates. As we discussed in the previous section, the ASNT estimates are derived from comparisons of outcomes at control stations in each of the three saturation levels. As data from control stations were collected in exactly the same way, we can rule out the data collection procedure from driving the spillover results. Thus, for the analyses that are of most theoretical interest, concerns about the data collection procedure are not relevant.
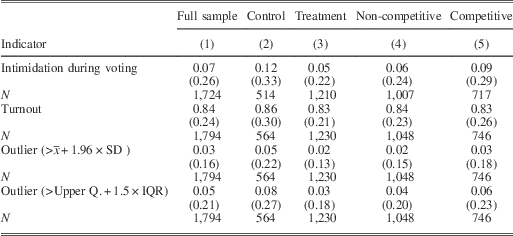
Table 1 presents descriptive statistics, displaying means with standard deviations in parentheses. Column 1 shows the summary statistics in our full sample. About 7 percent of stations experienced intimidation during voting. The average turnout rate was 84 percent. About 3 percent of stations have suspiciously high turnout using our first method of measuring outliers, while we code about 5 percent of stations as outliers using the second method. The second and third columns compare control to treatment polling stations. Intimidation occurred in 12 percent of control stations and 5 percent of treated stations, suggesting that observers helped deter violence. Whereas the average turnout rate in treated stations was about 83 percent, it was 86 percent in control stations. Polling stations are also more likely to have suspiciously high turnout rates in the control group: 5 percent in control versus 2 percent in treatment using the first method, and 8 percent in control versus 3 percent in treatment using the second method. Observers thus appear to have reduced fraud where they had been present.
Descriptive Statistics of Manipulation Indicators

Note: Table 1 shows the descriptive statistics of our dependent variables. The unit of analysis is the polling station. We report the mean in our full sample, treated and control stations, and for stations located in competitive and non-competitive constituencies. Standard deviations are reported in parentheses.
Columns 4 and 5 display means in competitive and non-competitive constituencies. Levels of intimidation are about 3 percent higher in competitive constituencies (9 percent) compared to non-competitive constituencies (6 percent), which is consistent with our argument that there are relatively fewer incentives to engage in electoral violence in single-party dominant areas. Turnout is slightly higher in non-competitive constituencies, which is probably because of greater numbers of partisans who are committed to turnout in party strongholds. Polling stations in competitive areas are also slightly more likely to be coded as outliers using both methods.
RESULTS
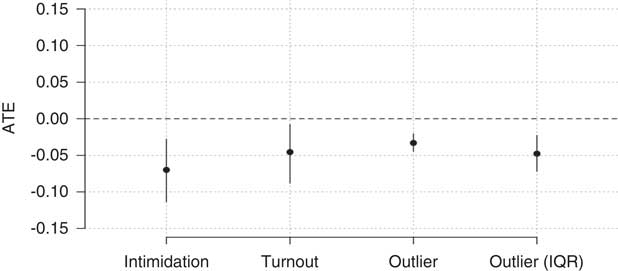
We begin by estimating the intention-to-treat (ITT) effects for our outcomes in the full sample (using Equation. 2). Figure 1 displays the ITT estimates as well as 95 percent confidence intervals. Consistent with Hypotheses 1 and 2, we find that observers reduce election fraud and intimidation at polling stations where they are deployed. Treatment reduces the probability of voter intimidation during the voting process by 7 percentage points (95 percent confidence interval from −11 to −2.7). The voter turnout rate in treated stations is 4.5 percentage points lower than it is in control (95 percent confidence interval from −8 to −0.1). In interpreting this result, we emphasize that voter turnout in itself is not undesirable. However, if turnout is significantly different when a randomly assigned observer is present, this is indicative of potential fraud at control stations. Treatment also reduces the probability that a station has a suspiciously high turnout rate, as measured by our outlier measures. The treatment effect using the first method is 3.3 percentage points (95 percent confidence interval from −4.4 to −2), while it is about 4.7 percentage points using the second method (95 percent confidence interval from −7.2 to −2.2).
Direct effect of observers in full sample Notes: Fig. 1 shows intention-to-treat (ITT) effects of observers. Our unit of analysis is the polling station. In estimating all quantities of interest, we use inverse probability weighting. We use randomization inference to calculate the 95 percent confidence bounds around these estimates. Specifically, we assume that the estimated effect is same for all units and use that to generate hypothetical potential outcomes for each unit (Gerber and Green Reference Gerber and Green2012). When simulating possible random allocation of treatment, we cluster on constituency.

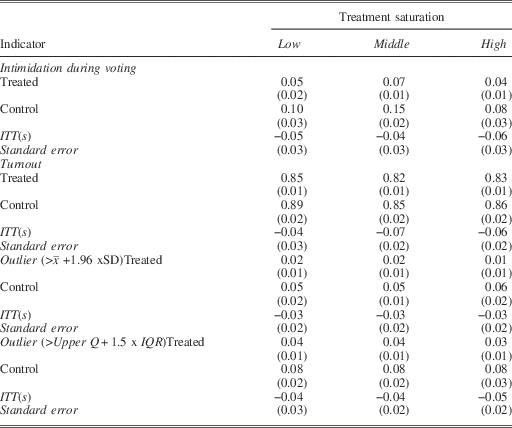
To account for potential biases resulting from observer spillover effects, we estimate our results in keeping with our experimental design. Table 2 presents the means in each cell of our 3 x 2 design. In each constituency-level saturation condition, indicators of fraud and intimidation rates are higher in stations without observers (control) than stations with observers (treated). For example, turnout is between 85 and 89 percent in control polling stations in each saturation condition, while it is between 82 and 85 percent in treated polling stations. The percentage of stations that experience intimidation is between 8 and 18 percent in control stations, and between 4 and 7 percent in treated stations, across each level of observer saturation.
Observers’ Effect on Election Day Manipulation

Note: Table 2 reports mean estimates for our dependent variables in each of our six treatment conditions. In estimating means, each unit is weighted by the inverse of its treatment probability. Standard errors are reported in parentheses.
Table 2 also presents the spillover-corrected ITT estimates, ITT (s), which show that, when accounting for spillover, observers reduce fraud and violence in polling stations where they are deployed. Our estimates show that observers reduce the likelihood of intimidation of voters during voting. The ITT(s) is 5 percentage points in the low condition, 4 percentage points in medium condition, and 6 percentage points in high saturation condition. The treatment effects in the low, medium and high treatment conditions are all statistically significant at the 5 percent level. The ITT(s) for turnout is 4 percentage points in the low condition, 7 percentage points in the medium condition, and 6 percentage points in the high condition.Footnote 79 While the effect of observers is not statistically significant in the low saturation condition, effects are significant in the medium and high saturation conditions. We uncover similar results when we analyze the outlier measures. These results provide further evidence in support of Hypotheses 1 and 2. Table 2 also shows the spillover-corrected ITT at each level of observer saturation with their standard errors reported in parentheses. We also report the p-values from a two-sided t-test of these estimates.
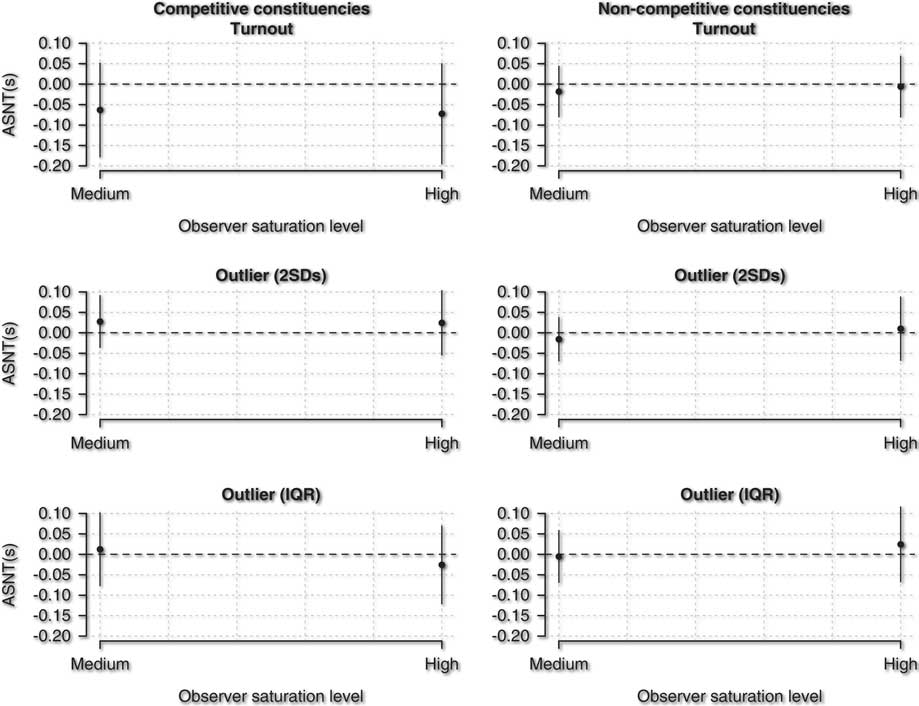
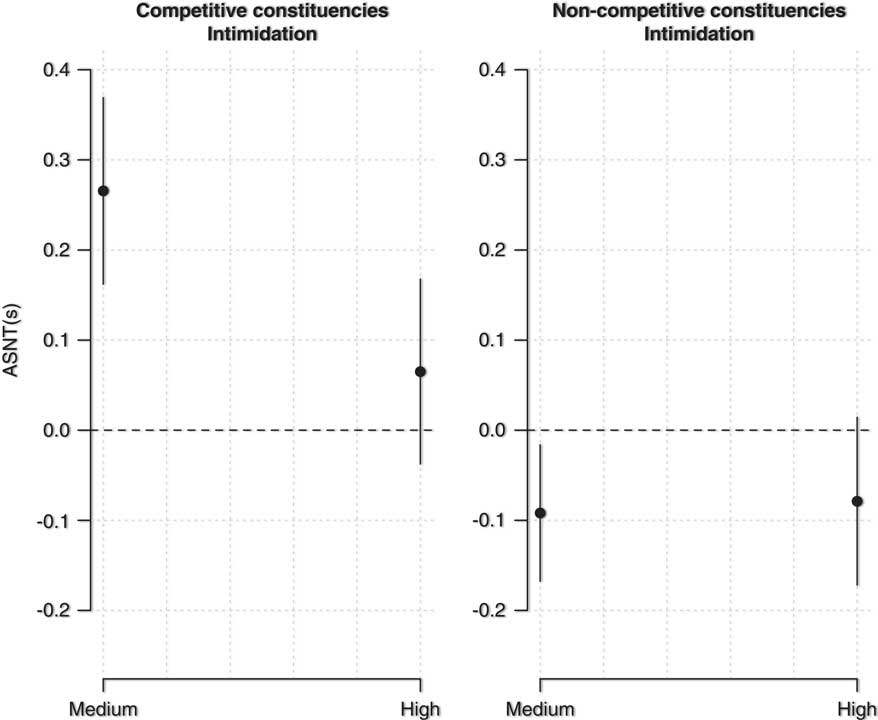
To test Hypotheses 3 and 4, we present spillover effects in electorally competitive and single-party dominant constituencies. Figures 2 and 3 present the results. The points in the plots are calculated by estimating Equation 4 separately in competitive and non-competitive constituencies. We present the numerical results in Online Appendix C.
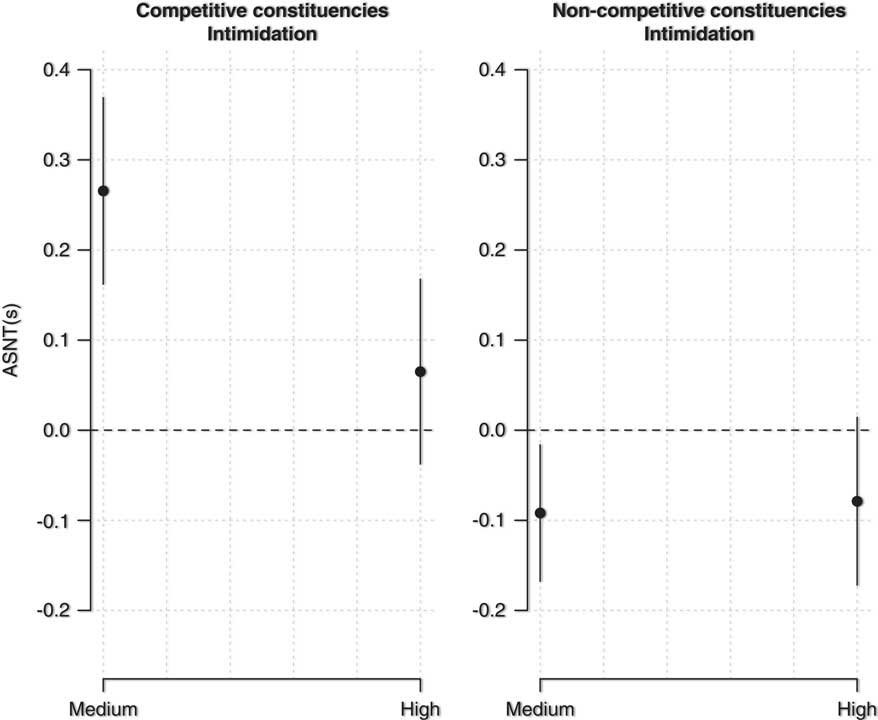
Average spillover effect on non-treated stations: intimidation Notes: Figure shows the average spillover on the non-treated (ASNT (s)) of observers on turnout and intimidation during voting in competitive and non-competitive constituencies. Our unit of analysis is the polling station. In estimating the ASNT (s), we use inverse probability weighting. We use randomization inference to calculate the 95 percent confidence bounds around these estimates. Specifically, we assume that the estimated effect is same for all units and use that to generate hypothetical potential outcomes for each unit (see Gerber and Green Reference Gerber and Green2012). When simulating possible random allocation of treatment, we cluster on constituency.
Average spillover effect on non-treated stations: fraud Notes: Figure shows the average spillover on the non-treated (ASNT(s)) of observers on turnout and intimidation during voting in competitive and non-competitive constituencies. Our unit of analysis is the polling station. In estimating the ASNT(s), we use inverse probability weighting. We use randomization inference to calculate the 95 percent confidence bounds around these estimates. Specifically, we assume that the estimated effect is same for all units and use that to generate hypothetical potential outcomes for each unit (see Gerber and Green Reference Gerber and Green2012). When simulating possible random allocation of treatment, we cluster on constituency.

Figure 2 presents our findings on election-day intimidation. Consistent with Hypothesis 4, we find evidence of displacement in competitive constituencies (depicted in the left plot). In competitive constituencies, voter intimidation is 24.3 percentage points more likely in control stations in the medium saturation relative to control stations in low saturation constituencies. In the high saturation areas, voter intimidation is 9.8 percentage points more likely to occur. Both of these estimates are statistically significant at the 5 percent level. In non-competitive constituencies (shown in the right plot), the pattern is reversed. The incidence of voter intimidation is reduced by 11 percent and 12.3 percent in control stations in medium and high saturation conditions respectively, relative to control stations in low saturation condition. Both estimates are statistically significant.Footnote 80 These results suggest that observers displace violence and intimidation in competitive constituencies, but deter them in single-party dominant areas.
Figure 3 presents results for the indicators of fraud. In non-competitive areas, the ASNTs in the medium condition are all very close to 0. Examining the outlier measures, the ASNTs in the high saturation condition are positive, which is consistent with Hypothesis 3. For example, controls in the high saturation condition are 2.4 percentage points more likely to have suspiciously high turnout than controls in low saturation when we analyze the second method coding outliers. These results are, however, statistically weak and further research is required to corroborate Hypothesis 3.
The pattern in competitive constituencies is different. For example, in control stations, turnout is reduced by about 6 percentage points in the medium and 7 percentage points in the high saturation compared to the low saturation condition. While these estimates are not statistically significant at conventional levels, the point estimates suggest that observers may deter fraud in control stations when deployed in large numbers to non-competitive constituencies. Taken together, these patterns are consistent with the argument that the local context conditions how political parties respond to the presence of election observers.
Finally, we conduct a constituency level analysis in which we examine the impact of increasing the saturation of observers on overall levels of fraud and violence in a constituency. These results are presented in Online Appendix F. In the full sample, increasing the share of polling stations with observers leads to statistically significant decreases in overall levels of fraud and violence. In electorally competitive constituencies, increasing the saturation of observers decreases overall levels of fraud but has no impact on levels of violence and intimidation. In non-competitive areas, increasing the saturation of observers has relatively little impact on overall levels of fraud, but a substantially negative effect on levels of violence and intimidation. These results are consistent with the patterns of spillover documented above, and demonstrate how the local electoral context conditions the overall impact of observers.
DISCUSSION
We present evidence of electoral fraud and violence and intimidation during Ghana’s 2012 election. Our findings show that the presence of a domestic election observer at a polling station significantly reduces both these forms of electoral malfeasance. Our results also show that political parties are not passive to the deployment of observers. Consistent with our framework, we find evidence that how parties respond to election observers is not uniform across constituencies. We find strong evidence that parties respond to observers by displacing violence to control stations in competitive constituencies. In contrast, in single-party dominant constituencies, parties choose to shift fraud to control stations, although the strength of the evidence is weaker than the evidence on intimidation. To account for these differences, we emphasize that opportunities to commit fraud and incentives to engage in election violence vary across electoral environments.
While our findings are consistent with our framework, they also show that when observers are deployed at higher rates in non-competitive constituencies, they deter party activists from engaging in violence at control stations. Further research is required to understand the mechanism driving this result. It may be that a high concentration of election observers increases the perceived costs of intimidation to parties in their stronghold areas. Because observers are likely to publicize instances of violence, parties risk alienating their core support groups if they are caught engaging in the strategy, especially in their stronghold areas.
Since electoral competition is not randomly assigned to constituencies, it may be that other constituency characteristics, which correlate with competition, are driving these differential patterns of spillover. Although we cannot completely rule out this possibility, the data we have do not suggest any major differences across competitive and non-competitive constituencies. Online Appendix D presents data on indicators of economic development and public infrastructure in competitive and non-competitive constituencies. Both types of constituencies have comparable road networks, rates of electrification, and shares of individuals living in poverty. Finally, the number of polling stations per square kilometer, which is an approximate measure of the average distance between stations, is comparable in competitive and non-competitive areas. In short, infrastructure, urbanization, and development do not differ across competitive and non-competitive constituencies. These differences are, therefore, unlikely to explain the patterns of differential spillover that we find.
CONCLUSION
Our results corroborate previous research that finds that election observers reduce electoral fraud. We extend this literature by investigating the effects of domestic observers on electoral fraud and election-related violence in one study. In addition, we explicitly account for potential spillover effects in our estimation of the causal impact of observers and analyze how spillover effects vary across different political contexts and across strategies of malfeasance. The analysis of spillover effects advances understanding of how local electoral context shapes the strategies that political parties adopt to manipulate electoral outcomes. More specifically, our results show that electoral competitiveness is not sufficient to explain when parties in a democratic context will seek to engage in fraud. Our findings suggest that opportunities are also important. In addition, our results suggest that election-day violence is likely to occur where electoral competition is intense and where parties lack opportunities to engage in fraud, either because civil society blocked opportunities for fraud or because parties lack the organizational capacity and penetration of local political and social networks that is often required to engage in fraud.
Our study examines a single election in one country. The advantage of this approach is that it allows us to generate well-identified estimates of observers’ direct and spillover effects. This micro-level analysis is a crucial complement to macro-level investigations, which are often limited in their ability to identify causal effects. A relative limitation of our approach is external validity. In many ways, however, Ghana is a typical case and so we expect our findings to generalize to other similar democracies in Africa and beyond. Like many countries in Africa and elsewhere, Ghana is a young democracy, not yet fully consolidated and with a history of elections that have been marred by allegations of fraud and instances of voter intimidation. Ghana is also characterized by many of the political and institutional factors that the literature suggests create incentives for fraud and violence. For example, partisan electoral competition is intenseFootnote 81 and the country has a majoritarian, single-member-district electoral system.Footnote 82 As in many countries in Africa, institutions of horizontal accountability, such as parliament, are relatively weak, and political power is concentrated in the office of the executive president. As a result, presidential elections are high-stakes contests and the perceived benefits of victory may incentivize electoral manipulation. If observers reduce malfeasance in this environment, where incentives for fraud and intimidation are strong, we would expect them to have similar or even stronger effects where incentives to commit fraud or engage in violence are weaker.
Ghana is also distinct in other ways that may limit the generalizability of our findings. First, CODEO is a professional and neutral organization, and is perceived as such domestically. Observer groups in other countries may have less capacity and may themselves be subject to political cooptation, which would attenuate the effects of observers. Second, Ghana has a vibrant press and a vigilant civil society committed to the promotion of democracy. Media and civil society groups are likely to amplify the impact of observers by reporting and publicizing observer reports. Observers’ effects may be weaker where these societal forces are less robust.
Our results suggest a number of directions for future research. First, while we document that observers reduce fraud and violence, we do not pin down the precise mechanism by which observers bring about this effect. Research designs that better identify the mechanisms that drive observer effectiveness will be useful. Investigating more closely how party brokers commit and coordinate manipulative strategies and how electoral officials are hired and coopted may also be fruitful avenues of future research. An investigation of the types of legal, organizational, and psychological interventions that could improve the professionalization of poll workers would advance our understanding of how fraud works and how bureaucratic reform might limit it.
Finally, this article makes several contributions. First, we provide empirical evidence that domestic election observers in a low-income democracy are capable of limiting multiple forms of electoral malfeasance. These findings highlight the important role of local civil society in advancing democratic consolidation. Second, we investigate how spillover effects vary across political contexts and forms of electoral malfeasance in order to learn about how the local political environment influences patterns of electoral fraud and election-related violence. These findings advance our understanding of how political parties select from the diverse ‘menu of manipulation’Footnote 83 in different political environments on election day. Finally, this article has methodological implications. We provide an applied example of the randomized saturation experimental design,Footnote 84 which may prove useful in other applications where spillover effects are likely.