1. Introduction
During downturns in economic activity, banks cut back lending both by increasing interest rates and by tightening other non-price terms such as credit scores, collateral requirements or borrowing limits (see Figure 1). The use of these non-price lending standards to vary the availability of business loans is a natural result of information asymmetries; were there no asymmetries, banks could price the risk and vary lending rates accordingly, as in any frictionless market (see Lown and Morgan (Reference Lown and Morgan2006)).
Net percentage of domestic banks tightening non-rate standards for commercial and industrial loans to small firms. Source: Board of Governors of the Federal Reserve System (BGFRS), Senior Loan Officer Opinion Survey on Bank Lending Practices.

This paper studies the dynamics of lending standards in a macroeconomic model with an informational asymmetry between small businesses and lenders relating to the riskiness of borrowers. By using the loan approval probability as a screening device, banks ration credit in the face of heightened risk. We show that the credit friction maps to endogenous movements in both total factor productivity (TFP) and the marginal efficiency of investment, measured as the spread between the savings rate and the return on capital. This is an appealing feature because economic downturns also typically coincide with falls in TFP; prominent recent examples are the large declines in TFP across many advanced economies following the 2007–08 financial crisis. Footnote 1 In the model, adverse selection in small business lending results in occasional credit crunches when lending risk is high. We find that these episodes are observationally equivalent to TFP shocks through the lens of a standard dynamic stochastic general equilibrium (DSGE) model, helping shed light on recent crisis episodes and giving insight into the factors that might contribute to future downturns.
The proposed model is motivated by the events of the financial crisis during which informational frictions played a critical role. In the consensus view of the crisis, there was a major role played by the collapse of the asset-backed securities market driven by adverse selection, Footnote 2 and while the credit crunch that followed was partly because of banks cutting lending due to liquidity constraints in the banking sector (see, e.g. Shin (Reference Shin2009)), hidden information about borrower quality played a critical role in closing credit markets to small businesses. Footnote 3
To focus attention on small/medium-sized businesses (SMBs), we assume that only half of the firms in the model are subject to the information problem. Footnote 4 These small firms can either be highly productive and risky or less productive and safe, but their type is private information. Whereas a decentralized bond market can function well for the firms without hidden information, intermediaries can perform better by screening the small firms. We characterize the firms as small in part by assuming their projects are indivisible; while large firms might choose investment across a range of projects, a small business may seek credit to open a single store or build a new factory. Defining projects as indivisible blocks is a caricature but captures salient features of smaller businesses, in particular, being unable to diversify risk.
Although banks tighten lending standards using a variety of measures, recent survey evidence indicates that borrowers are more often unsuccessful in loan applications due to a lack of credit history and perceived tighter restrictions than due to the amount of credit requested or having insufficient collateral. Footnote 5 In our model, intermediaries can separate borrowers by offering a lottery for funding, charging risky borrowers higher interest rates by promising a higher chance of being approved for a loan. Footnote 6
This paper contributes to a body of research studying the macroeconomic effects of adverse selection in investment. For example, the Stiglitz and Weiss (Reference Stiglitz and Weiss1981) model of credit rationing, which forms our starting point, has been extended in several studies, including Bester (Reference Bester1985), Mankiw (Reference Mankiw1986), Williamson (Reference Williamson1986), De Meza and Webb (Reference De Meza and Webb1987), Besanko and Thakor (Reference Besanko and Thakor1987), and House (Reference House2006). These papers draw focus on stationary equilibria, whereas we are analyzing dynamic simulation and the mapping to business cycles.
We are perhaps more closely related to recent papers studying the dynamic effects of adverse selection, such as Eisfeldt (Reference Eisfeldt2004), Kurlat (Reference Kurlat2013), Benhabib et al. (Reference Benhabib, Dong and Wang2018), and Bigio (2015), all of which focus on the implications of adverse selection under pooling equilibria. These papers speak effectively to the distorting role of adverse selection on market liquidity, such as was observed in the asset-backed securities market during the financial crisis, but less so to a lending market in which intermediaries can separate borrowers. The distinction seems important as policies and other factors that might increase liquidity in asset markets may be powerless against adverse selection in small business lending. The focus of Benhabib et al. (Reference Benhabib, Dong and Wang2018) is the presence of multiple equilibria in models of adverse selection; while we find multiple equilibria can occur in our model, our calibrations imply a steady state that is unique and locally stable.
Other related research includes Figueroa and Leukhina (Reference Figueroa and Leukhina2018) and Cui and Kaas (Reference Cui and Kaas2020) who both study financial frictions that drive movements in productivity. In Figueroa and Leukhina (Reference Figueroa and Leukhina2018), adverse selection causes compositional effects as “bad” types are less productive entrepreneurs, unlike our model, in which borrowers always have projects with equal expected value but different degrees of risk. The results of our model are closer to those of Cui and Kaas (Reference Cui and Kaas2020); the friction is limited commitment as oppose to asymmetric information, however heightened risk similarly leads to reduced lending and lower aggregate productivity. Footnote 7
The primary focus of the recent literature linking financial factors to productivity is the interaction between heterogeneity in productivity and some form of credit friction, such as collateral constraints (Jeong and Townsend (Reference Jeong and Townsend2007); Buera and Shin (Reference Buera and Shin2013); Moll (Reference Moll2014)), causing misallocation on the intensive margin whereby capital is not allocated to most productive firms (see also Pratap and Urrutia (Reference Pratap and Urrutia2012); Oberfield (2013); Caggese and CuÑat (Reference Caggese and CuÑat2013); Gilchrist et al. (Reference Gilchrist, Sim and ZakrajŠek2013)). Footnote 8 In contrast, falls in productivity in this paper are largely driven by misallocation on the extensive margin as banks store physical capital. We think of this as equivalent to an increase in cash hoarding that reduces overall lending. Footnote 9 The empirical evidence indicates that this margin is important; for example, using UK bank data, Franklin et al. (Reference Franklin, Rostom and Thwaites2020) find that an aggregate credit supply shock of 10% leads to a fall in labor productivity of 5–8%.
The model is described in detail in the next section before we outline some key analytical results in Section 3. In Section 4, we discuss some numerical results and the implications of the credit friction on financial instability and the macroeconomy. Finally, we summarize with some concluding remarks in Section 5.
2. Model
The model extends a standard real business cycle model by differentiating between three types of firm and assuming that each firm requires a fixed quantity of external finance to purchase k units of capital. This assumption ensures that firms are reliant on outside funding. Because all firms require the same capital, the friction cannot be side-stepped by only funding a single, very large corporate firm. Every period, each firm draws a project characterized by a production technology, productivity level and a risk profile. In particular, the risk profile specifies the probability the project will fail, allowing no production. There are two types of project: one is more productive but risky and the other is less productive but safe. A proportion
 $\eta$
of firms have a perfectly observed project and so are suitable for raising funds via a bond market. The remaining
 $1-\eta$
firms have a privately observed project. Whereas a proportion
 $\lambda$
of these firms have no risk of default, the remaining
 $1-\lambda$
have a risky project that will only succeed with probability
 $p_t$
. Throughout the paper, the former will be referred to as safe and the latter risky, and the firms with an observable project as corporates. Under a decentralized bond market, because all borrowers seek the same amount of finance, the only screening device to separate the risky and safe project holding firms is the interest rate. In such an environment, either all firms will access funds at the same rate, or the firms with a safe project will be rationed when the interest rate is set higher than their expected return, which might occur if default losses from risky loans are too high. We will show that the presence of noncorporates gives rise to a financial intermediation sector that can do better than a bond market by screening borrowers. That is, there exists a menu of contracts that firms can self-select into, allowing lenders (banks henceforth) to identify their risk profile. We begin description of the model with the banking sector.
2.1 Intermediaries
The banks take deposits from households and extend loans to the firm sector. We assume the latter follows a two-stage game whereby lenders post-contract offers that borrowers can choose to accept.
Footnote 10
This takes place in an anonymous spot market that leads to a sequence of static contracts,
Footnote 11
agreed at the end of period t, ahead of period
 $ t+1 $
production. In addition to the interest rate, the lender introduces a lottery
Footnote 12
that allows the lender to set the probability of loan approval. As shown below, this will be the device that allows the lender to separate borrowers by designing incentive-compatible, or self-selecting, contracts. Specifically, the lenders post-contracts
 $c_t^i =\{ \tau^i_t,x_t^i \}$
for
 $i\in\{s,r\}$
, where
 $\tau_t^i$
is the repayment rate, and
 $x_t^i$
the financing, or approval probability. We assume that the banks have access to a low-return technology, yielding return
 $r^*$
and implying that they need not lend all available funds.
Footnote 13
Letting
 $ p_{t}^i $
and
 $ R_{t}^i $
denote the success probability and gross rate of return on capital of a type- i project respectively, and
 $ \Lambda_{t,t+1} $
the stochastic discount factor, the lender must set contract terms subject to individual rationality (IR) constraints
 \begin{align}\mathbb{E}_t \left[ \Lambda_{t,t+1} p_{t+1}^i \left( R_{t+1}^i - \tau_t^i \right) \right] \ge 0 , \quad i = r,s,\end{align}
which promise a weakly positive surplus to the firm, and subject to incentive compatibility (IC) constraints given by
 \begin{align}\mathbb{E}_t \left[ \Lambda_{t,t+1} p_{t+1}^i x_t^i \left( R_{t+1}^i - \tau_t^i \right) \right] \ge \mathbb{E}_t \left[ \Lambda_{t,t+1} p_{t+1}^i x_t^j \left( R_{t+1}^i - \tau_t^i \right) \right] , \quad i,j = r,s; i\ne j.\end{align}
That is, the value to each borrower of declaring their type truthfully must be weakly greater than lying. As is standard in these mechanism design problems, and straightforward to prove, the problem can be simplified by dropping two constraints. The relevant constraints are the safe IR and the risky IC constraints, which further are found will be always binding as the objective function is increasing in the repayment rates. We can write these constraints as follows: Footnote 14
 \begin{gather}\mathbb{E}_t \left[ \Lambda_{t,t+1} \right] \tau_t^s = \mathbb{E}_t \left[ \Lambda_{t,t+1} R_{t+1}^s \right], \end{gather}
 \begin{gather}\mathbb{E}_t \left[ \Lambda_{t,t+1} p_{t+1}^r \right] \tau_t^r = \mathbb{E}_t \left[ \Lambda_{t,t+1} p_{t+1}^r R_{t+1}^r \right] - \mathbb{E}_t \left[ \Lambda_{t,t+1} p_{t+1}^r \left( R_{t+1}^r - \tau_t^s\right) \right] \frac{x_t^s}{ x_t^r} . \end{gather}
It further follows from these constraints that
 $x_t^r \ge x_t^s$
(see Appendix E), so risky-project firms are always weakly more likely to be funded than those with safe projects. The intuition is that in order to pay higher repayment rates, the banks must offer a higher probability of being approved for finance. The banks solve
 \begin{align}\mathcal{V} \left( c^s_{t-1},c^r_{t-1} \right) = \max_{c^s_t,c^r_t} & \left\lbrace \lambda x^s_{t-1} \left( \tau_{t-1}^{s} - r^*\right) + \left(1-\lambda \right) x^r_{t-1} \left( p_{t}^r \tau^r_{t-1} - r^* \right) + \mathbb{E}_t \left[ \Lambda_{t,t+1} \mathcal{V}_{t+1} \left(c^s_t,c^r_t\right)\right] \right\rbrace\notag\\\mbox{s.t.} & \quad 0 \le x^s_t \le x^r_t \le 1 \notag \\& \quad \lambda x^s_t + \left(1-\lambda\right)x^r_t \leq \bar{x}_t, \end{align}
and subject to constraints (3) and (4). The inequality constraint (5) is a feasibility constraint where
 $\bar{x}_t \le 1$
is the maximum proportion of firm applications that can be approved. This is determined in general equilibrium and will be less than one if the number of possible loans the bank can make is less than the number of firms seeking funds, in which case it is the ratio of the loan supply to the loan demand. When this ratio is greater than unity,
 $\bar{x}_t$
is bound at one. When constraint (5) is slack, rather than lending all available funds, banks invest a portion of their capital in a low-return asset or technology. Equations (3) and (4) allow
 $ \tau_t^r $
and
 $ \tau_t^s $
to be substituted out of the problem, leaving only
 $ x_t^r $
and
 $ x_t^s $
to be chosen. For these, the solution to the bank’s problem gives
 \begin{align}& \mathbb{E}_t \left[ \Lambda_{t,t+1} \left(p_{t+1}^r R_{t+1}^r - r^* \right) \right] = \varrho_t - \psi_t \frac{1}{1-\lambda} + \varphi_t^r \frac{1}{1-\lambda}, \end{align}
 \begin{align}& \mathbb{E}_t \left[ \Lambda_{t,t+1} \left( \left(\lambda + \left(1-\lambda \right)p_{t+1}^r \right) R_{t+1}^{s} - r^* \right) \right] = \varrho_t + \varphi_t^r - \varphi_t^s ,\end{align}
where
 $\varrho_t$
is the Lagrange multiplier on the feasibility constraint,
 $\varphi^s_t$
and
 $\varphi^r_t$
those on
 $x^s_t$
and
 $1-x^r_t$
, respectively, and
 $\psi_t$
is the Lagrange multiplier on
 $x^r_t-x^s_t$
. These first-order conditions are also subject to Kuhn–Tucker conditions that include zero lower bounds on the four Lagrange multipliers:
Footnote 15
 \begin{align} {\varphi}^s_t , {\varphi}^r_t, \varrho_t, \psi_t \ge 0 . \end{align}
Due to these four inequality constraints, it is possible to identify four regimes that depend on parametrization and macroeconomic conditions, including pooling and separating equilibria, and the credit rationing of safe projects. A financial crisis, or credit crunch, will be characterized by banks storing a portion of available capital rather than using it to fund productive firms. Analysis of these regimes is given in Section 3 below. We turn now to the firm sector.
2.2 Firms
When firms draw their type at the end of the period, they apply for external finance for which they may or may not be successful; if firms are successful in securing funds, they purchase k units of capital ready for production in the following period, otherwise we assume they must exit. Of the funded risky projects, a proportion
 $1-p_t^r$
will fail before production begins. Success probability
 $p_t^r \in [0,1]$
follows the AR(1) process:
 \begin{align}p_t^r =\left(1-\rho_p\right) \bar{p}^r + \rho_p p_{t-1}^r + \varepsilon_{p,t} .\end{align}
If the firm fails, then the capital is lost completely. Let firm type be denoted
 $i \in \{c,s,r\}$
for corporates, safe-, and risky-project holding firms, respectively. A successful funded project requires k units of capital that is converted into
 $ \omega^i_t k $
productive units, where we assume
 $\omega_t^r > \omega_t^c = \omega_t^s = 1$
. The firm hires
 $h_t\left(\omega_t^i\right)$
units of labor and produces output using
 \begin{align}y_t \left(\omega_t^i\right) = z_t \left[\omega_t^i k \right]^\alpha \left[ h_t\left(\omega_t^i\right)\right]^{1-\alpha},\end{align}
where aggregate technology
 $z_t$
follows the stationary stochastic process:
 \begin{align}\log\left(z_t\right) = \rho_z \log\left(z_{t-1}\right) + \varepsilon_{z,t}.\end{align}
Capital depreciates at
 $\delta$
, so although a fixed input k is required for production, the capital remaining after production will be
 $ \omega_t^i \left(1-\delta\right)k $
. The value of a successful funded type- i firm can therefore be written as
 \begin{align}V_t^i = \max_{h_t\left(\omega_t^i\right)} \left\lbrace y_t \left(\omega_t^i\right) - W_t h_t\left(\omega_t^i\right) - \left(\tau_{t-1}^i - \left(1 - \delta\right) \omega_t^i\right) k + V_{t} \right\rbrace , \end{align}
where
 $ W_t $
is the market wage rate and
 $ V_{t} $
the ex ante value of a firm, prior to drawing its type, given by
 \begin{align}V_{t} = \mathbb{E}_t \left[ \Lambda_{t,t+1} \left(\eta V_{t+1}^c + \left(1-\eta\right) \left(\lambda x_{t}^s V_{t+1}^s + \left(1-\lambda\right)x_{t}^r p_{t+1}^r V_{t+1}^r \right) \right) \right] . \end{align}
The solution to the firm labor demand implies the real wage will equal the marginal product of labor for all firms
 \begin{align}W_t = \left( 1-\alpha \right) \frac{y_t \left(\omega_t^i\right)}{h_t\left(\omega_t^i\right)},\end{align}
where it follows that output per worker
 ${y}_t^i/h_t^i$
and the efficiency capital-labor ratio
 $\omega_t^i {k}/h_t^i$
will be equal across all firms, using superscripts for convenience. We can then write the gross return on capital used in the previous section as
 \begin{align}R_t^i \equiv \alpha \frac{y_t^i}{k} + \left(1-\delta \right) \omega_t^i , \end{align}
where the total surplus is
 $ \left(R_t^i - \tau_{t-1}^i\right) k$
and noting that the gross return on efficiency units of capital,
 $\alpha \frac{y_t \left(\omega_t^i\right)}{\omega_t^i k} + \left(1-\delta \right)$
, is equal for all firms. It follows that
 $R_t^r = \omega_t^r R_t^c = \omega_t^r R_t^s$
.
As firms can make profits in equilibrium, in the absence of costs of entry, new firms would enter until it is possible for banks to allocate all funds to firms holding risky projects, charging a higher lending rate and excluding the firms holding safe projects entirely.
Footnote 16
To prevent this, we introduce a small fixed cost of entry. Any unfunded firms will be liquidated and must repay the entry costs to operate in the period that follows. To pay the entry costs, firms sell equity to households. Under this assumption, new firms will enter until the expected discounted profits
 $V_t$
, given by equation (13), equals an exogenous fixed cost F. This condition is verified in the solution to the household problem, which we turn to now.
2.3 Households
The representative household faces the usual labor supply and consumption-savings decision, but with an additional portfolio choice problem. The household can choose to either deposit savings
 $S_t$
at a bank, purchase bonds,
 $B_t$
, or purchase equity in new firms,
 $ E_t $
, to solve
 \begin{align}\max_{\substack{C_{t+s},H_{t+s}\\S_{t+s},B_{t+s},f_{t+s}}}\mathbb{E}_t \sum_{s=0}^\infty \beta^{t+s} U{\left(C_{t+s},H_{t+s}\right)} , \notag\end{align}
subject to
 \begin{align}C_t + S_t + B_t + E_t\left(f_t,f_{t-1}\right) = R_{t-1} S_{t-1} + R_{t-1}^B B_{t-1} +W_t H_t + \Pi_t\left(f_t\right) ,\notag\end{align}
where
 $R_t$
and
 $R_t^B$
are the interest earned on savings and bonds, respectively,
 $f_t$
is the end-of-period mass of firms in the economy and
 $\Pi_t$
are profits from the household-owned banks and payoffs from equity holdings. The household consumption-savings decision and portfolio allocation is characterized by
 \begin{align}& 1 = \mathbb{E}_t \left[ \Lambda_{t,t+1} \right] R_t , \end{align}
where
 $\Lambda_{t,t+1} = \beta \frac{U'\left(C_{t+1}\right)}{U_{t}'\left(C_t\right)} $
, and with
 $R_t^B = R_t$
. Labor supply is determined by
 \begin{align}& W_t = - \frac{U'\left(H_t\right)}{U_{t}'\left(C_t\right)}. \notag\end{align}
The amount of equity purchased,
 $E_t$
, corresponds to the fixed costs paid for new entrants and is a claim on future profit streams of the new firms. The number of new entrants at t is the difference between the number of firms in t and the non-exiting firms in
 $t-1$
. It follows that expenditure on equity is given by
 \begin{align}E_t = \left( f_t - \left(\eta + \left(1-\eta\right) \left(\lambda x_{t-1}^s + \left(1-\lambda\right)x_{t-1}^r \right) \right) f_{t-1} \right) k F . \notag\end{align}
Using the return on capital given in equation (15), the total profits earned by the firms per unit k given as the sum of the information rents received by risky-project firms and profits received by corporates can be written as
 \begin{align}& \pi_t = \left(1-\eta\right) \left(1-\lambda\right) p_{t}^r x_{t-1}^s \left(R_{t}^r - R_{t}^s \right) + \eta \left(R_t^s - R_{t-1}\right).\end{align}
Using these, the choice of the number of new firms to finance gives the first-order condition
 \begin{align}F = \mathbb{E}_t \left[ \Lambda_{t,t+1} \left( \left(\eta + \left(1-\eta\right) \left(\lambda x_{t}^s + \left(1-\lambda\right)x_{t}^r \right) \right) F + \pi_{t+1} \right) \right],\end{align}
which, using equations (12) and (13), implies the entry condition
 $V_t=F$
. That is, the households will fund new firms until the present value of future profits equals the cost of entry. We can also define the ex post gross rate of return to banks as
 \begin{align}R_t^L = r^* + \left( \lambda {x}_{t-1}^s \left(\tau^s_{t-1}-r^*\right) + \left(1-\lambda\right){x}_{t-1}^r \left( p_t^r \tau^r_{t-1} - r^*\right) \right)\frac{1}{\phi_{t-1}}.\end{align}
 $ \phi_{t}\equiv \frac{S_{t}}{\left(1-\eta\right)f_{t} k} $
is the loan supply-demand ratio where
 $\left(1-\eta\right)f_{t} k$
is the capital sought by firms, and
 $S_t$
the household savings that the bank is intermediating. Free-entry in the banking sector then implies the zero arbitrage condition must hold:
 \begin{align}1 = \mathbb{E}_t \left[ \Lambda_{t,t+1} R_{t+1}^L \right]. \end{align}
Given that bank liabilities are risk-free deposits but assets are risky loans, it is possible for there to be ex post profits or losses in equilibrium. When there are profits, the household will receive a dividend, bailing out the banks when there are losses. Finally, it is assumed that the household utility function is in the form proposed in King et al. (Reference King, Plosser and Rebelo1988):
 \begin{align}U \left(C_{t},H_{t}\right) = \frac{\left(C_t^{1-\chi} \left(1-H_t\right)^\chi\right)^{1-\sigma}}{1-\sigma} \notag.\end{align}
2.4 Market Clearing and Aggregation
Labor market clearing implies that total labor demanded by the three types of firm will equal the labor supplied by households,
 $H_t$
. An equal efficiency-capital-labor ratio follows from the perfect labor market and so, defining the aggregate efficiency capital as
 \begin{align}& \hat{K}_t \equiv \left[ \eta + \left(1-\eta\right) \left( \lambda x_{t-1}^s + \left(1-\lambda\right) x_{t-1}^r p_t^r \omega_t^r \right) \right] k f_{t-1}, \end{align}
we can write the aggregate labor demand equation as
 \begin{align}W_t = \left(1-\alpha\right) z_t \left( \frac{\hat{K}_t}{H_t} \right)^{\alpha}. \notag\end{align}
We can likewise give aggregate output as
 $Y_t = z_t \hat{K}_{t}^{\alpha} H_t^{1-\alpha}$
, or rather, with aggregate productivity defined as a function of the ratio of efficiency-capital to total capital stock:
 \begin{align}A_t = z_t \left( \frac{\hat{K}_t}{K_{t-1}} \right)^{\alpha} , \end{align}
with the familiar looking aggregate production function
 \begin{align}Y_t = A_t {K}_{t-1}^{\alpha} H_t^{1-\alpha}\end{align}
that follows. Finally, we close the model with an aggregate resource constraint
 \begin{align}Y_t = C_t + I_t,\end{align}
where investment is the difference between the new capital stock,
 $K_t$
, and the sum of the depreciated returned capital and the undepreciated, unused capital
 \begin{align}I_t &= K_t - K_{t-1} + \delta \hat{K}_t - \left(1-\eta \right) \left(1-\lambda\right)x^r_{t-1} \left( p_t^r \omega^r_t - 1 \right)k f_{t-1}.\end{align}
3 Analytical Results
The menu of contracts on offer at time t, implied by the set of inequality constraints in equation (8), can be characterized as belonging to several regimes that depend on the risk and rate of return of each project. In the subsequent theoretical and numerical analysis, we consider the role of risk by fixing the risky-project productivity
 $\omega_t^r = 1/p_t^r$
so the value of each firm is equal in the first-best economy. It follows that a shock to
 $ p_t^r $
is a risk shock. We will draw attention to two key regimes of interest: a full-lending regime and a capital-misallocation regime.
Definition 1
((Full-lending regime)) Under this regime, banks intermediate all available funds so
 $ \lambda x_t^s + \left(1-\lambda\right) x_t^r = \bar{x}_t $
.
Definition 2
((Capital-misallocation regime)) Under this regime, banks do not intermediate all available funds, so
 $ \lambda x_t^s + \left(1-\lambda\right) x_t^r < \bar{x}_t $
. Instead, banks use the low-return technology for a proportion of their available funds.
As banks restrict total lending, capital-misallocation is on the extensive margin as opposed to the intensive margin, whereby funds would be inefficiently allocated across projects of differing productivities.
Footnote 17
By assuming
 $\omega_t^r = 1/p_t^r$
, we are drawing focus on the margin of interest. We can think of this misallocation as representing a credit crunch or financial crisis. In the numerical analysis discussed below, we find this to be an occasional, relatively short-lived phenomenon, much as we observe in the data.
Proposition 1 If
 $\omega_t^r = 1/p_t^r \forall t$
,
 $\bar{x}_t > 1-\lambda$
, and
 $R_t \ge r^*$
, then banks will choose
 $x_t^s \le x_t^r = 1$
.
Proposition 1 highlights that the contract outcomes simplify when only considering the role of risk.
Footnote 18
In particular, if
 $\omega_t^r = 1/p_t^r$
, a pooling equilibrium is ruled out except for when
 $\bar{x}_t=1$
.
Footnote 19
However, under our model calibrations, pooling rarely occurs in numerical simulations. To see why, suppose that household saving increases such that all firms looking for funds could receive them (that is,
 $\bar{x}_t$
increases to 1) and suppose a single non-separating contract was on offer. Given these conditions, because the lender absorbs all default losses, successful risky-project firms will earn higher profits as their repayment rate falls. This increase in the return on equity will encourage higher firm entry. As more firms enter,
 $\bar{x}_t$
falls, causing
 $x_t^s$
to fall, reducing the information rents and the value of equity. As well as keeping
 $\bar{x}_t$
from the upper abound, these competing forces prevent
 $\bar{x}_t$
from falling low. Indeed, it follows the condition
 $\bar{x}_t > 1-\lambda$
required in Proposition 1 always holds in our numerical simulations under empirically plausible parameterizations.
Footnote 20
Let us consider the two regimes of interest.
Corollary 1 There is a threshold expected default rate,
 $d_t^* = \mathbb{E}_t\left[ 1 - {p_{t+1}^*} \right]$
, that satisfies
 \begin{align} & \mathbb{E}_t \left[ \Lambda_{t,t+1} p_{t+1}^* R_{t+1}^{s}\right] = \mathbb{E}_t \left[ \Lambda_{t,t+1} \left(R_{t+1}^{s} - \frac{\lambda } {1-\lambda } \left( R_{t+1}^{s} - r^* \right) \right) \right], \notag \end{align}
whereby the economy will be in the full-lending regime when
 $\mathbb{E}_t\left[ 1 - {p_{t+1}^r} \right] \le d_t^*$
and the capital-misallocation regime when
 $\mathbb{E}_t\left[ 1 - {p_{t+1}^r} \right] > d_t^*$
.
Proposition 2 The threshold expected default rate,
 $d_t^*$
, rises in the interest rate.
The point at which the economy switches regimes occurs when the expected default rate of risky projects rises above the threshold
 $d_t^*$
. This is found by combining the first-order conditions (6) into (7) and finding the point at which
 $\varrho_t$
, the Lagrange multiplier on the feasibility constraint, equals zero. In the deterministic case, we can state, more succinctly, that if the expected default rate
 \begin{align}& d_t >\frac{\lambda } {1-\lambda } \left( 1 - \frac{r^*}{R_{t+1}^{s}} \right) , \end{align}
then banks will restrict credit to firms with safe projects. We can see that, conditional on
 $ r^* $
,
 $d_t^*$
depends positively on both the proportion of safe projects in the economy and on the return on capital. Proposition 2 follows given the link between the expected return to capital
 $\mathbb{E}_t \left[ R_{t+1}^s\right]$
and the real interest rate,
 $R_t$
. This threshold and its partial equilibrium relationship with the real rate of return is represented in Figure 2. This shows the information rents increasing in the default rate up to the point at which the lender will optimally ration credit to safe projects.
Footnote 21
This result helps rationalize evidence on whom credit tightening is concentrated. While lenders tighten credit standards during downturns, a puzzling feature of these episodes is that, conditional on observables, loan rejection rates often increase more for lower-risk small businesses than higher-risk small businesses. We present evidence in support of this in Appendix A.
Footnote 22
Partial equilibrium results: division of returns under asymmetric information under different first-best rates of return on capital.

While this might seem inconsistent with evidence that the quality of corporate borrowers rises in downturns (see, e.g. Greenwood and Hanson (Reference Greenwood and Hanson2011)), note that the phenomena is observed on bank lending to small business as oppose to the corporate bond market. In the data, increased uncertainty can drive investors to look for safer or more liquid assets during recessions (Baele et al. (Reference Baele, Bekaert, Inghelbrecht and Wei2020)). The informational friction we study prevents increased lending to safe small firms, rather the flight-to-safety in our model drives investors to corporate borrowing and to the safe storage technology. So although lending to safe small businesses falls, because of an increase in corporate borrowing, we still capture the feature that borrower quality rises in downturns.
In general equilibrium, when
 $d_t > d_t^*$
, the lender stores capital rather than provide finance to all firms with safe projects. This reduces the efficiency of the aggregate capital stock, as captured in equation (21), and so appears as a shock to aggregate productivity. In addition to this mechanism, we find that the information rents introduce a time-varying spread between the expected return to capital,
 $\mathbb{E}_t \left[ R_{t+1}^s\right]$
, and savings rate,
 $R_t$
. While changes in risk will have no effect on the spread in the first-best economy, with hidden information, the firms holding risky projects earn higher rents when risk is greater, reducing the marginal efficiency of investment. In this way, the agency problem acts to increase the volatility of movements in the spread beyond what can be accounted for with evolutions in the default risk, linking our results to literature discussing the “credit spread puzzle” (see Gilchrist and ZakrajŠek (Reference Gilchrist and ZakrajŠek2012)).
Footnote 23
We note that this produces a countercyclical spread and can magnify the propagation of other shocks to the extent they effect default rates. We refer to these effects as the financial accelerator mechanism.
3.1 Two Channels
To draw comparison with the RBC model, we can identify two channels by which financial disturbances affect real macroeconomic outcomes. The first is an “investment-wedge” channel, whereby the adverse selection affects the marginal efficiency of investment primarily through movements in the information rents. This inefficiency is measured by the spread between the savings rate and the return to capital which, using the average return on bank lending (19) and the firm lending rates (3)–(4), can be given by
 \begin{align}\Delta_t \equiv \mathbb{E}_t \left[\left(1-\lambda\right) \left( 1 - p_{t+1}^r\right) {x}_{t}^s R_{t+1}^s + \left( R_{t+1}^s - r^* \right) \left(\phi_t - \lambda x_t^s - \left(1-\lambda\right)x_t^r\right) \right] \frac{1}{\phi_t} . \end{align}
From this we can see that two factors contribute to this wedge: the information rents, measured by
 $ \left(1-\lambda\right) \left( 1 - p_{t+1}^r\right) {x}_{t}^s$
, and a capital-misallocation effect in the second term. This misallocation occurs when banks use their low-return technology, rationing credit to borrowers, as the average rate of return on lending must fall relative to the return on capital. Recall that
 $\phi_t$
is the loan supply-demand ratio, so if all household savings are intermediated to firms, it follows that the condition
 $\phi_t = \bar{x}_t = \lambda x_t^s + \left(1-\lambda\right)x_t^r$
holds and this effect disappears. The information rents increase in the expected default rate, and because banks can only reduce them by lowering
 $ x_t^s $
and rationing credit to firms with safe projects, one can see that if the default rate increases sufficiently, the contribution of the misallocation effect will rise.
The second channel is the efficiency wedge, whereby the credit friction generates movements in total factor productivity during the capital-misallocation regime. From equation (22), this can be written as
 \begin{align}A_t = z_t \left( \frac{\eta + \left(1-\eta\right) \left( \lambda x_{t-1}^s + \left(1-\lambda\right) x_{t-1}^r \right)}{ \eta + \left(1-\eta\right) \phi_{t-1} } \right)^{\alpha} \le z_t . \end{align}
If banks are intermediating all available funds, then, as before,
 $\phi_t = \bar{x}_t = \lambda x_t^s + \left(1-\lambda\right)x_t^r$
, and TFP just depends on exogenous technology
 $ z_t $
. When the adverse selection problem for the bank increases, due to increased risky-project firm default, for example, then banks restrict credit to firms by reducing
 $ x_t^s $
and
 $A_t$
falls.
Footnote 24
4. Numerical Analysis
To provide an appropriate benchmark case, we use the same model with the information asymmetry removed. This first-best economy is analogous to a standard real business cycle model; absent the information problem, all firms can be considered equivalent to corporates, and so are able to raise funds in the bond market. Another version of the model is also considered in the analysis to assess the mapping from the credit friction to the interest spread and TFP. For this exercise, the real business cycle model is simulated with the fluctuations in the spread between the savings rate and the expected return to capital implied by the adverse selection economy. Because this introduces a wedge in the marginal efficiency of investment, we refer to this as the “investment wedge” model; it allows us to effectively “switch off” the TFP channel. The exercise reinforces the results from the previous section: if one assumes the economy to be in the full-lending regime in steady state, in the region of the steady state, the credit friction only maps to fluctuations in the interest spread. This produces a financial accelerator mechanism that magnifies the effects of changes to default risk. Larger adverse shocks, however, can cause the economy to switch to a capital-misallocation regime in which lenders restrict credit, choosing to store capital rather than finance all safe projects. For instance, if the default rate of firms with risky projects increases by around 3% from the ergodic mean, credit rationing occurs, and, through the lens of a real business cycle model, appears as a negative shock to TFP, dominating the effects of the investment wedge in all but the marginal cases.
4.1 Parametrization and Calibration
In addition to the parameters common to the real business cycle (RBC) literature, we are left with several parameters specific to the adverse selection economy. The size of firms is pinned down by the required capital, k; however, this has no effect on aggregate outcomes, and so we set
 $ k=1 $
without loss of generality.
Footnote 25
The share of corporate firms,
 $\eta$
, is set to 0.5 in line with the proportion of employment at establishments with greater than 500 employees.
Footnote 26
We calibrate
 $\lambda=0.775$
,
 $p=0.971$
, and
 $ F =0.149$
to target the proportion of risky bank loans, the mean firm entry rate, and the mean loan default rate. For the former, we target 24%, which is the average share of bank loans classified as “acceptable risk” over the interval 1997Q2–2017Q2.
Footnote 27
For the latter, we target a value of 2.8% per annum, taken from the average delinquency rate on commercial and industrial loans over the period 1987Q1–2017Q1.
Footnote 28
Finally, we target a mean annual firm entry rate of 12.5% in line with the average entry of US establishments over the period 1977–2014.
Footnote 29
We set
 $ r^* $
to 1 so the low-return asset is a storage technology.
Footnote 30
These calibrations are listed in Table 1. For the remaining parameters, we closely follow the RBC literature. The capital share of output
 $\alpha = 0.3$
; capital depreciates at
 $\delta = $
2.3% per quarter; and the household discount factor
 $\beta =$
0.99. The utility weight on leisure,
 $\chi = 0.64$
to target a steady-state labor supply
 $H=1/3$
, and the intertemporal elasticity of substitution,
 $\sigma = 2$
. These are all shown in Table 2. We calibrate the shock processes using a simulated method of moments approach; some further detail is given in the next section.
Calibrations of adverse selection model parameters

Parametrization of common real business cycle parameters.

4.2 Simulations
We compute a second-order pruned perturbation approximation to the model and impose the inequality constraints following the algorithm of Holden (Reference Holden2016).
Footnote 31
We draw comparison to the first-best economy, which is equivalent to the standard RBC model.
Footnote 32
To calibrate the persistence parameter, we estimate an autoregression of TFP with a linear trend,
Footnote 33
finding
 $ \rho_z = 0.978$
. The remaining parameters controlling the shock processes are calibrated to target second moments and cross-correlations. The standard deviation of the technology shock was calibrated to
 $ \sigma_a = 0.00619 $
,
Footnote 34
while the standard deviation and persistence of the risk shock were calibrated to
 $ \sigma_p = 0.00633 $
and
 $ \rho_p = 0.800 $
, respectively.
Footnote 35
We did initially include a shock to the relative value of risky projects, but this was calibrated to zero.
4.2.1 Unconditional moments
To gain some insight into the empirical performance of the model as compared to the financially efficient model, we report simulated and empirical moments in Table 3. The model does well at matching the observed skewness in output and investment despite not being targeted in the calibration. Including the risk shock reduces the procyclicality of consumption and leads to a negative correlation between the interest spread and output. Although a countercyclical response of consumption might seem to count against the model setup, the response is non-monotonic; for risk shocks large enough to cause financial crisis, because the mechanism maps to a decline in TFP, consumption can fall, as it would in the RBC model with a negative technology shock. The simulated moments reflect that the risk shock has no effect on the RBC model. Furthermore, although not targets in the calibration, the mean and standard deviation of the spread between the average rate of return on capital and the risk-free rate,
 $ \Delta_t $
, is 0.64 and 0.181 percentage points, respectively. This is close to 0.57 and 0.178 percentage points, which are the observed first and second moments of the spread between Moody’s BAA corporate bond and 10-year Treasury bond yields.
Footnote 36
Simulated and empirical moments. Data for Y, I, and C is HP-filtered US time series 1983Q2–2016Q2; investment wedge,
 $ \Delta $
, is the spread between Moody’s BAA-rated corporate bond yields and 10-Year Treasury Constant Maturity. Simulated time series of Y, I, and C are HP-filtered. Standard deviations are in percent for Y, I, and C and percentage points for
 $\Delta$
.

4.2.2 Impulse response functions
We now turn to the analysis of the propagation of the risk shock, which is an exogenous increase in the default rate of firms with risky projects, caused by a decline in the success probability,
 $p_t^r$
.
Footnote 37
The central result is that risk matters as a first-order issue. While the disturbance generates economic fluctuations in our model, the value of projects remain equal under symmetric information because
 $\omega_t^r = 1/p_t^r$
, leaving the first-best economy unaffected. Whereas without hidden information, the only important factor regarding firm finance is the expected discounted value, with adverse selection, the increased risk leads to higher information rents and so an increase in the investment wedge. Figure 3 shows impulse response functions to a 1 standard deviation risk shock, that is, an increase in the default rate of 0.63 percentage points. By widening the investment wedge, the increased default rate leads to a sharp 2% downturn in investment. Facing a lower interest rate, households substitute investment for consumption, dampening the overall fall in aggregate demand, which only shrinks by 0.2%. The share of risky loans increases as banks reduce funding to firms holding safe projects, allowing the banks to charge risky borrowers a higher repayment rate,
 $ \tau^r $
.
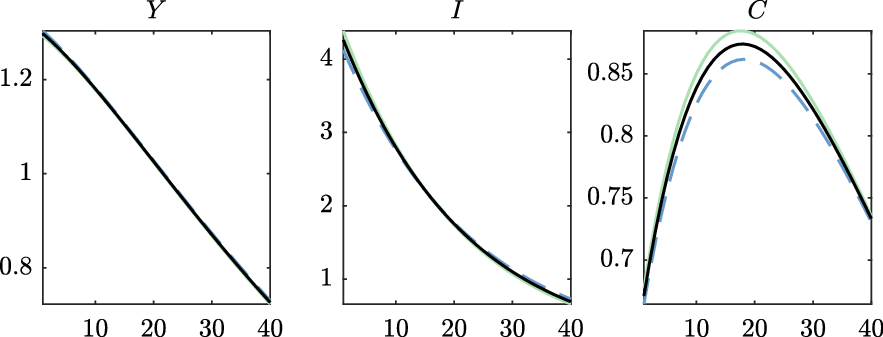
Impulse response functions to a 1 standard deviation (SD) transitory risk shock. Time is quarterly, and plots show percentage deviation from ergodic mean for Y, I, and C, and percentage point deviation for
 $ x^s $
,
 $ \Delta $
, and R.

Figure 4 shows expected impulse responses found by increasing the shock to reach the default threshold,
 $d_{t}^*$
. In this case, the probability of risky-project firm default increases by 3 percentage points, and, due to higher information rents, leads to banks rationing credit to firms with safe projects to charge firms with risky ones higher repayment rates. While the proportion of safe projects that are approved for finance,
 $ x^s $
, falls in both Figures 3 and 4, the former is a general equilibrium result caused by the fall in household saving being greater than the fall in firm numbers, whereas the latter is due, in part, to banks being unwilling to lend all available funds. This leads to a sharp decline in TFP and much sharper contractions in investment and output. Figure 4 also plots a version of the model with the TFP channel “switched off.” This allows us to assess the relative contribution from the endogenous variation in the investment wedge and TFP. For smaller shocks, as in Figure 3, the financial friction is affecting the real economy via the investment wedge, whereas for larger shocks, fluctuations can be mapped to both the investment wedge and TFP.
Impulse response functions to a transitory risk shock of 3% points comparing our model (black line) with a version with the TFP “switched off” (gray line). Time is quarterly, and plots show percentage deviation from ergodic mean for Y, I, C, and A, and percent point deviation for
 $ x^s $
and
 $ \Delta $
.

In this framework, the focus is on supply-side frictions. To model episodes such as the 2007–09 recession, it is necessary to add an exogenous demand-side disturbance. In Figure 5, we plot expected impulse response functions to a combination of the risk shock and a negative demand shock. For the latter, we employ an unexpected increase in
 $ \beta $
of 0.0015.
Footnote 38
The time preference shock occurs simultaneously with a 4.1% shock to the default of firms holding risky projects.
Footnote 39
The financial friction affects real outcomes via the same channels just discussed. Quantitatively, the crisis experiment can capture much of the observed movements in 2008. In the UK, for example, between 2008Q1 and 2009Q2, new loans to SMEs fell by 21%, real GDP fell by 6.13%, real investment by 21.8%, and real consumption by 5.89%.
Footnote 40
With the exception of consumption, the magnitudes of responses shown in Figure 5 are close to that in the data. Furthermore, the 3.3% decline in TFP closely matches that of the OECD measure of multifactor productivity for the UK over the same period, found to be 3.24%.
Footnote 41
Note that given the size of the contraction in investment, without the sharp fall in TFP, it would not be possible to generate the size of the decline in output. Other papers employ shortcuts to account for this issue, including exogenous TFP shocks (e.g. Christiano et al. (Reference Christiano, Eichenbaum and Trabandt2015)) and capital quality shocks (e.g. Gertler and Kiyotaki (Reference Gertler and Kiyotaki2010)).
Impulse response functions to a simultaneous time-preference shock and risk shock comparing our model (black line) with the RBC model (blue dashed). Time is quarterly, and plots show percentage deviation from ergodic mean for Y, I, C, and A, and percentage point deviation for
 $ x^s $
and
 $ \Delta $
.

4.3 Robustness
Some robustness checks of the parametrization were carried out on both the implied deterministic steady state and the model dynamics. The choice of parameters controlling preferences and production technology are standard; we focus on the novel parametrization, beginning with their impact on the steady-state equilibrium. Specifically, we test the parameter calibration by ignoring the target, choosing alternative values, but recalibrating the other parameters to hit the other calibration targets. Increasing the share of firms that have an observable state,
 $ \eta $
, dilutes the asymmetric information problem. The financial constraints in the banking sector are independent of
 $\eta $
, so the default threshold leading to credit tightening is unchanged. However, because the proportion of firms affected by adverse selection falls in
 $ \eta $
, the impact of credit crunches on aggregate outcomes weakens, and fluctuations in TFP are smaller. If we consider secular increases in
 $ \eta $
,
Footnote 42
holding other parameters constant, we find that, although having a smaller impact on the macroeconomy, credit crunches occur with higher frequency. Because new firms have an increased probability of being a corporate, and receiving surplus
 $ \mathbb{E}_t \left[ R_{t+1}^s-R_t \right]$
, firm entry goes up. The larger number of firms and, in particular, the larger proportion of observable-project corporates reduces the interest spread and the average return on capital. As highlighted in Proposition 2, a lower capital return shifts the default threshold down, so it takes a smaller rise in default to generate credit contractions.
The fixed cost of entry, F, is chosen to target the rate of firm entry. Increasing F will reduce firm entry and thus raise profits until the value of a new firm,
 $ V_t = F $
. Fewer firms will result in a higher return on capital and increased investment wedge. This would cause the default threshold,
 $ d^* $
, to shift down; however, with fewer firms seeking loans, the proportion of firms with safe projects that receive funds,
 $ x^s $
, increases, raising
 $ d^* $
. To hit the calibration target of the share of risky loans,
 $ \lambda $
is calibrated to a lower value so there are fewer safe projects in the economy. This moves
 $ d^* $
down again, reinforcing the effect of a higher return to capital and causing an overall increase in financial instability under higher entry costs. The combined effect, however, is fairly modest.
As would be expected given their role in the optimal contract, the calibrations of p and
 $\lambda$
do have a significant impact on both the stationary and dynamic equilibrium. If
 $\lambda$
is increased, the adverse selection problem weakens because, with fewer risky borrowers, the information rents are reduced.
Footnote 43
Furthermore, a lower
 $ \lambda $
or
 $ \bar{p} $
also imply great financial instability.
Footnote 44
Fewer safe projects imply higher information rents, shifting in the default threshold so credit contractions become more likely (see equation (26)). Likewise, a higher steady-state default rate would be closer to the threshold,
 $ d^* $
, so a smaller risk shock would be needed to reach it.
4.4 Instability and the Real Interest Rate
As stated in Proposition 2, the interest rate affects the likelihood of a credit contraction as the default threshold,
 $ d^* $
, above which the economy will be in the capital-misallocation regime, rises in the interest rate. Figure 6 plots the impulse response functions to a 1 standard deviation risk shock, as in Figure 3, but this time including a simulation with
 $ \beta = 0.993 $
, thus cutting
 $ \bar{R} $
by a bit more than 1% annualized. The reduced interest rate shifts
 $ d^* $
such that a 1 standard deviation shock is large enough to cause banks to restrict lending, leading to a sharp downturn.
Impulse response functions to a 1 SD transitory risk shock comparing baseline calibration (black line) with a low
 $ \bar{R} $
calibration (gray line). Time is quarterly, and plots show percentage deviation from ergodic mean for Y, I, and C, and percentage point deviation for
 $ x^s $
,
 $ \Delta $
, and R.

The result of financial instability with lower interest rates finds support in the data. Figure 7 plots 10-year rolling averages of the real interest rate and output volatility. Footnote 45 There is a negative trend on the whole dataset; however, it is interesting to sort the data into three subsets. The red squares represent the middle episode, 1977–1987, which, by virtue of the rolling window, captures observations from 1972 and includes the impact of the 1973 oil crisis and heightened volatility in the 1970s and early 1980s. The green circles include data between 1988 and 2011, covering the Great Moderation, and the black diamonds represent observations between 1966 and 1976. The negative relationship between the real interest rate and volatility supports our results. Shifts in these curves are likely due to structural factors not in the model, such as the evolving size and nature of financial markets, but could also be partly explained by the share of small establishments, which has been in steady decline. Footnote 46 A higher share of large firms would reduce the adverse selection and indicate a dampening of volatility and could, in part, lie behind the reduced volatility during the Great Moderation, off-setting the declining real interest rate.
Ten-year rolling average US real interest rates against 10-year rolling average US output volatility. 1966–1976 black diamonds; 1978–1987 red squares; and 1988–2011 green circles.

Average impulse response functions to a positive transitory shock to technology
 $z_t$
of 1% for our model (black line) and the RBC (blue dashed). Time is quarterly, and plots show percentage point deviation from ergodic mean for R and
 $ \Delta $
, and percent deviation for other variables.

Percent of reporting small and medium businesses that applied for loans but were denied credit. United Kingdom, 2011–2017. Four quarter moving average. Source: SME Finance Monitor, BDRC Continental.

5. Conclusion
Banks vary the availability of business loans in response to economic conditions by both adjusting interest rates and by varying credit standards. These non-price standards play a potentially important but underexamined role in generating business cycles in advanced economies. In this paper, we have presented a model in which endogenous credit standards emerge from an information asymmetry between bank and borrower relating to a project’s riskiness, the result of which are occasional credit crunches that are observationally equivalent to exogenous productivity shocks through the lens of a standard DSGE model. This contributes to a literature studying models with endogenous volatility in TFP. The existing macroeconomic literature on financial frictions has largely concentrated on mechanisms in which movements are due to misallocation of factors on the intensive margin, that is, capital not being allocated to the most productive firms. In this paper, the misallocation occurs on the extensive margin, where banks restrict the total volume of lending and store capital instead. Footnote 47 The evidence has indicated that both margins affect cyclical movements in TFP (see, e.g. Franklin et al. (Reference Franklin, Rostom and Thwaites2020)).
The mechanism is simple. Firms vary in their privately observed risk, even when expected pay-offs are the same. Lenders can separate borrowers by offering loans with different pairs of interest rates and loan approval ratings; risky borrowers will choose higher interest rates with higher approval probabilities, while safer borrowers will choose lower interest rates with lower approval probabilities. This positive correlation between loan interest rates and approval probabilities finds support in the data. When risky projects are very risky, the lenders will ration credit to firms holding safe projects in order to raise risky borrowing rates, causing drops in TFP. Due to the effect on productivity, through the lens of an RBC model, the risk shock appears as a combination of a negative technology shock and a tax on the return to capital. In the majority of existing macroeconomic models, however, the financial friction only emerges as the latter. This difference allows the model to capture the size of the fall in output observed during the financial crisis without requiring exogenous capital quality or productivity shocks.
The mechanism also introduces a financial accelerator that can help explain why spreads are more volatile than would be expected by changes in the default premia (the credit spread puzzle, see Gilchrist and ZakrajŠek (Reference Gilchrist and ZakrajŠek2012)). Furthermore, the default threshold increases in the interest rate, implying that financial instability, and therefore volatility, is heightened with low interest rates, as supported by the empirical evidence (see Figure 7).
In the model, credit rationing is concentrated on safe SMEs, while risky and corporate firms do not face non-price borrowing restrictions. During the 2008–2009 financial crisis, contractions in credit primarily affected the bank lending channel, so, as corporate firms have access to alternative sources of finance (see De Fiore and Uhlig (Reference De Fiore and Uhlig2015)), the adverse effects fell predominantly on SMEs (see also Fraser (Reference Fraser2012)). Furthermore, we have presented evidence that while credit standards were tightened overall during the downturn with a significant increase in loan rejection rates for less-risky small businesses conditional on observables, riskier firms did not face significantly higher rejection rates (see also Armstrong et al. (Reference Armstrong, Davis, Liadze and Rienzo2013)).
In summary, we have presented a novel contribution to our understanding of the channels by which financial disturbances might have real effects. Particularly relevant currently are the increased risks associated with lower interest rates.
The paper was previously circulated with the title: “Adverse Selection and Financial Crises.” I am grateful to Tom Holden, Cristiano Cantore, Paul Levine, Vasco Gabriel, Antonio Mele, Dave Cannell, Martin Eichenbaum, Ben Moll, Charles Kahn, Stefano Gnocchi, William Barnett, an associate editor, and two anonymous referees for helpful comments and suggestions. I am also grateful for comments from discussants and participants at several workshops and conferences. This paper was based on a doctoral thesis chapter; the financial support by the Economic and Social Research Council [grant number ES/J500148/1] during this time is gratefully acknowledged.
Appendix A. Regression Results
Table 3 presents results from a probit regression using 2011–2017 UK survey data from the SME Finance Monitor Footnote 48 from which we find that low and average risk firms experienced significantly increased rejection probabilities during periods of higher loan rejection rates relative to the 2017, whereas above average risk firms did not.
The dependent variable is the probability of loan rejection conditional on application and several control variables, including the legal status of the firm, the sector, turnover, age and number of employees. Following Armstrong et al. (Reference Armstrong, Davis, Liadze and Rienzo2013), the regression is run separately for low, average and above average risk firms using the Dun and Bradstreet risk ratings included in the dataset. The relevant takeaway is that loan rejection rates were significantly higher between 2011 and 2013 when compared to 2017 for low and average risk firms, but not so for above average risk firms.
Although the survey only begins in 2011, because loan rejection rates remained heightened and, indeed, peaked in late 2013, the sample is still indicative. See Figure 9 in the Appendix D which plots the rate of firms rejected for loans over time.
A.1 Data Source
Data from the Small- and Medium-Sized Enterprise Finance Monitor, 2011–2017 was used. Footnote 49 . Loan rejection is the proportion of firms reporting yes to having “Applied for a new bank loan or commercial mortgage (whether agreed or not)” in the last 12 months, that reported the initial response of the bank: “You were turned down for a loan”. With the loan rejection the dependant variable, conditional on having applied for a loan, we estimate a pooled probit model with bootstrap standard errors. The following indicator variables were used: wave (2011q2–2017q4); legal status; age of the business; sector; turnover bracket; number of employees. Replication codes are provided on request.
Appendix B. Description of Solution Method
This appendix briefly describes the solution and simulation method used to generate model moments and impulse response functions. The presence of inequality constraints stemming from the lending problem are incorporated into the model solution using the algorithm used is that proposed in Holden (Reference Holden2016, Reference Holden2019) for which there is a toolkit available at https://github.com/tholden/dynareOBC.
We first compute a second-order policy function using Dynare, employing the pruning algorithm of Lan and Meyer-Gohde (Reference Lan and Meyer-Gohde2013), then use the Holden (Reference Holden2016) shadow-shock approach to impose the occasionally binding constraints (OBCs) during model simulation. This approach adds partially anticipated, endogenous “shocks” to the bounded equations to ensure the constraints are satisfied. During simulation, a stochastic extended path approach is employed to capture uncertainty about these shocks (see Adjemian and Juillard (Reference Adjemian and Juillard2013); Swarbrick (Reference Swarbrick2021)). Every period of the simulation, expectations of the future shadow-shocks are integrated out up to 32 periods. This captures the effects of the future risk of the inequality constraints binding up to 32 periods into the future. We find that increasing this horizon further has negligible impact on simulation results.
Appendix C. Propagation of Technology Shocks
Following a positive transitory shock to aggregate productivity,
 $z_t$
, in both our model and the RBC model there is an increase in all variables via the standard channel. Plots of impulse response functions to a positive shock to
 $z_t$
of 1% are shown in Figure 8. In the adverse selection economy, both risky and safe project returns increase, and there is a small rise in the interest spread,
 $ \Delta_t $
. On first look, investment and consumption appear more volatile in the model with adverse selection, but output less so. This is a compositional effect; while the steady-state share of investment in our model is about 17.4% of GDP, in line with the US data, the share is 20.8% of GDP in the RBC model. This follows from the parameterization of
 $ \delta $
,
 $ \beta $
and
 $ \alpha $
. The additional volatility is caused by the presence of a positive steady-state spread, reducing the average level of investment and consumption. If the RBC model were solved with a constant spread equal to the average spread in our model, we would actually observe a small deceleration effect as the information rents increase, mildly reducing the marginal efficiency of investment. However, the effect is quantitatively negligible.
Appendix D. Figures
Appendix E. Contract Conditions
The IR and IC constraints are
 \begin{gather}\mathbb{E}_t \left[ \Lambda_{t,t+1} p_{t+1}^i \left( R_{t+1}^i - \tau_t^i \right) \right] \ge 0 , \quad i = r,s, \end{gather}
 \begin{gather}\mathbb{E}_t \left[ \Lambda_{t,t+1} p_{t+1}^i x_t^i \left( R_{t+1}^i - \tau_t^i \right) \right] \ge \mathbb{E}_t \left[ \Lambda_{t,t+1} p_{t+1}^i x_t^j \left( R_{t+1}^i - \tau_t^i \right) \right] , \quad i,j = r,s; i\ne j .\end{gather}
There must be one binding IR and one binding IC constraint. Given that
 $ R_{t+1}^r > R_{t+1}^s \ge \tau^s_t $
, we can write
 \begin{align}\mathbb{E}_t \left[ \Lambda_{t,t+1} p_{t+1}^r x_t^r \left( R_{t+1}^r - \tau_t^r \right) \right] &\ge \mathbb{E}_t \left[ \Lambda_{t,t+1} p_{t+1}^r x_t^s \left( R_{t+1}^r - \tau_t^s \right) \right], \end{align}
 \begin{align}&> \mathbb{E}_t \left[ \Lambda_{t,t+1} p_{t+1}^r x_t^s \left( R_{t+1}^s - \tau_t^s \right) \right] \ge 0 .\end{align}
Then
 $\mathbb{E}_t \left[ \Lambda_{t,t+1} p_{t+1}^s \left( R_{t+1}^s - \tau_t^s \right) \right] \ge 0$
must be the binding IR constraint, which implies that (31) is the binding IC constraint. Using the binding safe IR constraint, the safe IC constraint can be written as
 \begin{gather}0 \ge \mathbb{E}_t \left[ \Lambda_{t,t+1} p_{t+1}^s x_t^r \left( \tau_t^s - \tau_t^r \right) \right],\end{gather}
implying
 $ \tau_t^r \ge \tau_t^s $
. Substituting this into the binding risky IC constraint yields
 \begin{align}\mathbb{E}_t \left[ \Lambda_{t,t+1} p_{t+1}^r x_t^r \left( R_{t+1}^r - \tau_t^r \right) \right] \ge \mathbb{E}_t \left[ \Lambda_{t,t+1} p_{t+1}^r x_t^s \left( R_{t+1}^r - \tau_t^r \right) \right],\end{align}
from which
 $ x_t^r \ge x_t^s $
follows.
E.1 Solution
The solution to the lenders’ problem yields
 \begin{align}& \mathbb{E}_t \left[ \Lambda_{t,t+1} \left(p_{t+1}^r R_{t+1}^r - r^* \right) \right] = \varrho_t - \psi_t \frac{1}{1-\lambda} + \varphi_t^r \frac{1}{1-\lambda}, \end{align}
 \begin{align}& \mathbb{E}_t \left[ \Lambda_{t,t+1} \left( \left(\lambda + \left(1-\lambda \right)p_{t+1}^r \right) R_{t+1}^{s} - r^* \right) \right] = \varrho_t + \varphi_t^r - \varphi_t^s.\end{align}
These taken with the following Kuhn–Tucker conditions:
 \begin{align}& {\varphi}^s_t \ge 0, \end{align}
 \begin{align}& {\varphi}^r_t \ge 0, \end{align}
 \begin{align}& \varrho_t \ge 0, \end{align}
 \begin{align}& \psi_t \ge 0, \end{align}
 \begin{align}& {\varphi}^s_t x^s_t = 0, \end{align}
 \begin{align}& {\varphi}^r_t \left(1-x^r_t\right) = 0, \end{align}
 \begin{align}& \psi_t \left(x^r_t - x^s_t \right) =0, \end{align}
 \begin{align}& \varrho_t \left(\bar{x}_t - \lambda x_t^s - \left(1-\lambda\right) x_t^r\right) = 0 ,\end{align}
imply the outcome to the contract problem
Appendix F. Proofs
Proof 1 (Proof of Proposition 1). Using equations (19) and (20) with
 $ p_{t}^rR_{t}^r = R_t^s $
, we find
 \begin{align} \mathbb{E}_t \left[ \Lambda_{t,t+1} R_{t+1}^s \right] = \frac{\phi_t + \mathbb{E}_t \left[ \Lambda_{t,t+1} \right] \left( \lambda {x}_{t}^s + \left(1-\lambda\right) {x}_{t}^r - \phi_t\right) r^*}{ \lambda {x}_{t}^s + \left(1-\lambda\right) \left( {x}_{t}^r - {x}_{t}^s \left(1- \mathbb{E}_t \left[ p_{t+1}^r \right]\right) \right) } , \notag \end{align}
where
 $\phi_t\equiv \frac{S_{t}}{\left(1-\eta\right)f_{t} k}\ge \lambda {x}_{t}^s + \left(1-\lambda\right) {x}_{t}^r$
. It follows that
 $\mathbb{E}_t \left[ \Lambda_{t,t+1} R_{t+1}^s \right] > 1$
if
 \begin{align} \mathbb{E}_t \left[1 - \Lambda_{t,t+1} r^* \right] \left( \phi_t - \lambda {x}_{t}^s - \left(1-\lambda\right) {x}_{t}^r \right) > - \left(1-\lambda\right) \left( {x}_{t}^s \mathbb{E}_t\left[ \Lambda_{t,t+1}\left(1- p_{t+1}^r \right)R_t \right] \right) ,\notag \end{align}
which must hold when
 $\mathbb{E}_t \left[\Lambda_{t,t+1}r^*\right] \le 1$
, which will when
 $ r^* \le R_t$
. It follows from equation (6) that
 $\varrho + \varphi_t^r > 0$
. Substituting equation (6) into (7) then yields
 \begin{align} & \mathbb{E}_t \left[ \Lambda_{t,t+1}\left(1-p_{t+1}^r\right) R_{t+1}^s \right] = \varphi_t^s - \psi_t \frac{1}{1-\lambda} + \varphi_t^r \frac{\lambda}{1-\lambda}, \notag \end{align}
 $p_t^r < 1 \forall t$
, and therefore
 $\varphi_t^s + \varphi_t^r > 0$
. It is straightforward to see from conditions (41)–(44) that if
 $\varphi_t^s>0$
, then
 $\varrho = 0$
. Therefore,
 $\varphi_t^r > 0$
and
 $x_t^r = 1$
.
Predictive margins of year effect on rejection probabilities relative to 2017. Details are in Appendix A.

p-values in parentheses
 $^{\star} p<0.05$
,
 $^{\star\star} p<0.01$
,
 $^{\star\star\star} p<0.001$
p-values in parentheses
 $^{\star} p<0.05$
,
 $^{\star\star} p<0.01$
,
 $^{\star\star\star} p<0.001$