

The computational revolution has shaped diverse domains of scholarship from the humanities to the sciences. Archaeologists, cultural heritage professionals, and the populations they seek to engage benefit greatly from these developments, particularly the growing ease of three-dimensional (3D) model production, sharing, and manipulation. A number of technologies—ranging from computed tomography and laser scanning to photogrammetry—facilitate the visualization and analysis of 3D data and may be incorporated into museum exhibits or viewed remotely. Inexpensive hardware and software, combined with a simplicity of practice, have fueled an explosion of interest in creating 3D representations of anthropological subjects.
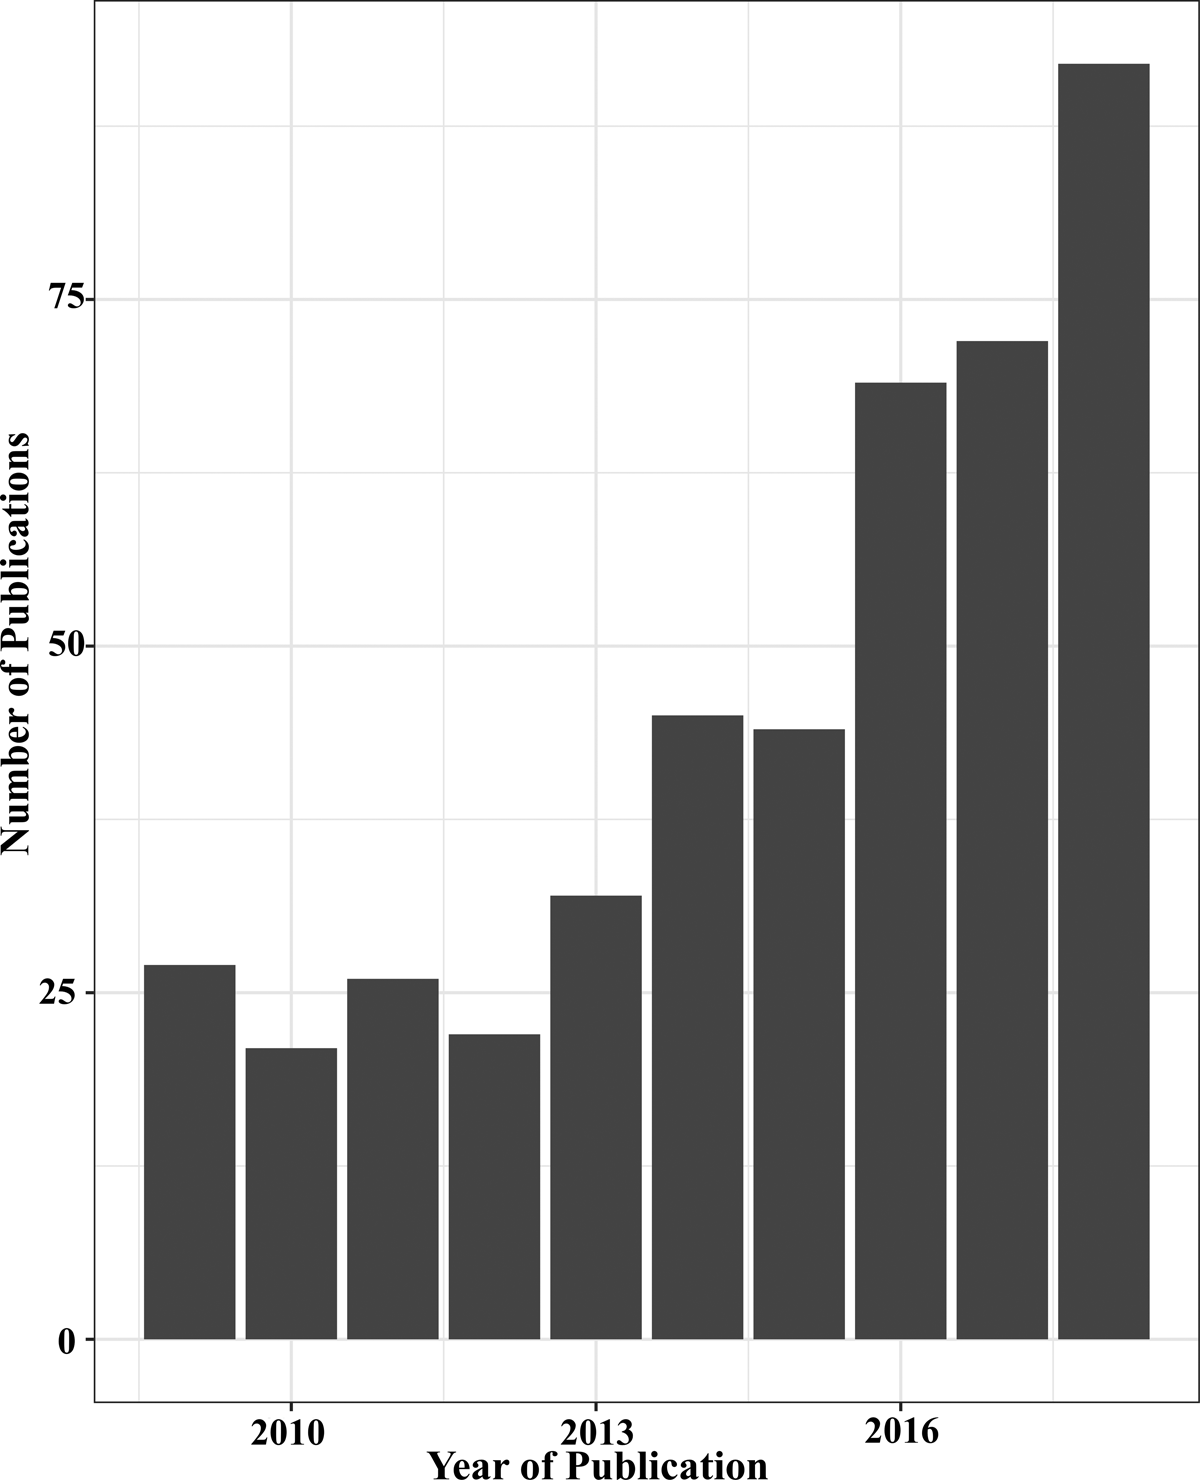
Of these tools, photogrammetry has emerged to play an important role for communities of researchers and the public alike. Defined broadly, photogrammetry involves the measurement of distances from still photographs (Bolles et al. Reference Bolles, Baker and Marimont1987; see also Magnani and Douglass Reference Magnani and Douglass2018). The rapid development and declining cost of computer hardware ensure that a tool once reserved for national governments that had access to specialized equipment is now available to individual researchers with modest budgets. This rapid growth in the use of photogrammetry has recently led to a proliferation of publications detailing photogrammetric protocols and proofs of concept. Using the data scraper Publish or Perish, we were able to demonstrate the expansion of photogrammetry's use from 2009 to 2018 across 10 major archaeological publications: 27 manuscripts mentioned photogrammetry in 2009 versus 92 publications in 2018, attesting to a threefold increase within the decade (Figure 1).
Bar graph showing an increase in publications mentioning photogrammetry from 2009 to 2018, derived from the data scraper Publish or Perish. Analysis was limited to high-ranking publications in archaeology and heritage studies that have been existence for the last 10 years: Archaeological and Anthropological Sciences, Antiquity, Current Anthropology, Heritage Science, International Journal of Heritage Studies, Journal of Archaeological Science, Journal of Archaeological Method and Theory, Journal of Cultural Heritage, Journal of Field Archaeology, and World Archaeology.

Although photogrammetry may be used to create and analyze datasets to answer new questions about the past, the majority of scholarly papers remain focused on the technology and the creation of visual representations at the expense of photogrammetry's application and analysis. As Shott suggests about digital applications more generally, “Certainly, the burgeoning literature on digital methods in archaeology has its share of ‘See what I did because I could do it’ contributions. There is nothing wrong with such papers when they serve as proof-of-concept, but they do not always contribute directly to the accumulation of archaeological knowledge” (Reference Shott2014:2). In another review on digital archaeology, Zubrow offers a similar reflection: “There is a tendency to use digital technological solutions simply because one has the ‘toys’ available” (Reference Zvietcovich, Navarro, Saldana, Castillo and Casaneda2016:22).
In recent commentaries on the computational revolution in archaeology, scholars have considered both the promise and unreached potentials of applying new technologies—ranging from 3D imaging to large-scale database analysis—to address innovative research questions and expand archaeological knowledge (Grosman Reference Grosman2016; Howland Reference Howland, Levy and Jones2018; Shott Reference Shott2014). Grosman suggests, “We should target issues that cannot be resolved using traditional approaches and benefit from data that are accessible only by applying digital methodologies,” but she questions whether these benefits of new technology have been realized (Reference Grosman2016:140).
Does photogrammetry have greater interpretive potential than previously employed archaeological methods? Or is it best suited as a new medium for community outreach and visualization? In either case, is its practice addressing the needs of archaeologists and the communities we work with, or are we preoccupied with demonstrating the merits of the latest software and workflows?
Photogrammetry in Perspective
It has only been in the last decade, and even more so in the last five years, that there has been an exponential increase in the number of published papers integrating photogrammetry. This increase was brought about by the declining costs of and improvements in computer technology, including both hardware and software advances, coupled with similar changes in digital photography. Compared to earlier technologies that required heavy and expensive equipment paired with specialists for data processing and interpretation (Anderson Reference Anderson1982; Fussell Reference Fussell1982; Turpin et al. Reference Turpin, Watson, Dennett and Muessig1979), contemporary photogrammetry simply requires a digital camera matched with generally inexpensive or open-source software. Because of this ease of accessibility, photogrammetry compares favorably to other 3D digitization methods used today, such as laser and white-light scanners that are often bulkier, are expensive, and may require specialized operators.
The development of a range of options for processing and manipulating data has further encouraged the widespread adoption of photogrammetry. Several software packages are available to process models; they range in price from free to those with monthly or yearly subscriptions. Although some programs are conducive to object-based modeling (e.g., AutoDesk ReCap, PhotoModeler Scanner, RealityCapture), others are frequently used or intended for aerial applications (e.g., Altizure, AutoPilot, Pix4D). Because of its straightforward interface and relatively low cost, Agisoft PhotoScan (re-released as Agisoft Metashape) has emerged as the preferred software for archaeologists, especially those with access to an educational license (De Reu et al. Reference De Reu, Plets, Verhoeven, De Smedt, Bats, Cherretté, De Maeyer, Herremans, Laloo, Van Meirvenne and De Clercq2013; Douglass et al. Reference Douglass, Lin and Chodoronek2015; Fassi et al. Reference Fassi, Fregonese, Ackermann and De Troia2013; Olson et al. Reference Olson, Placchetti, Quartermaine and Killebrew2013; Roosevelt et al. Reference Roosevelt, Cobb, Moss, Olson and Ünlüsoy2015). However, in other cases—for instance, when using historic imagery with low overlap between photographs—alternate algorithms (e.g., Automatic Terrain Extraction) and software (e.g., SocetGXP) may be desirable (Papworth et al. Reference Papworth, Ford, Welham and Thackray2016).
In the following discussion of recent studies on photogrammetry, we focus on one of its most frequently used forms—modeling using structure-from-motion (SfM)—which entails the production of 3D data from a series of overlapping photographs. We categorize previously conducted research based on the scale of inquiry, beginning with photogrammetric modeling as practiced at its smallest, sub-centimeter scale, to ground-based photogrammetry, and finally to landscape-scale projects that often rely on photographs collected by unmanned aerial vehicles (UAVs). We scaffold a discussion of the general trends, advances, and shortcomings of each of these scales of inquiry on examples drawn from our own recent applications. We consider why photogrammetry has been used at each scale and whether its use has permitted the approach of archaeological and anthropological data from new angles. Our role is as archaeological and anthropological practitioners, not programmers or computer-vision specialists. Despite this, we hope to initiate discussion on the limitations of current mainstream applications—which usually fall into the category of “proof of concept”—and suggest ways we may challenge this trend.
Object-Based Photogrammetry
Uses in Archaeological and Cultural Heritage Research
Artifact analysis is a central component of archaeological inquiry. We define object-based photogrammetry as the production of models on the scale of sub-centimeter artifacts to larger movable objects. At this scale, photogrammetry has been applied to essentially all classes of archaeological remains, including stone, ceramics, and human and animal bone. When applied to individual pieces or assemblages, photogrammetry may be used to extract traditional information in novel ways (e.g., to quantify the length of a stone tool, but from behind a computer screen) or to gather and analyze datasets that were less accessible before the advent of 3D modeling (e.g., artifact cross-sectional profiles or geometric morphometric landmarks). Yet, the analytical potential of the technology at this scale has yet to be realized. With few exceptions, scholars have merely affirmed the accuracy of specific workflows, cultivating best practices in the absence of implementation.
Considering the ubiquity of the technology, photogrammetry has rarely been used to analyze archaeological material. However, some object-based studies analyze both skeletal and lithic remains. In these cases, photogrammetric data often replace that acquired by more expensive and specialized equipment. In studies observing cut marks, researchers combined micro-photogrammetric models with morphometric analysis, observing cross-sectional cut mark profiles at regular intervals. The resulting models allow the evaluation of marks on bones and promise to help identify lithic raw materials used in butchery practices (Arriaza et al. Reference Arriaza, Yravedra, Domínguez-Rodrigo, Ángel Mate-González, Vargas, Palomeque-González, Aramendi, González-Aguilera and Baquedano2017; Maté-González et al. Reference Maté-González, González-Aguilera, Linares-Matás and Yravedra2019; Thompson et al. Reference Thompson, Tyler Faith, Cleghorn and Hodgkins2017; Yravedra et al. Reference Yravedra, Maté-González, Palomeque-González, Aramendi, Estaca-Gómez, Juan Blazquez, Vargas, Organista, González-Aguilera, Arriaza, Cobo-Sánchez, Gidna, Del Val, Baquedano, Mabulla and Domínguez-Rodrigo2017). Photogrammetry thus provides an inexpensive replacement for similar work previously undertaken with costly and immobile equipment, including scanning electron microscopes (González et al. Reference Miguel Ángel Maté, Yravedra, González-Aguilera, Palomeque-González and Domínguez-Rodrigo2015).
An emerging body of scholarship analyzing stone tools has also applied photogrammetry. Here, the technology replaces measurements made with devices ranging from calipers to microscribes. In a study analyzing Levallois technology, Ranhorn and colleagues (Reference Ranhorn, Braun, Gürbüz, Greiner, Wawrzyniak and Brooks2019) calculated core volumes and flake scar angles, though they note the same data could have been derived from other methods, including comparatively low-technology cross-beam calipers (Lycett et al. Reference Lycett, von Cramon-Taubadel and Foley2006). Analyzing cores from experimental and archaeological assemblages, Ranhorn and coauthors established geometric measures drawing on preexisting analytical frameworks in lithics. Porter and colleagues (Reference Porter, Roussel and Soressi2019) measured core attributes with greater precision than achieved with traditional methodologies using notoriously clumsy and imprecise instruments like goniometers. Finally, other scholars integrated morphometrics to analyze ethnographic stone tool use among the Hadza. Benito-Calvo and colleagues (Reference Benito-Calvo, Crittenden, Livengood, Sánchez-Romero, Martinez-Fernandez, de la Torre and Pante2018) quantified patterns of use wear from baobab pounding, with implications for studying other ethnographic and archaeological collections.
Additional work has explored photogrammetry as a tool to observe edge damage on metalwork (Molloy et al. Reference Molloy, Wiśniewski, Lynam, O'Neill, O'Sullivan and Peatfield2016) and to explain stone artifact reduction sequences on rapidly acquired digital representations of artifacts left in the field (Bleed et al. Reference Bleed, Douglass, Sumner, Behrendt and Mackay2017). Researchers extracted landmarks from models of crania to inform research on animal domestication (Evin et al. Reference Evin, Souter, Hulme-Beaman, Ameen, Allen, Viacava, Larson, Cucchi and Dobney2016) and hominin evolution (Hassett and Lewis-Bale Reference Hassett and Lewis-Bale2016). Others used photogrammetric models of crania from archaeological assemblages to differentiate among populations based on temporal morphologies (Timbrell and Plomp Reference Timbrell and Plomp2019). The technique was also proposed as an inexpensive replacement for archaeological illustration (Magnani Reference Magnani2014), and its output was compared to the production of models made with laser (Koutsoudis et al. Reference Koutsoudis, Arnaoutoglou and Chamzas2007) or structured-light scanners (Evin et al. Reference Evin, Souter, Hulme-Beaman, Ameen, Allen, Viacava, Larson, Cucchi and Dobney2016). Photogrammetry is thus most often touted as a replacement for preexisting methodologies—from archaeological illustration to morphometrics: it is seen as useful not because of the new analyses the technology facilitates, but because of the lower cost and improved accessibility of 3D model generation.
Other proof-of-concept papers have demonstrated photogrammetry's potential in reading degraded or destroyed artifact surfaces. Using 3D models, scholars improved legibility of epigraphic Roman texts through manipulation of artificial lighting parameters (Carrero-Pazos and Espinosa-Espinosa Reference Carrero-Pazos and Espinosa-Espinosa2018). In a similar case study, Andreu and Serrano (Reference Andreu and Serrano2019) showed how photogrammetry of stellae and the virtual manipulation of model attributes—including the generation of height maps—can improve readability of weathered or damaged inscriptions. Integrating virtual reconstruction of pottery and designs with other techniques like D-stretch on pottery (González et al. Reference González, Pastor and Casals2019) and reflectance transformation imaging with basketry (Kotoula et al. Reference Kotoula, Robinson, Gandy and Jolie2019), archaeologists developed techniques to visualize designs that had degraded. Other studies matched 3D models derived from photogrammetry with principal component analysis, allowing the complete estimated reconstruction of ceramic vessels (Zvietcovich et al. Reference Zvietcovich, Navarro, Saldana, Castillo and Casaneda2016).
In addition to proof-of-concept papers detailing analytical possibilities, object-based modeling has quickly become a medium for sharing digital representations and engaging with broader publics. Such projects emphasized 3D models as tools for data visualization and sharing with diverse stakeholders. Magnani and colleagues (Reference Magnani, Guttorm and Magnani2018) coupled ethnographic interviews with photogrammetry to improve museum access for Indigenous artisans. In another study by Douglass and coauthors (Reference Douglass, Kuhnel, Magnani, Hittner, Chodoronek and Porter2017), photogrammetric data were collected during “artifact roadshows” that fostered public engagement through the digitization of private collections. The project promises to improve regional archaeological knowledge and relationships with artifact collectors.
Although applications in this area are generally lacking, a robust literature testing photogrammetric workflows has developed. Previous research emphasizes that working with smaller subjects permits tight control to be exerted over data collection parameters. To stabilize the camera and regularize photography routines, objects may be placed on turntables against a matte background to simplify processing (facilitating a step known as masking, or background removal) while the camera is mounted on a tripod. Greater control over camera settings (e.g., low ISO, slow shutter speed, and a high f-stop to increase the depth of field) and lighting (e.g., even, shadowless illumination) similarly influenced model quality positively (see, for example, Gallo et al. Reference Gallo, Muzzupappa and Bruno2014). The equipment for these routines is generally affordable and portable, and different variants were suggested as a best practice to meet different circumstances (Magnani et al. Reference Magnani, Douglass and Porter2016a; Porter et al. Reference Porter, Roussel and Soressi2016; Sapirstein Reference Sapirstein2018).
Researchers have emphasized the flexibility of the technology and the need to employ methodologies suited to the research context at hand. For instance, with field-based applications where time is the primary limiting factor, it is often sufficient to use a more expedient, less tightly controlled setup to generate models (e.g., Bleed et al. Reference Bleed, Douglass, Sumner, Behrendt and Mackay2017). In other cases, conditions may allow, and research questions may warrant, a workflow using a turntable and controlled lighting. Practitioners must strike a balance between the precision and detail needed for the specific 3D research application and the time, budget, and scope of the modeling that has to be completed. Work comparing two approaches—one expedient and one refined—demonstrated that they differ qualitatively but not significantly quantitatively: both approaches produced models with accuracy within the tolerance of caliper measurements (Magnani et al. Reference Magnani, Douglass and Porter2016a, Reference Magnani, Douglass and Porter2016b). Nonetheless, qualitative differences influencing model visualization indicate the benefit of more controlled protocols.
A Case Study in Object-Based Research
A recent report on Early Stone Age bifaces exposed by erosion in the Doring River Valley in western South Africa shows how object-based photogrammetric models facilitate detailed, post-fieldwork analysis (Bleed et al. Reference Bleed, Douglass, Sumner, Behrendt and Mackay2017). We also include this example as an illustration of how digital models support remote study.
Drought and overgrazing along the Doring River increase erosion of terrace sediments, exposing discrete archaeological surfaces. A survey of the broader area revealed a particular abundance of scatters dating to the Middle Stone Age (MSA) and post-MSA time periods (Lin et al. Reference Lin, Douglass and Mackay2016; Shaw et al. Reference Shaw, Ames, Phillips, Chambers, Dosseto, Douglass, Goble, Jacobs, Jones, Lin, Low, McNeil, Nasoordeen, O'Driscoll, Saktura, Sumner, Watson and Mackay2019). The area of Uitspankraal 1 (UPK1) reflects one such exposure, with multiple archaeological components mostly dating to the MSA. UPK1 rests on an undated calcrete; U/Th dating was unsuccessful due to high levels of debris in the sediment. However, the same geological component at nearby UPK9 returned dates of approximately 220,000 years ago (Mackay et al. Reference Mackay, Sumner, Jacobs, Marwick, Bluff and Shaw2014). While conducting a reconnaissance survey at UPK1 in 2014, 21 Early Stone Age (ESA) bifaces were discovered along a pronounced ridge. This unique find presented a commonly encountered archaeological dilemma: time in the area was limited, the research permit did not authorize artifact collection, and the authors would not be able to return to the location for additional analysis any time soon.
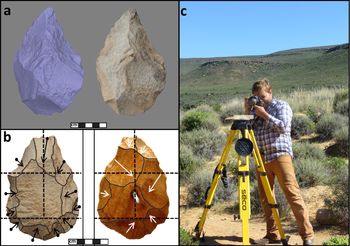
To facilitate detailed research of the newly discovered artifacts, a series of overlapping digital photographs were taken of each biface. The bifaces were placed on an improvised stand, consisting of a block of wood with a nail driven partially through, which was mounted on a survey tripod. Photographs (approximately 100 per biface) were taken at multiple angles by moving around the artifact and stand (Figure 2). Automatic camera settings and natural lighting were used. The approach provided a seamless representation in one step, without the need for merging separate chunks, and it generated serviceable and quantitatively accurate models under field conditions (Magnani et al. Reference Magnani, Douglass and Porter2016a). On return to the United States, each biface was processed using Agisoft Photoscan.
UPK1 Bifaces. (a) Representative 3D model; (b) flake scar organization recorded through virtual analysis of model orthophotos; and (c) Matthew Douglass using an expedient photogrammetry setup. (Color online)

Three observers then conducted a virtual analysis of the collection. Each lithicist digitally examined textured and untextured biface models to determine the number, orientation, placement, and sequence of flake scars. This information was recorded in sketches that depicted biface outlines and provided a template for organizing information about the reduction of each artifact.
Combined, the models and inferred reduction sequences provided a basis for examining each artifact's history and spoke to broader behavioral patterns underlying production and discard at UPK1. Results demonstrated considerable variation in the initial blank/cobble shape, reduction intensity, and biface outline, but regularity in the placement, sequencing, and procedural organization of blows. These findings, as well as the comparison to bifaces documented in other contexts in the study region, will support further understanding about the unique life histories of ESA bifacial tools, as well as the cognitive and social processes of those who made, used, and discarded the objects.
Our initial approach represented a conventional analysis undertaken in a virtual setting. However, a distinct benefit of photogrammetric modeling is the ability to retain and share models for future work. Volumetric and morphometric landmark-based analysis (e.g., Iovita and McPherron Reference Iovita and McPherron2011; Ranhorn et al. Reference Ranhorn, Braun, Gürbüz, Greiner, Wawrzyniak and Brooks2019) is possible using the reported biface models. At the same time, growing collections of ESA/MSA bifaces housed in digital archives (e.g., Sketchfab) will facilitate expanded comparison of the Doring sample to materials from other archaeological contexts in South Africa and beyond. Although widespread digital analysis lags behind the production of 3D data, the preservation of these Doring models provides an accessible record for future study.
In sum, virtual examination of an assemblage of ESA bifaces supported detailed post-fieldwork analysis and established a foundation for additional research. As stand-ins for physical artifacts, the volumetric qualities and photorealistic textures of the biface models provided an analytical experience comparable to hands-on laboratory analysis and exceeded the potential of illustrations or photographs. Photogrammetry thus has potential as a tool not only for remote, post-field analysis and broader collaboration (via model sharing) but also in contexts where artifacts must be left in the field.
A Future Agenda for Object-Based Photogrammetry
Research conducted to date, with few exceptions, highlights the development of the method. These studies hint at what photogrammetry may allow in the future, yet generally lack application to substantial research questions or archaeological datasets. It has been clearly established that the technology is suitable for replacing data acquired using more expensive techniques. Yet, even though complex datasets may be extracted from 3D models, few publications (including our own presented earlier) reported using 3D morphometric landmarks taken from photogrammetric data. Nor has the digitization of artifacts using photogrammetry led to widespread remote analyses that should be technologically possible. In fact, even complex morphometric analyses may be achievable with simple and dependable technology (see Lycett et al. Reference Lycett, von Cramon-Taubadel and Foley2006). Still, in the field or in other contexts where specimens cannot be revisited, 3D models provide the opportunity to return and extract additional data. Therefore, applications may increase with time as researchers become more aware of these potentials and more comfortable with and trusting of photogrammetric workflows.
Despite its unrealized potential, we expect that object-based photogrammetry will retain and expand its utility in some cases (e.g., under specific field conditions or contexts where budgets are limited or a faithful photographic texture is important) and contract in others. In particular, its cost effectiveness may be overshadowed by structured-light and laser scanners, technologies that will continue to decrease in price and improve in speed, accuracy, and precision. Though most accessible, photogrammetry lags behind comparable technologies in application. Structured-light and laser scanners were adopted earlier and remain better established analytical tools. For example, publications drawing on nonphotogrammetric scan data have furthered the study of lithic reduction, from the measurement of flake mass (Clarkson and Hiscock Reference Clarkson and Hiscock2011) and cortex (Lin et al. Reference Lin, Douglass and Holdaway2010) to post-depositional transformation (Grosman et al. Reference Grosman, Sharon, Goldman-Neuman, Smikt and Smilansky2011). To become more seriously considered as a research tool, studies using photogrammetry must move beyond proof of concept and parallel analyses undertaken with 3D datasets derived using other methodologies.
As with digital applications more generally, photogrammetric modeling can help preserve and share cultural heritage still in use, left in the context of its discovery, or held privately. Digitization can enable remote access to objects independent of distance or the abilities of museums to display those objects publicly (e.g., Hirst et al. Reference Hirst, White and Smith2018; Hollinger et al. Reference Hollinger, Edwell, Jacobs, Moran-Collins, Thome, Zastrow, Metallo, Waibel and Rossi2013; Katyal Reference Katyal2017; Kwan and Kwan Reference Kwan and Kwan2017). Through model viewing platforms, file sharing, and the use of 3D printing, a range of communities may be offered new opportunities to interact, touch, and even possess representations of objects in ways that break through the “glass-case paradigm” of more conventional displays (Wilson et al. Reference Wilson, Stott, Warnett, Attridge, Smith and Williams2017). When we break this barrier in the near future, we will likely see the benefits of matching photogrammetry with techniques of additive manufacture and milling, whereby 3D replicas of artifacts may be used in museum and other public environments (Kaufman et al. Reference Kaufman, Clement and Rennie2015).
Ground-Based Photogrammetry
Ground-based photogrammetry, as defined here, refers to the production of models of immovable objects and features documented from ground height. Images are taken as the photographer moves around the subject being recorded, and the camera is either handheld or mounted to a portable tripod. In practice, ground-based photogrammetry is often merged with aerial photogrammetry (see the next section), particularly when top views of tall features are obtained using cameras mounted to poles. The use of photogrammetry for ground-based applications has moved past discussions of workflows to regular utilization. In practice, most archaeologists use the technology either to gather data comparable to those obtained with existing methods or to remotely visualize data. Digital facsimiles may stand in for inaccessible features, unreachable because of their remote or obscured locations or those lost through excavation or otherwise degraded. Photogrammetric data preserve the ability for post-field analysis, capturing details not easily recorded with pen and paper or photography alone (e.g., profile and sketch maps).
Photogrammetry has been incorporated into excavation routines (Doneus et al. Reference Doneus, Verhoeven, Fera, Briese, Kucera and Neubauer2011; Elvis Badillo et al. Reference Badillo, Alex, Myers and Peterson2020; Garstki et al. Reference Garstki, Schulenburg and Cook2018; Koenig et al. Reference Koenig, Willis and Black2017; Meredith-Williams et al. Reference Meredith-Williams, Hausmann, Bailey, King, Alsharekh, Al Ghamdi and Inglis2014; Peng et al. Reference Peng, Lin, Guo, Wang and Gao2017) in which it is used as an alternative to standard recording protocols, including measurements with total stations and documentation using photographs or pen and paper. Since excavation is destructive and image acquisition is potentially rapid, researchers emphasize photogrammetry's ability to retain visual representations of sediment characteristics and object associations that would otherwise be lost. The same benefits exist for the documentation and preservation of threatened or degrading subjects (e.g., Fujii et al. Reference Fujii, Fodde, Wantanabe and Murakami2009), including more ubiquitous heritage like street pavement (Martínez et al. Reference Martínez, Ortiz and Luz Gil2015) or features destroyed by natural disasters, such as buildings that caught fire (Lancaster Reference Lancaster2018) or architecture damaged by earthquakes (Forlin et al. Reference Forlin, Valenta and Kázmér2018).
Similarly, models provide a basis for post-hoc study after fieldwork. Douglass and colleagues (Reference Douglass, Lin and Chodoronek2015) incorporated photogrammetry with a pedestrian survey, augmenting standard field measurements and facilitating remote analysis. Applications in cave settings (Grussenmeyer et al. Reference Grussenmeyer, Landes, Alby and Carozza2010; Strasser et al. Reference Strasser, Murray, van der Geer, Kolb and Ruprecht2018) and inaccessible spaces such as tombs (Pérez-García et al. Reference Pérez-García, Mozas-Calvache, Vincent and Jiménez-Serrano2019) presented similar cases where digital stand-ins supported visualization and analysis for contexts that were otherwise inaccessible to archaeological examination.
Revisiting archival sources, archaeologists are beginning to demonstrate the value of old excavation photographs for contextualizing contemporary excavations in 3D. From case studies in Greece, Wallace (Reference Wallace2017) demonstrated how using photographs from as far back as the 1970s to generate models provides a useful baseline for conducting archaeological work today. The use of old photographs was also productive for Paleolithic excavations, which often revisit the same sites and benefit from improved spatial context derived from archival photographs (Discamps et al. Reference Discamps, Muth, Gravina, Lacrampe-Cuyaubère, Chadelle, Faivre and Maureille2016). In other exceptional cases, photogrammetry permitted the reconstruction of heritage lost through conflict or natural disaster using publicly shared images (Grün et al. Reference Grün, Remondino and Zhang2004).
Increasing application is also witnessed in rock art studies, where SfM has proven to be an inexpensive and accurate methodology for generating representations of rock art (Jalandoni et al. Reference Jalandoni, Domingo and Taçon2018); in some cases it was used explicitly to document and reinterpret previously studied sites (Salazar et al. Reference Salazar, Garate, Intxaurbe, Rivero and Moreno2019). The technique is sufficiently accessible that it may be used by nonspecialized field crews during rock art survey and documentation, as well as by avocational archaeologists participating in site monitoring schemes (Davis et al. Reference Davis, Belton, Helmholz, Bourke and McDonald2017; Johnson and Solis Reference Johnson and Solis2016; Lynch et al. Reference Lynch, Matthews and Noble2017). Building on the difficulty of visualizing wall modifications like engravings, 3D models derived from photogrammetry allowed a manipulation of shading that improves readings of rock art panels (Carrero-Pazos and Espinosa-Espinosa Reference Carrero-Pazos and Espinosa-Espinosa2018). Height maps generated using Agisoft permitted other rock art researchers to distinguish between prehistoric and historic engravings (López et al. Reference López, Hoyer, Rebentisch, Roesch, Herkert, Huber and Floss2019). Finally, photogrammetric models were even used to estimate the sex of individuals who produced hand sprays in rock art, comparing archaeological and experimental data (Mackie Reference Mackie2015).
Underwater applications (Henderson et al. Reference Henderson, Pizarro, Johnson-Roberson and Mahon2013; McCarthy and Benjamin Reference McCarthy and Benjamin2014; Yamafune et al. Reference Yamafune, Torres and Castro2017) provide a similar opportunity to support detailed mapping and post-hoc metric analysis, facilitating the visualization of inaccessible contexts. Photogrammetric techniques have democratized in parallel with diving technologies, increasing public accessibility and potential risk to underwater heritage. As a result, scholars have argued for the importance of creating photogrammetric repositories of submerged heritage to aid in its preservation (Aragón et al. Reference Aragón, Munar, Rodríguez and Yamafune2018). Further work established underwater photogrammetry as a useful analytical tool in diverse research contexts. For example, researchers verified the accuracy of the methodology for measuring stone anchors, highlighting photogrammetry's benefits as a nondisruptive survey technique after verifying its accuracy through land-based examples (Fulton et al. Reference Fulton, Viduka, Hutchinson, Hollick, Woods, Sewell and Manning2016). Other projects integrating the footage from GoPro cameras demonstrated the viability and flexibility of modeling even under low-visibility conditions (Pacheco-Ruiz et al. Reference Pacheco-Ruiz, Adams and Pedrotti2018).
Applied ground-based studies often facilitate the digital reconstruction of archaeological subjects. These projects may integrate different techniques, including laser scanning or other photogrammetric protocols with SfM (e.g., multi-image spherical photogrammetry). Robinson and colleagues (Reference Robinson, Porter, Figueira and Fletcher2019) used a combination of photogrammetry and LiDAR data to hypothesize about the roof structures of Neolithic temples in Malta, which lack any material traces. In a similar case study, Pierdicca (Reference Pierdicca2018) integrated spherical photogrammetry with Agisoft to re-create monumental archaeological sites in Peru. In another applied case, reconstructions of cisterns using photogrammetry matched with computer simulations improved understandings of volume and fill time required for a UNESCO-registered site in Spain (Ortiz-Cordero and Fernández Reference Ortiz-Cordero and Fernández2017).
Although ground-based photogrammetry supports analysis comparable to standard field measurements and visualization in new formats, the technology infrequently enables new analyses like the abovementioned reconstructions. Instead, models may enable fast and increasingly accurate measurement of features. Photogrammetry was used to estimate the volume of archaeological earthworks (Magnani and Schroder Reference Magnani and Schroder2015), monitor the erosional rates of preserved hominin footprints (Zimmer et al. Reference Zimmer, Liutkus-Pierce, Marshall, Hatala, Metallo and Rossi2018), and evaluate building costs and enable basic measurements of architectural features (Polo et al. Reference Polo, Vaquero and Felicísimo2017; Štuhec et al. Reference Štuhec, Verhoeven and Štuhec2019). Digital analysis of model geometry likewise supported the quantitative measurement of shapes and the documentation of details otherwise invisible to the naked eye. Hixon and colleagues (Reference Hixon, Lipo, Hunt and Lee2017) presented a case in which model curvature analysis elucidated previously unrecorded etching in scoria bodies from the island of Rapa Nui. The authors reported a number of petroglyphs, imperceptible due to color and light conditions in the field, that had previously escaped detection.
Because ground-based photogrammetry entails the documentation of immovable subjects in field contexts, it typically does not offer the level of control over environmental variables seen in lab-based object photogrammetry. Efforts must be made to prepare a scene by removing obscuring vegetation, mitigating human traffic, cleaning excavation units, and placing ground controls for scale and georeferencing. Photography routines vary based on the subject at hand and the circumstances of the project. On one end of the spectrum, photogrammetric survey can be added as part and parcel of regular field recording (Douglass et al. Reference Douglass, Lin and Chodoronek2015; Haukaas and Hodgetts Reference Haukaas and Hodgetts2016). Similarly, the technology represents a valuable tool to record sites that are at risk of destruction (Magnani and Schroder Reference Magnani and Schroder2015) or that have already disappeared (Grün et al. Reference Grün, Remondino and Zhang2004). It may be applied in contexts where archaeologists must collect detailed spatial data quickly or even after the fact; for example, where a salvage site is at imminent risk of erosion, where survey budgets are limited, or where heritage has been destroyed but a sufficient quantity of photographs of the subject exist (Bryan and Chandler Reference Bryan and Chandler2008; Dhonju et al. Reference Dhonju, Xiao, Shakya, Mills and Sarhosis2017; Edwards et al. Reference Edwards, Bigourdan, McCann and Cooper2016; Haukaas and Hodgetts Reference Haukaas and Hodgetts2016; New Palmyra 2019; Project Mosul 2019; Vincent et al. Reference Vincent, Gutierrez, Coughenour, Manuel, Bendicho, Remondino and Fritsch2015). In these circumstances emphasis is placed on the ease of use and the benefit that models can add to more traditional forms of documentation. Photographs are taken rapidly using field-grade cameras and are often shot without the aid of tripods. Camera settings are less often controlled, and scale is determined during postprocessing from objects of known size.
In other situations where higher degrees of accuracy and precision are desired, photogrammetry has been used to document specific features with more advanced planning (Koenig et al. Reference Koenig, Willis and Black2017; Peng et al. Reference Peng, Lin, Guo, Wang and Gao2017; Sapirstein Reference Sapirstein2016). In those cases documentation was done by specialists using more exacting routines. The role of photogrammetric modeling in these cases is comparable to that of terrestrial laser scanning. Printed ground control points tied into a coordinate system (as determined by total station or DGPS) are placed around the subject. In these applications, greater care is taken to produce optimal lighting, tighter controls are placed on camera settings, larger numbers of images are taken from more angles, and tripods are used to stabilize often higher-quality cameras. These controls yield more accurate, precise, and qualitatively superior models.
A Case Study in Ground-Based Photogrammetry of Archaeological Features
To illustrate how photogrammetry facilitates archaeological field research and improves traditional recording techniques, Magnani and Schroder (Reference Magnani and Schroder2015) developed models of earthen mounds at Hopewell Culture National Historic Park and the Newark Earthworks in central Ohio, which were associated with the Hopewell culture of the Middle Woodland period (200 BC–AD 500; Romain Reference Romain and Pachecko1996). Researchers have experimented with numerous mathematical formulas to estimate the volumes of such features (Bernardini Reference Bernardini2004; Jeter Reference Jeter1984). However, these methods necessitate the assumption of simplified shapes to calculate approximations based on “conoidal” or “trapezoidal prism” formulas, for example, and these estimates tend to overestimate the true volume. Other methods, including the use of gridding, contours, and computer simulations, are costly and typically underestimate the true volume (Lacquement Reference Lacquement2010; Sorant and Shenkel Reference Sorant and Shenkel1984).
Ground-based photogrammetry was chosen as an affordable and efficient method to calculate volume and potentially track rates of erosion of the mounds. The researchers used DSLR cameras, an educational license of Agisoft PhotoScan, and an optional photo pole for larger features. They selected the Mound City Group and Newark Earthworks areas, because they are landscaped areas free of vegetation, which facilitates the photography of features (Figure 3a). Up to 200 photographs of single features were taken from various heights and angles. Images were collected at regular intervals around the mounds, creating a circle of inward-facing pictures.
(a) Overhead and profile views of a linear feature from Newark Earthworks, Ohio, used in cross-sectional analysis; (b) overhead and oblique views of an artificial mound used to test photogrammetry's sensitivity to volumetric change. The darker sections represent intentionally placed gravel to highlight modification to the feature. (Color online)

After the models were processed using Agisoft PhotoScan, the researchers determined the limits of features at points of inflection with the ground. Then, watertight models were generated by closing the large hole at the base of the mounds using free software, such as MeshLab (version 1.3.2, developed by the Visual Computing Lab ISTI-CNR). Final analyses and volume calculations were conducted by exporting models to the computer-aided design (CAD) application Rhinoceros 3D (version 5, developed by Robert McNeel & Associates).
Precision was tested by generating up to five separate models of a single feature with different batches of photos. A comparison of volume estimates of these trials demonstrated that results derived from photogrammetry were far more precise than other traditional volume estimates calculated using geometric formulas. Finally, to verify photogrammetry's accuracy in this scenario, Magnani and Schroder (Reference Magnani and Schroder2015) tested the methodology on “mock” mounds that were constructed out of a known volume of sand and altered in controlled ways (Figure 3b). These mounds were photographed in the same manner as those in central Ohio and were additionally mapped with a total station. The results demonstrated that photogrammetry produced accurate and precise models, especially in relation to total station contours. The point clouds generated using triangulated, integrated networks from a series of individual total station points proved far less accurate.
This case study demonstrates that photogrammetry can be used to model features in uncontrolled environments. More importantly, the method was shown to be precise in detecting subtle changes in volume, outperforming measuring instruments like total stations. Finally, the affordability and simplicity of the methodology suggest that photogrammetry may be used in both academic research contexts and in cultural resource management to record and monitor changes in archaeological features particularly susceptible to erosion, either from public use or environmental threat.
The Future of Ground-Based Photogrammetry
Two features of ground-based photogrammetry make it a likely staple among archaeologists. The relative affordability of data capture using cameras and of subsequent processing using inexpensive software makes it an easily accessible resource. Despite its increasing acceptance in the field, it appears to be used most frequently as a recording tool to document features and excavation progress or as a replacement for photographs and maps in conference and seminar presentations.
As with object-based applications, there are competing technologies that threaten to overtake photogrammetry. As terrestrial scanners become more inexpensive and portable, they may eventually surpass photogrammetry in ease of use. Photogrammetry is inherently more subjective because of the variability in the routines described earlier, but its low cost and image-textured skins still make it the best choice for many applications (Davis et al. Reference Davis, Belton, Helmholz, Bourke and McDonald2017).
Although proof-of-concept papers suggest that photogrammetry is suitable for the study of ground-based features, 3D data captured using other technologies are more regularly incorporated into archaeological analyses. As an example related to our case study, terrestrial laser scanning (or ground-based lidar) is already being used to study mound variability. In a case from Queensland, Larsen and colleagues (Reference Larsen, Holdaway, Fanning, Mackrell and Shiner2017) studied 51 shell mounds, integrating radiocarbon dates and studies of shape, to inform the broader understanding of site taphonomy. Moving forward, archaeologists using photogrammetry should first seek to match the body of preexisting work framed by comparable technologies. Regardless, some combination of techniques may represent the best possible solution going forward. For instance, there are now routines that merge data from terrestrial scanners and photogrammetry, where scanning provides metric precision and methodological reliability and photogrammetry provides superior photo realistic texturing (Pepe et al. Reference Pepe, Ackermann, Fregonese and Achille2016).
The development of such approaches will be an essential first step to move photogrammetry beyond its proof stage. We must seek not only to generate new publications on the technology but also contribute more tangibly to bodies of archaeological knowledge, as we seek major changes through the pursuit of “grand challenges” (Huggett Reference Huggett2015). If we are to move beyond implementing photogrammetry as a “digital toy” and as a theoretical rather than just methodological contribution (sensu Zubrow Reference Zubrow, Evans and Daly2006), we must critically assess and expand how the technologies are deployed.
Such broader considerations must inform the way we use photogrammetric models to generate visual representations of our subjects; we must also increase our awareness of how decisions about digitization affect interpretation. As a case in point, Thompson (Reference Thompson2017) critically analyzed the choices made in photogrammetric salvage efforts to reclaim sites lost to conflict in Iraq and Syria. In those efforts, Roman and other pre-Islamic heritage were disproportionately represented in digital reconstructions, even though more recent shrines, mosques, and churches comprised the majority of damaged sites. In other cases, the act of framing can impose a false sense of boundaries for features and other archaeological subjects. For instance, in the example from our presented work, the limits of the mounds were assigned during processing and analysis, potentially affecting an understanding of the broader site or mound context.
Aerial Photogrammetry
At its largest scale, photogrammetry has been combined with aerial photography to reconstruct large archaeological features, sites, and landscapes. This has increased the accessibility of and potential for conservation of archaeological sites in new media and has elaborated gains made using less accessible aerial platforms (e.g., Nikolakopoulos et al. Reference Nikolakopoulos, Soura, Koukouvelas and Argyropoulos2017; Peinado Checa et al. Reference Peinado Checa, Morales and Hernandez2014).
The expansion of aerial photogrammetric modeling in archaeology is directly tied to changing technologies in other sectors. The commercial development of lightweight rotary wing UAVs, including quadcopters, hexacopters, and octocopters, drives cost reductions and performance improvements (Remondino et al. Reference Remondino, Barazzetti, Nex, Scaioni and Sarazzi2011). Improvements include growing payload capacities for camera equipment and GPS-inertial equipment ideal for accurate georeferencing (Eisenbeiss and Sauerbier Reference Eisenbeiss and Sauerbier2011; Nex and Remondino Reference Nex and Remondino2014; Saleri et al. Reference Saleri, Cappellini, Nony, De Luca, Pierrot-Deseilligny, Bardiere and Campi2013; Themistocleous et al. Reference Themistocleous, Agapiou, King, King, Hadjimitsis, Ioannides, Magnenat-Thalmann, Fink, Žarnić, Yen and Quak2014, Reference Themistocleous, Lysandrou, Cuca, Agapiou and Hadjimitsis2015; Vallet Reference Vallet2007). Modern lightweight drones use simple interfaces that allow manual flying with basic training, as well as automatic flying and image acquisition with the use of a tablet or smartphone.
The simultaneous development of high-quality and low-cost video equipment, available to practicing archaeologists and members of the public, expands the possibilities of deriving photogrammetric models from aerial footage. Pérez-Alvárez and colleagues (Reference Pérez-Alvárez, Gonçalves and Cerrillo-Cuenca2019) demonstrated how aerial videos could be used to extract photogrammetric models of landscapes for archaeological analysis. Themistocleous (Reference Themistocleous2017) showed how sites could be modeled using videos posted on social media, vastly expanding potential sources of archaeological data.
For analysis and conservation, models made from aerial photographs come with a smaller price tag than those made by laser-scanning systems and provide photographic textures as well. Aerial photogrammetry permits the analysis and observation of sites—for instance, high or dangerous-to-reach rock art panels—that are typically inaccessible to pedestrian survey or the public (Berquist et al. Reference Berquist, Spence-Morrow, Gonzalez-Macqueen, Rizzuto, Wiley, Bautista and Jennings2018). However, photogrammetry lacks the ability to map ground surfaces accurately in contexts with significant ground vegetation. In addition to these limitations of the technology, in many cases there are legal considerations associated with aerial photogrammetry. As drones have become accessible to the general public, many countries have restricted their use. Governmental permits, as well as local permissions, are often required before UAVs can be used.
To avoid these potential barriers, it may be desirable to collect data from aerial vantage points using photo poles or mast systems, which not only circumvent flight restrictions but also the steep learning curves associated with drones. Photo poles or booms allow cameras to be rigged up to 20 m off the ground (Verhoeven Reference Verhoeven2009), though shorter masts at heights of up to 6 m are reported as more manageable. Masts are used in conjunction with a camera remote and, in some cases, are connected to Wi-Fi to refine camera views from the ground. Increasing mast height results in greater site coverage but sacrifices the mobility of camera systems. At the same time, although these setups may provide similar results to photogrammetric systems integrated with UAVs at low altitude, they often require an increased investment of time and higher quantities of photographs to achieve optimal results (Pérez-García et al. Reference Pérez-García, Mozas-Calvache, Gómez-López and Jiménez-Serrano2018).
Despite these considerations, and because of advances in UAV technology, photogrammetric models made using drones have rapidly become essential tools for archaeologists (Jo and Kim Reference Jo and Kim2017; Lonneville et al. Reference Lonneville, De Roo, Stal, De Wit, De Wulf, De Maeyer, Ioannides, Magnenat-Thalmann, Fink, Žarnić, Yen and Quak2014; Olson and Rouse Reference Olson and Rouse2018; Rinaudo et al. Reference Rinaudo, Chiabrando, Lingua and Spanò2012; Ruiz Sabina et al. Reference Sabina, Ángel, Valle, Ruiz, Molero Garcia and Gomez Laguna2015). When integrated with photogrammetry, UAVs have the potential to quickly produce accurate site maps and architectural plans. In particular, UAVs have excelled at documenting intricate features that benefit from high-resolution results, including agrarian landscapes, rock features and geoglyphs, and threatened sites (Casana et al. Reference Casana, Kanter, Wiewel and Cothren2014; Harrison-Buck et al. Reference Eleanor, Willis and Walker2016; Mark and Billo Reference Mark and Billo2016; Parcero-Oubiña et al. Reference Parcero-Oubiña, Mañana-Borrazás, Güimil-Fariña, Pino, Fábrega-Álvarez and Borie2016; Wernke et al. Reference Wernke, Adams and Hooten2014). When combined with geospatial analyses, these high-resolution models have major implications for expanding the scale and scope of archaeological analysis. The most innovative proofs incorporated machine learning with data derived from photogrammetry. For instance, Orenga and Garcia-Molsosa (Reference Orenga and Garcia-Molsosa2019) demonstrated how drones can automatically identify sherd scatter density.
Aerial photogrammetry is increasingly being used in the creation of digital elevation models (DEMs) that are tasked with site identification, spatial analysis, and conservation. DEMs derived from aerial photographs have been produced from the scale of landscapes to smaller features. For instance, Grund and colleagues (Reference Grund, Pelton, Surovell, Matthews and Noble2016) matched photogrammetry with GIS modeling to analyze bison jump sites. Using this method, they predicted that bison jumps would be expected in areas with low cliff visibility. Howland and colleagues (Reference Howland, Jones, Najjar and Levy2018) created DEMs to model erosion, predicting processes of site formation and degradation. Similar workflows, integrating analysis of satellite imagery and DEMs, were used to understand damage caused by off-road vehicles on features as famous as the Nasca lines (Hesse Reference Hesse2015). On a smaller scale, Kreij and others (Reference Kreij, Scriffignano, Rosendahl and Ulm2018) studied Australian fish traps, modeling their filling patterns to determine their antiquity.
Although the production of accurate maps is essential to the field, some archaeologists have pointed out that, while photogrammetric data and models are being produced frequently, they have been analyzed less often (Megarry et al. Reference Megarry, Graham, Gilhooly, O'Neill, Sands, Nyland and Cooney2018). In the same study, Megarry and colleagues used models constructed from aerial photographs to evaluate Neolithic-era quarries. Analyzing models to determine quarry characteristics, they identified differences in raw materials, with a focus on identifying the tool stone, felsite, and debitage size. Another recent study in Ireland used photogrammetry to visualize and record stone forts on the Tentative List of World Heritage Sites for UNESCO (O'Driscoll Reference O'Driscoll2019). After producing the models, the researchers used GIS analysis to consider least cost paths (LCP) and viewsheds from the features.
A Case Study in Aerial Photogrammetry
A recent study of taphonomic effects on surface assemblages in the Koobi Fora Formation of Marasbit District, northern Kenya, provides an illustration of the increased analytical potential of detailed landscape models. This study showed that landscape-scale surface deposits have the potential to inform interpretations of early hominin mobility and foraging behavior. However, before behavioral inferences can be drawn, an assessment of post-depositional disturbance must be made (Fanning and Holdaway Reference Fanning and Holdaway2001). Water flow is the primary process eroding in situ sediments, and this process has the potential to transport artifacts from their primary locations, creating fluvial lag deposits (Ozán Reference Ozán2017; Petraglia and Potts Reference Petraglia and Potts1994; Rick Reference Rick1976; Schick Reference Schick1986).
Investigating the effect of topography on the surface record requires high-resolution elevation data (<0.5 m/pixel), which are largely commercially inaccessible, prohibitively expensive, and not easily generated with traditional tools (e.g., total stations or other survey equipment; see also Howland et al. Reference Howland, Jones, Najjar and Levy2018). To provide these data in this case study, photogrammetric models were developed with UAVs (DJI Mavic, DJI Phantom), using the free tablet software Pix4D Capture to enable systematic, preplanned autonomous flight paths. The UAV was flown on a series of transects covering the extent of each region of interest. The spacing of each transect was automatically determined by Pix4D Capture to ensure at least 80% overlap between images. During flight, captured images were geotagged with GPS coordinates by the UAV (see Phillips et al. Reference Phillips, Reeves, Douglass and Braun2018).
Agisoft Photoscan Professional was used to generate 3D models. Image geotags and ground control points georectified models to an accuracy of 0.3 m or higher. Models were exported in DEM format, which may then be analyzed using GIS software. The statistical software R—specifically raster and rsaga packages—were used to generate slope, topographic wetness, and stream power models. These surface features allow for the quantification of the effect of flowing water on the modern surface. Whereas slope (Figure 4a) quantifies change in elevation, topographic wetness (Figure 4b) indicates the potential for water to collect in a location, and stream power (Figure 4c) characterizes the erosional potential of any given area. If modern erosional processes were the main impetus for the movement and subsequent redeposition of artifacts on these surfaces, then we would expect the locations of artifacts to be correlated with areas of active water erosion and pooling. In instances where the spatial distribution of specimens does not correspond to these topographical features, it can be assumed that artifact distribution is related to patterns of hominin behavior. These results provide a basis for determining which areas of the surface record can be suitably interpreted to explain ancient land use. They demonstrate the potential of UAV-assisted photogrammetry as a tool for supporting archaeological research on the scale of landscapes (Reeves et al. Reference Reeves, Douglass, Seminew, Miller and Braun2018).
(a–c) Photogrammetric models from Koobi Fora, Kenya. Locations of artifacts compared with their associated landscape topography as characterized by the (a) slope, (b) topographic wetness, and (c) stream power.

Future Prospects in Aerial Photogrammetry
As technology continues to improve, archaeologists can expect further breakthroughs in capturing aerial imagery. The payload of lightweight drones is likely to increase, while the weight of devices like cameras and GPS/INS will drop. Such developments will allow archaeologists to attach other instruments capable of photographing bands outside the visible spectrum that can detect nuances in vegetation and soil types suggesting the presence of past activity areas (Hill et al. Reference Hill, Rowan and Kersel2014). Advances in solid-state or focal-plane array lidar, currently being adapted for self-driving cars, may significantly decrease the size of lidar sensors, allowing them to be attached to lightweight UAVs (see also Risbøl and Gustavsen Reference Risbøl and Gustavsen2018). Aerial photogrammetry, however, is likely to remain an essential mapping tool, because under some conditions it currently offers higher-resolution data than lidar and creates realistic textures based on imagery. Significantly, photogrammetric data of landscapes can be captured with greater frequency and at lower cost than competing technologies, potentially allowing transformation of ground surfaces to be documented at more regular intervals.
Finally, as photogrammetry is increasingly combined with data derived from other technologies, we expect productive intersections with laser scanning systems. Researchers already have shown the possibilities of incorporating aerial photogrammetric data with laser scanning to map urban spaces, including clusters of historical buildings (Balsa-Barreiro and Fritsch Reference Balsa-Barreiro and Fritsch2018).
As with the other scales of study discussed in this article, archaeologists have been slower to deploy photogrammetry to answer research questions than with lidar, which has been used extensively for landscape survey and the study of regional settlement histories (Canuto et al. Reference Canuto, Estrada-Belli, Garrison, Houston, Acuña, Kováč, Marken, Nondédéo, Auld-Thomas, Castanet, Chatelain, Chiriboga, Drápela, Lieskovský, Tokovinine, Velasquez, Fernández-Díaz and Shrestha2018; Chase et al. Reference Chase, Chase, Weishampel, Drake, Shrestha, Clint Slatten, Awe and Carter2010; Inomata et al. Reference Inomata, Triadan, Pinzón, Burham, Ranchos, Aoyama and Haraguchi2018; Murtha et al. Reference Murtha, Eben N, Broadbent, Scherer, Schroder, Wilkinson and Almeyda Zambrano2019). Though such areas are unlikely to be modeled using digital cameras and drones, archaeologists may look to lidar studies to begin to imagine research questions that may be addressed with photogrammetry. Landscape-scale datasets are vital to interpreting the archaeological record, and thus, the affordability of aerial photogrammetry offers opportunities for archaeological sampling unattainable by other means.
Conclusion: The Present and Future of Photogrammetry
In its relatively short life as a user-friendly tool, photogrammetry has democratized the production of complex, 3D datasets. Its availability has improved access to lines of inquiry that were previously reserved for archaeologists with the largest budgets. Data whose collection recently required specialists and expensive equipment—ranging from laser scanners, to lidar, and to total stations— can now be gathered and processed with an inexpensive digital camera, open-source software, and a short period of training.
Bolstering access to complex datasets is a significant development in its own right, one that is central to creating an equitable archaeology. Still, the digital revolution should be transformative for archaeological analysis. The 3D models derived from photogrammetry, however, have made few substantive moves toward realizing this goal. In effect, the benefits of 3D data are not so much that they are revolutionary but that they further ease and facilitate the completion of routine archaeological tasks, including field documentation and sharing representations of our work in a tangible way with diverse publics.
In our synthesis we stress that a majority of studies focus on proofs of concept or recommendations for best practice. Stopping short of revolutionizing archaeology, the most practical advances have been made through the incorporation of photogrammetry in field documentation routines—although we also recognize that the technology has begun to show its potential in cultural heritage applications and community outreach. Moving forward, we hope the ability of 3D models to provide new insights into archaeological data—whether large-scale spatial or small-scale geometric morphometric data—will improve. More and more, these analyses will occur remotely.
Even as innovative applications of this technology are somewhat slow to materialize and are fraught with novel considerations, photogrammetry's future in anthropology and cultural heritage is bright. In addition to improving access and decreasing the cost of traditional analyses, its accuracy will improve as complementing technologies mature in parallel. Virtual reality platforms will continue to decrease in production cost, and 3D data will be integrated with game engines and web viewers to facilitate visualization and analysis (see, for example, Bassier et al. Reference Bassier, Vincke, Hernandez and Vergauwen2018). The incorporation of individual objects with larger landscapes and archaeological sites will create new ways to provide immersive experiences. Advances in 3D printing hold equal potential when paired with photogrammetry. Finally, its utility in education and other training spheres is becoming evident (Means Reference Means2015).
We close this article by challenging archaeologists and other heritage professionals employing digital photogrammetry—including ourselves, whose work is critically reviewed here—to broaden their analytical creativity using the technology. What constitutes a digital revolution in archaeology, and how will photogrammetry contribute to it in the future? Returning to Grosman's (Reference Grosman2016) reflections on the computational revolution, scholars must work beyond using the technology for visualization and move toward analysis.
Photogrammetry and other 3D tools have the potential to revolutionize archaeological practice, but progress has been slow. The most significant analytical advances offered by the technology to date are to augment or perhaps refine existing techniques or to enable post-hoc evaluation of digital facsimiles. Likewise, the ability to communicate archaeological findings to the various publics who use and support our work has been further bolstered by 3D visualization. It may be through interaction with diverse stakeholders that new interpretive and analytical paths will be realized.
Photogrammetry is a well-vetted technique, and further testing in the absence of application is of limited benefit to the field. Instead, anthropologists and cultural heritage specialists must now adapt and develop the questions they are asking of 3D datasets. Perhaps rather than leading to a revolution in analysis, embracing the democratic aspects of the technology and its broad adoption hold the most promise. Still, we remain hopeful that addressing the proposed challenge will lead to a reimagining of the analytical potentials of 3D datasets—and not just those derived from photogrammetry—to integrate broader community perspectives and move beyond the refining and expediting of tested archaeological practices.
Acknowledgments
We would like to thank Simon Holdaway for providing critical feedback on a draft of this article, in addition to the anonymous reviewers who provided commentary. For the research reported in this study, Matthew Magnani was supported by the National Science Foundation Graduate Research Fellowship Program (DGE1144152). Matthew Douglass was supported by the Maude Hammond Fling Faculty Research Fellowship and the Graduate Research Council Grant in Aid of the University of Nebraska, Lincoln. Jonathan Reeves thanks the Leakey Foundation, Wenner-Gren Foundation, and National Science Foundation (DDRIG, Grant Number 1747943) for supporting this research.
Data Availability Statement
The object and ground-based portions of this article are based on previously published data. Inquiries regarding data from the aerial case study may be directed to Jonathan Reeves.