


1 Introduction
When work began on this article, the goal was to investigate whether two novel factors would account for the English comparative forms (more, -er) of a group of adjectives. Ending in an orthographic <y>, pronounced /i/, these are called y -adjectives. Examples include silly, worthy, lazy and friendly. Factors, otherwise known as predictors, of interest are the number of phonemic segments a y-adjective comprises (segment count) and the weight (light, heavy) of its penultimate syllable (penulitmate weight). At the heart of several arguments in this article is a conception of adjectival length based on phonemic segmentation. Hence, to foreground this, I have opted to use the term ‘phonemic segments’ rather than the term ‘phonemes’, on its own. Segment count and penultimate weight have not been studied in past accounts of comparative alternation. As this article will show, their study highlights the value word length defined by segment count has for an understanding of y-adjective comparatives and furthers discussion related to the syllable unit for this understanding. Moreover, where the syllable units that derive penultimate weight assessments of y-adjectives are, themselves, subject to different theories of syllabification, the capacity of accounts of y-adjective comparatives to foreground the non-congruence between these theories shows up in the present work. Called into play correspondingly is the subtlety of morphological complexity in advancing our understanding of y-adjective comparatives. This subtlety, previously attributed to frequencies of comparative constructions in user cognition (Chua Reference Chua2016: 177–8; Reference Chua2019: 397), may now be purported to arise also from subscribed syllabification principles. This renders the morphological factor as possibly subject to downstream implications of non-congruent theories of syllabification. It is in the ways outlined above and more that the present work bites off a larger chunk of the scholarship than intended from the outset. Next, I will explain how formerly studied factors set the scene for foregrounding segment count and penultimate weight as potential predictors of y-adjective comparatives.
2 Linguistic unit volume in English comparative accounts
The potential value of segment count and penultimate weight for an understanding of y-adjective comparatives is traceable to an intrinsic interest in the volume of linguistic units in several accounts of English comparatives. Often evoked to explain the tilting of adjectives in favour of one comparative alternative or another, these units may include a word's syllable(s) (Jespersen Reference Jespersen1949: 347; Schibsbye Reference Schibsbye1965: 134; Zandvoort & Van Ek Reference Zandvoort and Van Ek1977: 188; Quirk et al. Reference Quirk, Greenbaum, Leech and Svartvik1985: 461–2; Palmer et al. Reference Palmer, Huddleston, Pullum, Huddleston and Pullum2002: 1583–4; Carter & McCarthy Reference Carter and McCarthy2006: 439; Hilpert Reference Hilpert2008: 407), its stress distribution (Kruisinga Reference Kruisinga1932: 62; Curme Reference Curme1947: 220; Jespersen Reference Jespersen1949: 350; Zandvoort & Van Ek Reference Zandvoort and Van Ek1977: 189; Quirk et al. Reference Quirk, Greenbaum, Leech and Svartvik1985: 462; Palmer et al. Reference Palmer, Huddleston, Pullum, Huddleston and Pullum2002: 1583; Mondorf Reference Mondorf, Rohdenburg and Mondorf2003: 278), its morphological constituent(s) (Leech & Culpeper Reference Leech and Culpeper1997: 355; Mondorf Reference Mondorf, Rohdenburg and Mondorf2003: 283; Reference Mondorf2009: 141; Hilpert Reference Hilpert2008: 407; Chua Reference Chua2016: 71; Reference Chua2018: 480), and its distributions of premodification (Leech & Culpeper Reference Leech and Culpeper1997: 367; Lindquist Reference Lindquist, Lindquist, Klintborg, Levin and Estling1998: 127; Reference Lindquist and Kirk2000: 132) and complementation (Mondorf Reference Mondorf, Rohdenburg and Mondorf2003: 262; Hilpert Reference Hilpert2008: 407). There are, of course, several other factors evoked in the literature to explain English comparative alternation. However, the ones above are noted because, together, they demonstrate that it is not uncommon – across phonological, morphological and syntactic considerations alike – for accounts of English comparative forms to be underpinned by a reference to the relative volume of linguistic units.
At the phonological level, by sheer count of syllables, we may say that a word with two or more syllables denotes more volume than a monosyllabic word. When we speak of volume, moreover, a correspondent notion is bulk; just as more syllables denote more volume, they may denote more bulk. The association of insufficient ‘bulk’ with phonologically unstressed units (Haspelmath Reference Haspelmath2008: 18) makes it reasonable therefore to include phonological stress as an indicator of linguistic unit volume, i.e. relatively more stress indicates relatively more volume, all other things being equal. Relatively more morphemes in a word may also denote relatively more volume. In saying this, however, it is important to note that a word's morpheme count is not always formally transparent and ascertainable by the amount of surface form material alone. Let us take, for example, the y-adjectives silly /sɪl.i/ and lucky /lʌk.i/. Silly comprises one morpheme, i.e. silly cannot be further broken down into meaningful parts. Lucky, on the other hand, comprises two morphemes, i.e. the meaning of luck and the attribute of experiencing this luck. Although this is so, the two words have the same amount of orthographic and phonetic surface form material – four phonemes and five letters each. The point here is that while with syllables as a linguistic unit, more volume necessarily denotes more surface forms, with morphemes, more volume, denoted by more morphemes, need not necessarily turn up more surface forms. It turns up, instead, morphologically complex rather than simple forms. Beyond a word's span, phrasal-syntactic structures with infinitival or prepositional complements, or premodification, visibly denote more volume than parallel structures without. The linguistic units mentioned – syllables, stress distribution, morphological constitution, complementation and premodification – have all been proposed as potential predictors of English comparatives (Hilpert Reference Hilpert2008: 407; Mondorf Reference Mondorf2009: 64–8, 72–5). Garnered from them then is a sense that differences in the volume of linguistic units impact the choice between more and -er. It becomes easy to see as such how my present interest in segment count and penultimate weight coheres with the way the scholarship has conventionally thought about English comparative alternation. That is, when I think of this alternation as potentially predictable by whether a y-adjective has more or fewer phonemic segments, or a heavier or lighter (Lass Reference Lass and Blake1992: 68; Hyman Reference Hyman2003: 5) penultimate syllable, I am thinking of the alternation in terms of differences in the volume of linguistic units. The volume, in this case, is specified through segment count and penultimate weight rather than, say, through syllables or morphological constitution.
3 Why phonemic segment count?
Word length based on indicators other than syllable count is not novel in predicting between morphological and phrasal alternatives. Character count was a proxy, for example, for word length where more -'s and of-genitives were found, respectively, with longer possessums and longer possessors (Ehret et al. Reference Ehret, Wolk and Szmrecsanyi2014: 276). The mention of the English genitive here may raise a question as to whether English comparative and genitive alternations are comparable in terms of seeking alternative indicators of word length (beyond syllable count) to explain English comparatives. It is true that while they both alternate between morphological and phrasal forms, English comparatives and genitives are dissimilar in some ways. For example, while the way genitives -'s and of order the possessum and possessor feature in how the length of possessums and possessors impact the choice of genitive form (Ehret et al. Reference Ehret, Wolk and Szmrecsanyi2014: 276), an ordering constraint is not likewise prominent in the way adjective length has been studied to impact the choice of comparative form. It might come across somewhat in arguments for end-weight effects (Mondorf Reference Mondorf2009: 100), where more, ‘by creating a heavier constituent’ than -er, is hypothesised to be favoured ‘in end position’. Even then, relevant findings have shown that the condition of positioning/ordering on the comparative is ‘[q]uite tellingly…weakest for disyllabics ending in <y>’. These disyllabics comprise, in part, the adjective group of interest in the present work, though my categorisation of y-adjectives might be noted to also include those that comprise more than two syllables.
The point here is that it seems more fair to do otherwise than to engage in an argument as to whether sufficient similarity exists between English comparative and genitive operations to justify a thinking of the former as potentially predictable by word length indicators alternative to syllable count. No other work at present has placed comparative alternation alongside genitive alternation in reference to word length determinants or otherwise, and hence, there are no grounds a priori to jump the gun and say just because there is an ordering constraint in genitive alternation that intersects with the word length predictor, we have to find a comparable constraint in comparative alternation, even if by coercion through end-weight, before one can propose as follows: word length indicators alternative to syllable count have before explained the choice between English morphological–phrasal alternatives, i.e. in genitive alternation, so there is a possibility these indicators might explain the choice between these alternatives in English comparative alternation. In other words, the case with English genitives ought not to obstruct this proposal on grounds of limited comparability between English comparative and genitive alternations simply because we have no evidence that these grounds matter. On the contrary, if it turns out that a redefinition of word length from syllable count does matter for the choice between comparative more and -er, knowledge of the contribution of redefinitions of this type in understanding both English comparatives and genitives is advanced. The uptake of some form of word length redefinition for its potential in predicting between comparative more and -er is, thus, reasonable.
The more important question is whether, as an alternative to syllable count, adjectival length ought, for the purposes of this study, to be served by character or segment count. Character count seems to present as a good candidate in the first instance, since it has a precedence in affecting the morphological–phrasal alternation in the English genitive (Ehret et al. Reference Ehret, Wolk and Szmrecsanyi2014: 276). High correlations between word character and syllable counts have, moreover, been reported (Ehret et al. Reference Ehret, Wolk and Szmrecsanyi2014: 276, citing Wolk et al. Reference Wolk, Bresnan, Rosenbach and Szmrecsanyi2013: 395), pointing to the former as a close approximation of the latter. However, grounds exist to support the use of segment count as an indicator of adjectival length in the present work. First, the use of segment count to predict comparative forms follows intuitively from the phonemic/phonological character of many previous comparative form predictors (Hilpert Reference Hilpert2008: 407). It follows also from the nature of the data used in this article, namely, seven corpora of British stage comedies spanning between the seventeenth and twentieth centuries (more on this later). Stage comedies are written to be spoken more than they are to be read, so segment count (as a derivative of phonemic segments), more so than character count (as a derivative of orthographic characters), would reflect more authentically the way the comedies would have been received by the populace during the periods in which they were written.
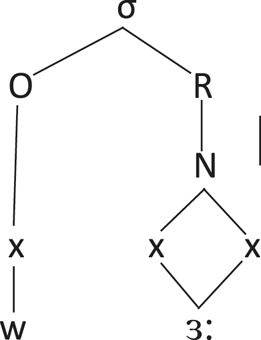
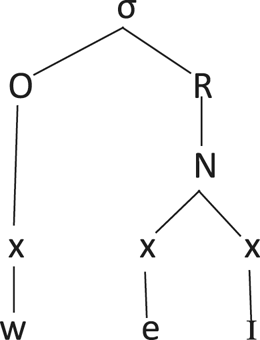
It is useful to point out that in segmenting phonemes to derive segment count in this article, diphthongs and long vowels will be taken to comprise two segments each, following Carr's (Reference Carr1999: 70–1) assignment of these constituents into separate skeletal tiers (or timing slots) within the nucleus of a syllable, as opposed to a single skeletal tier occupied by a short vowel. Examples (1), (2) and (3), respectively, of the syllables /red/ (from /red.i/ ready), /wɜ:/ (from /wɜ:. ði/ worthy) and /weɪ/ (from /weɪ.ti/ weighty) illustrate this. In the examples, σ represents the syllable, O, the onset of the syllable, R, the rime of the syllable, which comprises the nucleus N and the coda C, and x, the skeletal tier/timing slot to which Carr refers. As seen in examples (2) and (3), respectively comprising the long vowel /ɜ:/ and the diphthong /eɪ/ as their syllable nucleus (N), /ɜ:/ and /eɪ/ each branches – whether in or out – from two skeletal tiers x, whereas in example (1), the single short vowel /e/ branches from only one skeletal tier. Graphically, this shows, following Carr (Reference Carr1999), long vowels and diphthongs comprising two phonemic segments each, as against the composition of one phonemic segment in short vowels.
(1)

(2)
(3)
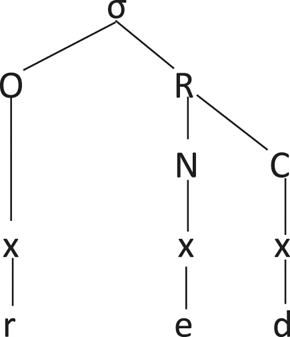
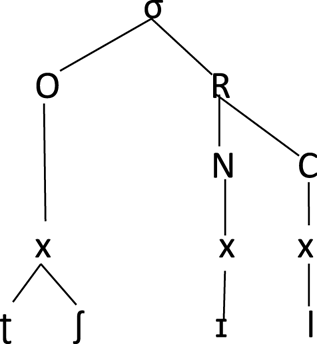
Affricates, though, will be taken as a single phonemic segment, since they have been documented to ‘behave like single segments’, ‘occupy[ing] a single unit of timing’ (Carr Reference Carr1999: 71). As example (4) illustrates with the syllable /ʧɪl/ (from / ʧɪl.i/ chilly), the affricate /ʧ/ branches only from one single skeletal tier x, unlike the long vowel /ɜ:/ and the diphthong /eɪ/, respectively, in examples (2) and (3).
(4)
4 Why penultimate weight?
While word length redefinitions underscore segment count as a potential predictor of y-adjective comparatives, a recognition of y-adjective syllable units, where segment count does not, renders penultimate weight a potential predictor. The fact, for example, that witty /wɪti/ has four segments does not also signal that witty has two syllables; there are other adjectives, such as cross /krɒs/, which have four segments but are monosyllabic. It helps little as well to turn to syllable count for a recognition of syllable units, as, mostly disyllabic, y-adjectives vary minimally in this count. More helpful would be an alternative way of encoding syllable unit variation, and penultimate weight works because, like syllable count, it rests on a delimitation of syllable boundaries.
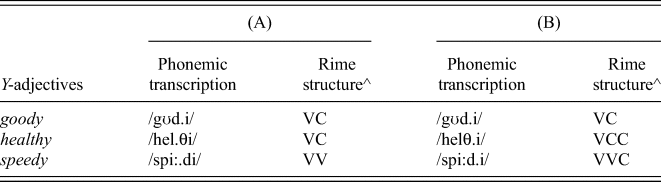
To exemplify this, let us refer to y-adjectives goody, healthy and speedy, and their phonemic transcriptions from two dictionaries (see table 1).
Examples of penultimate weight variation in y-adjectives

Notes:
(A) Phonemic transcriptions based on Cambridge Dictionary online (2020); syllable boundaries are marked by periods (.).
(B) Phonemic transcriptions based on Longman Pronunciation Dictionary (Wells Reference Wells2000); syllable boundaries are marked by periods (.).
^Refers to the rime structure of only the penultimate syllable of a phonemic transcription; V stands for a single vowel; C stands for a single consonant; VV stands for a long vowel, following the classification of long vowels (and diphthongs) to comprise two phonemic segments (see section 3 above).
The adjectives exemplified in table 1 all comprise two syllables. They also do not differ in having a final open syllable comprising the same nucleus, /i/. Of interest is the variation in their penultimate syllable, specifically the weight of this syllable (syllable weight). Syllable weight here and elsewhere is taken to exclude the syllable onset (Hayes Reference Hayes1981; Hammond Reference Hammond1997; Giegerich Reference Giegerich2009), and to depend ‘solely on the properties of [the] rime [my emphasis]’ (Hyman Reference Hyman2003: 6). While there are syllable weight accounts that incorporate the onset, namely, Mora-derived weight accounts (Gordon Reference Gordon2002b: 5), which have some morae constituted, in part, by onsets (Hyman Reference Hyman2003: 16; Bauer Reference Bauer2012: 117–18), an onset-exclusive weight remains justified by the Onset Creation Rule (OCR) (Hyman Reference Hyman2003: 15–16). This rule specifies that the weight unit (WU) of a [+consonant] segment associates with its right [-consonant] segment, consequently deleting onset weight. Given this, and the association of syllable weight with phonemic segments (Gordon Reference Gordon2002b: 2), table 1 shows goody to have a vowel-consonant (VC) rime in its penultimate syllable, and, depending on the dictionary source of the phonemic transcription, healthy is shown to have a vowel-consonant (VC) or vowel-consonant-consonant (VCC) rime, and speedy, to have a vowel-vowel (VV) or vowel-vowel-consonant (VVC) rime. If we accept (see the relevant argument later in section 5.2) that a heavy syllable, compared to a light one, is derived from a complex nucleus or coda – where complexity is defined by a VV and/or a CC rime (Lass Reference Lass and Blake1992: 68), speedy differs from goody in having a heavy, rather than light, penultimate weight. Healthy may be the same or different in penultimate weight from either, depending on whether we take its rime to be VCC – where its penultimate weight is heavy, or VC – where its penultimate weight is light. Differences as noted above justify an encoding of syllable unit variation through penultimate weight.
As illustrated with healthy /helθ.i/ (or /hel.θi/), a y-adjective's penultimate weight may be heavy or light depending on where the boundary lies between the penultimate and final syllable. Found in variant dictionary transcriptions, for example, /hel.θi/ in the Cambridge Dictionary online (2020) versus /helθ.i/ in the Longman Pronunciation Dictionary (Wells Reference Wells2000), these different syllable boundaries stem from different syllabification principles. In the case of healthy, the maximal onset principle (MOP; Carr Reference Carr1999: 74; Schlüter Reference Schlüter and Minkova2009: 169), anticipating coda spillovers to following onsets, has /θ/ syllabified as the onset of the final syllable in /hel.θi/. On the other hand, the syllabification of /θ/ in /helθ.i/ is justified by conditions in Wells (Reference Wells2002) for the retention as codas of syllable-final consonants that might have an alternative conception as onsets of the following syllable. In healthy, the penultimate syllable is relatively more stressed, which attracts /θ/ if ‘consonants are syllabified with the more strongly stressed of two flanking syllables’ (Wells Reference Wells2002). /θ/ is part of the morpheme health, meaning that if ‘consonants belong to the syllable appropriate to the morpheme of which they form a part’ (Wells Reference Wells2002), it should be retained with the penultimate syllable in healthy. In addition to healthy, other y-adjectives exist that have penultimate syllable coda consonants that may be alternatively conceived as final syllable onsets because of the differential syllabification principles between the MOP and Wells (Reference Wells2002). My way around this, barring a removal of syllable unit considerations, is to see whether findings converge from dual sets of analyses – one with penultimate weight data informed by the MOP (dataset-MOP), and another with this data informed by Wells’ (Reference Wells2002) syllabification conditions (dataset-Wells). The datasets used are uploaded to: https://osf.io/9eqrg/
5 Segment count and penultimate weight in comparative alternation
5.1 Data description
To determine whether segment count and penultimate weight account for comparative forms, 253 tokens (54 types) of comparative more and -er y-adjectives were examined. These y-adjectives were obtained from seven diachronic corpora compiled by the author from a selection of British English stage comedy excerpts published between the seventeenth and twentieth centuries. As several excerpts were obtained via institutional access in Victoria University of Wellington from Literature Online (Proquest 1996–2013), with terms governing them solely for personal or internal use, the corpora cannot be made publicly available. Nevertheless, the diachronic slant of these data lends the advantage that any corresponding conclusions drawn about English y-adjective comparative formation would have a built-in consideration of the passage of time.
Each of the seven corpora represents a time span of 50 years and comprises comedy excerpts published within those 50 years. Time periods correspondent to the seven corpora are: 1601–50 (period 1); 1651–1700 (period 2); 1701–50 (period 3); 1751–1800 (period 4); 1801–50 (period 5); 1851–1900 (period 6); and 1901–50 (period 7). Each corpus comprises approximately 288,000 words (Chua Reference Chua2018: 471). The selection of comedies for the corpora was guided by the goals of achieving an approximate measure of consistency in the word counts for each corpus, in the number of playwrights whose plays were included in the corpus, and in the word counts tagged to each playwright – see Chua (Reference Chua2016: 77–9) for a documentation of the compilation process and Chua (Reference Chua2016: 197–203) for a list of the comedies (and their playwrights) included in the corpora. The y-adjectives extracted for examination in the present work, and in previous works based on the seven corpora (Chua Reference Chua2016, Reference Chua2018), were ones found with English comparative forms more or -er within a single 50-year period and/or across multiple 50-year periods of the data.
5.2 Data coding
Each y-adjective of the 253 studied comparative tokens was coded for its number of phonemic segments (segment count) and whether its penultimate syllable was heavy or light (penultimate weight). Since y-adjectives are non-variant in their word-final /i/, segment count excluded this /i/. As above, diphthongs and phonologically long vowels in y-adjectives were taken to comprise two segments each, and affricates to comprise one segment (Carr Reference Carr1999: 70–1). Given diachronic data, transcriptions that derive segment count and penultimate weight considered period-relevant phonemic make-up – see Dobson (Reference Dobson1968), Cruttenden (Reference Cruttenden1994) and MacMahon (Reference MacMahon and Romaine1998). For some y-adjectives, parts of their phonemic transcription required a period-referenced variation from an otherwise contemporary transcription. For example, courtly from a token of more courtly was transcribed /kɔə(oə)ɹtli/ rather than present-day UK English /kɔ:tli/ because it was found in a seventeenth-century corpus. Post-vocalic /r/ loss occurred in the eighteenth century (Cruttenden Reference Cruttenden1994: 75), and since ‘a large number of RP [received pronunciation] /ɔ:/ result from the loss of post-vocalic /r/ in the eighteenth century…via such stages as [ɔə] or [oə]’ (Cruttenden Reference Cruttenden1994: 111), seventeenth-century courtly is most likely pronounced /kɔə(oə)ɹtli/. Where applicable, contemporary transcriptions draw on the Cambridge Dictionary online (2020) and the Longman Pronunciation Dictionary (Wells Reference Wells2000), depending on the syllabification principles that inform penultimate weight for a specific analysis. In view of linguistic economy (Whitney Reference Whitney1868: 28), /p/ optionality in the Longman transcription of empty /empti/ is transcribed without /p/ in the dataset that relies on Wells’ (Reference Wells2002) syllabification principles for penultimate weight coding. Where this /p/ is not similarly optional in the Cambridge transcription, empty is one segment count fewer for dataset-Wells than for dataset-MOP.
The literature presents at least two ways of assessing penultimate weight. As a structural property of a syllable's rime, this assessment may be guided by rime complexity. Here, a light syllable occurs where ‘neither the nucleus nor the coda is complex’ (V and VC rimes), and a heavy syllable occurs where ‘either the nucleus or coda (or both) is complex’ (VV, VVC and VCC rimes) (Lass Reference Lass and Blake1992: 68) – the double-V represents either diphthongs or phonologically long vowels. Syllables where both nucleus and coda are complex (VVCC rime) are superheavy. A second school of thought agrees that V rimes are light and, broadly speaking, that VV, VVC, VCC and VVCC rimes are heavy, but VC rimes are light or heavy (Ryan Reference Ryan2016: 721), depending on a language's obstruent-to-sonorant and voiceless-to-voiced ‘ratio[s] of coda consonants’ (Gordon Reference Gordon2002a: 74). Syllable weight here is guided by a rime's energy more than its complexity, so that a language with fewer sonorant than obstruent, and voiced than voiceless, codas has VC rimes denote a light syllable. Conversely, a language with more sonorant than obstruent, and voiced than voiceless, codas has VC rimes denote a heavy syllable.
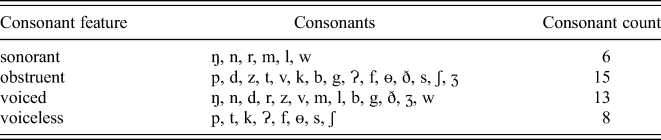
The fact that English is of interest is not particularly helpful for deciding whether y-adjective penultimate weight should be assessed based on rime complexity or rime energy. Even as the language's VC rimes are deemed to represent light syllables (Lass Reference Lass and Blake1992: 68), ‘some extent’ (Hyman Reference Hyman2003: 5) of their heaviness is claimed (Ryan Reference Ryan2016: 721). The grey area, though, in taking English VC rimes as a heavy syllable based on rime energy alone carves out space for supporting these rimes as signals of a light syllable. For this, the English coda consonant inventory in table 2 helps. Here, we see fewer possible sonorant than obstruent codas in the language (6 sonorants versus 15 obstruents), and fewer possible voiced than voiceless codas (13 voiced versus 8 voiceless).
English coda consonant inventory

Note: With the exception of /h/, which is not found as a coda consonant in English, entries follow from the view that ‘English permits stops, fricatives, nasals and liquids as coda consonants’ (Yavas & Core Reference Yavas and Core2001: 37).
While a light syllable in English VC rimes is justified by the relatively higher count of obstruent codas in table 2, a heavy syllable in them is justified by the relatively higher count of voiced codas. This ambiguity is common across languages (Ryan Reference Ryan2016: 728), but a way around it for English is to observe that its obstruent coda count is 2.5 times higher than its sonorant coda count, while its voiced coda count is only 1.6 times higher than its voiceless coda count. Proportion-wise, the case obstruent codas present for having English VC rimes signal light syllables is stronger than the case voiced codas present for having these rimes signal heavy syllables. This coheres with a rime complexity view of syllable weight (Lass Reference Lass and Blake1992: 68), where a VC rime, given its simpler structure than a VV, VVC, VCC or VVCC rime, represents a light syllable. In penultimate weight coding therefore, y-adjectives with a V or VC rime in their penultimate syllable were deemed light. Y-adjectives with a VV, VVC, VCC or VVCC rime in their penultimate syllable were deemed heavy. Although in some places, a VVCC rime deems a syllable superheavy (Lass Reference Lass and Blake1992: 68), y-adjective tokens with this rime structure in their penultimate syllable are few and far between in my datasets – one such token for dataset-MOP, and four such tokens for dataset-Wells. To avert a drastic imbalance in token count for the possible range of penultimate weights, which will pose data convergence issues for statistical analyses, tokens with a superheavy penultimate syllable were collapsed with those of a heavy penultimate syllable.
5.3 Findings
Segment count and penultimate weight were analysed with variables formerly found to predict y-adjective comparatives (Chua Reference Chua2016: 113–15; Reference Chua2018: 480), namely, the corpus period in which y-adjective comparative tokens are found (period) and the morphological complexity of the relevant y-adjectives (morphology). Period (1–7) and segment count (2–7) are continuous variables, and morphology (complex, simple) and penultimate weight (light, heavy) are binary variables. Form (more, -er) was included to identify the comparative forms of y-adjectives. Item, which differentiates between y-adjective lexemes, was included to allow ‘any fluctuation between more and -er’ (Chua Reference Chua2018: 477) to be lexically specified (Palmer et al. Reference Palmer, Huddleston, Pullum, Huddleston and Pullum2002: 1583). With period, segment count, morphology and penultimate weight as independent variables (IVs), form as the dependent variable (DV), and item as a random effect, a series of mixed effects models (MEMs) were fitted using the glmer function from the lme4 package (version 1.1-9) (Bates et al. Reference Bates, Maechler, Bolker, Walker, Bojesen Christensen, Singmann, Dai, Scheipl, Grothendieck, Green and Fox2018) in R (version 3.5.2) (R Core Team 2018). Model comparisons were perfomed using the anova function from the lme4 package. To permit period and segment count effects to differ for y-adjectives, random by-item slopes for these were included where no non-convergent models resulted.
As noted above (section 4), dataset-MOP and dataset-Wells were separately analysed. Initial mixed effects modelling of both datasets included interactions between:
- period and morphology;
- period and penultimate weight;
- morphology and penultimate weight;
- morphology and segment count; and
- penultimate weight and segment count.
 period and morphology;
 period and penultimate weight;
 morphology and penultimate weight;
 morphology and segment count; and
 penultimate weight and segment count.
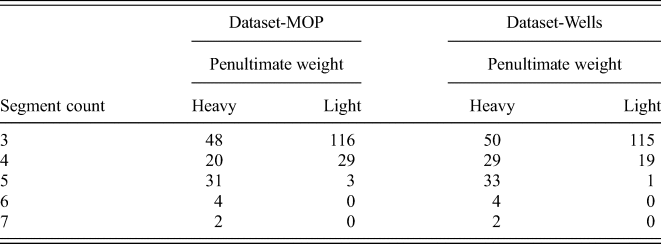
A shift towards comparative -er for y-adjectives with time (Kytö & Romaine Reference Kytö and Romaine1997: 344) and a purported -er bias with morphological simplicity (Leech & Culpeper Reference Leech and Culpeper1997: 355; Mondorf Reference Mondorf, Rohdenburg and Mondorf2003: 283; Hilpert Reference Hilpert2008: 407; Chua Reference Chua2018: 466) justify an interaction between period and morphology in the first instance, to detect whether any -er bias towards later time periods is primarily found with simple y-adjectives (Chua Reference Chua2018: 479). Period and penultimate weight interaction considers the possibility of differential weight effects over time associated with potential diachronic subjectivity in the phonemic make-up of y-adjectives. Interactions between morphology and penultimate weight, between morphology and segment count, and between penultimate weight and segment count consider the potential of overlaps between morphological and weight, between morphological and segment count, and between segment count and weight effects. These overlaps (if any) are worthwhile to note because they would show whether and, if so, to what extent morphological complexity, penultimate weight and segment count, as indicators of the volume of linguistic units, are reinforcing (or otherwise) in predicting y-adjective comparatives. It may be the case, for example, that any bias towards more or -er, with say, a light penultimate weight, is found only in y-adjectives with a relatively lower segment count, given that light weight tokens concentrate in y-adjectives of 4 segments or fewer for both datasets (see table 3).
Cross-tabulation of token counts of y-adjectives between penultimate weight and segment count

Note: Segment count excludes the non-variant word-final /i/ of y-adjectives.
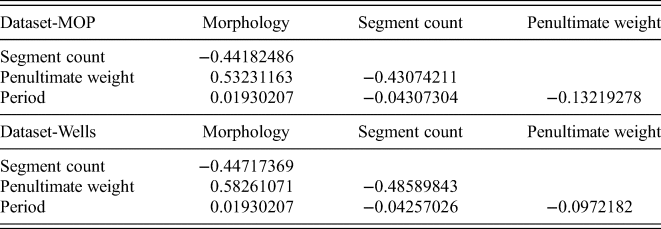
In neither dataset is inclusion, in initial modelling, of one or more of the interactions above pre-empted by any high correlation of the centred IVs in interaction – see table 4 with no value >0.7 (Clark & Randal Reference Clark and Randal2011: 60).
Correlation matrix of all IVs (centred) proposed for inclusion in MEMs of dataset-MOP

Note: Centred IVs are used in this correlation matrix because centring changes the binary IVs into numeric predictors, which a correlation matrix requires.
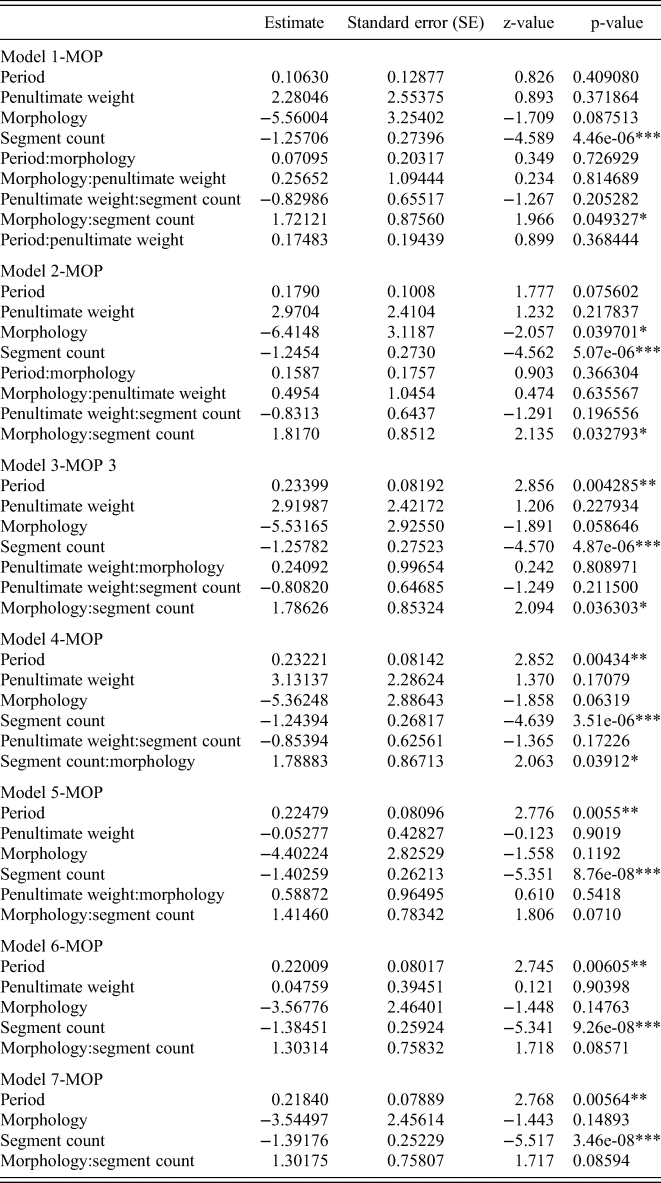
Table 5 presents results from the step-wise modelling of dataset-MOP.
Effects considered for the comparative forms of y-adjectives indicated from seven mixed effects models; Model 4-MOP accepted as most explanatory, dataset-MOP

*p<.05, **p<.01, ***p<.001.
Notes: Factors separated by a colon indicate two-way interactions. For example, period:morphology indicates a two-way interaction between period and morphology. Interactions included generate also simple effects within those interactions. Lower-order significant effects within higher-order ones are not further analysed (De Rosario-Martinez Reference De Rosario-Martinez2015: 6).
From table 5, the initial model, Model 1-MOP, finds a significant interaction between morphology and segment count (estimate=1.721, SE=0.876, z=1.966, p<.05), and so does Model 2-MOP (estimate=1.817, SE=0.851, z=2.135, p<.05). Though the interaction between period and penultimate weight was dropped in Model 2-MOP to see whether significance might obtain for period and/or penultimate weight as simple/independent effects, none was found. Models 1-MOP and 2-MOP do not significantly differ (chi-square chi=0.8206, df=1, p>.05), so Model 2-MOP, with fewer parameters/factors and hence relative simplicity, is accepted over Model 1-MOP. Period, previously found to be significant from the same data (Chua Reference Chua2016: 115; Reference Chua2018: 482), was included only as a simple effect in Model 3-MOP and is again found significant (estimate=0.234, SE=0.082, z=2.856, p<.01), alongside a significant interaction between morphology and segment count (estimate=1.786, SE=0.853, z=2.094, p<.05). Model 3-MOP does not differ significantly from Model 2-MOP (chi-square chi=0.8398, df=1, p>.05) and is accepted over the latter. To see whether significance might obtain for penultimate weight, interactions between penultimate weight and each of morphology and segment count were dropped in turn, respectively, in Models 4-MOP and 5-MOP. Neither Model 4-MOP (chi-square chi=0.0573, df=1, p>.05) nor Model 5-MOP (chi-square chi=1.6694, df=1, p>.05) differs significantly from Model 3-MOP, accepting the former two over Model 3-MOP for their relative simplicity. It is Model 4-MOP, though, that finds the interaction between segment count and morphology significant (estimate=1.789, SE=0.867, z=2.063, p<.05). As this significance resonates with the morphological factor in comparatives noted in other works (Leech & Culpeper Reference Leech and Culpeper1997: 355; Mondorf Reference Mondorf, Rohdenburg and Mondorf2003: 283; Reference Mondorf2009: 141; Hilpert Reference Hilpert2008: 407; Chua Reference Chua2016: 115; Reference Chua2018: 482), Model 4-MOP is accepted over Model 5-MOP on theoretical grounds. The fair number of works just cited is deemed sufficient to constitute these grounds, even if not all of them focus on y-adjectives, and even if some, e.g. Leech & Culpeper (Reference Leech and Culpeper1997), refer to the morphological factor indirectly thorough the concept of suffixation. It is precisely because y-adjective comparatives have not been extensively studied that this work and Chua (Reference Chua2016, Reference Chua2018) came about, so it is not reasonable to expect all prior scholarship on English comparative alternation to have dealt with y-adjectives exclusively before we may appeal to these for the retention of morphological considerations in data analyses. To see whether further model simplification would better explain the data, the interaction between penultimate weight and segment count was dropped from Model 4-MOP. Resultant alternatives modelled with and without random by-item slopes do not, between them, differ significantly (chi-square chi=3.8817, df=5, p>.05), accepting the simpler alternative without random by-item slopes, Model 6-MOP. Although Models 4-MOP and 6-MOP do not significantly differ (chi-square chi=1.9624, df=1, p>.05), technically justifying an acceptance of Model 6-MOP, Model 6-MOP shows no significance of morphology while Model 4-MOP does (in interaction with segment count). As with Models 4-MOP and 5-MOP therefore, Model 4-MOP is accepted over Model 6-MOP on theoretical grounds, i.e. it resonates with previous works that note the morphological factor in comparative alternation (in y-adjectives) (Leech & Culpeper Reference Leech and Culpeper1997: 355; Mondorf Reference Mondorf, Rohdenburg and Mondorf2003: 283; Reference Mondorf2009: 141; Hilpert Reference Hilpert2008: 407; Chua Reference Chua2016: 115; Reference Chua2018: 482). Where a further simplification of Model 6-MOP to Model 7-MOP by dropping penultimate weight does not yield any significant morphological effect as well, Model 4-MOP is decidedly accepted as most explanatory of dataset-MOP.
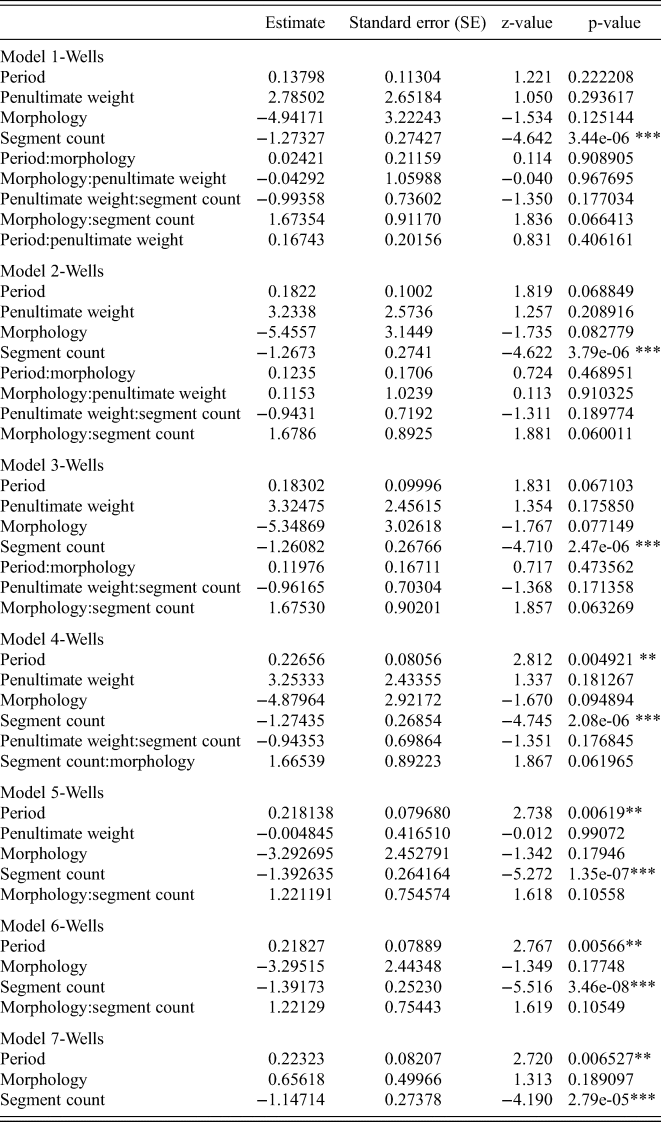
Table 6 presents results from the step-wise modelling of dataset-Wells.
Effects considered for the comparative forms of y-adjectives indicated from seven mixed effects models; Model 7-Wells accepted as most explanatory, dataset-Wells

*p<.05, **p<.01, ***p<.001.
Notes: See notes to table 5.
From table 6, the initial model, Model 1-Wells, finds a significant simple effect of segment count (estimate=−1.273, SE=0.274, z=−4.642, p<.001), and so does Model 2-Wells (estimate=−1.267, SE=0.274, z=−4.622, p<.001), though the latter excluded the interaction between period and penultimate weight. Since Models 1-Wells and 2-Wells do not significantly differ (chi-square chi=0.7086, df=1, p>.05), Model 2-Wells, with fewer parameters/factors and hence relative simplicity, is accepted over Model 1-Wells. To see whether significance might obtain for morphology, the interaction between morphology and penultimate weight was dropped in Model 3-Wells; here morphology and period come close to, but do not reach significance, while segment count remains significant (estimate=−1.261, SE=0.268, z=−4.710, p<.001). Models 2-Wells and 3-Wells do not significantly differ (chi-square chi=0.0126, df=1, p>.05), accepting Model 3-Wells for its relative simplicity. Since effects each of period and morphology were found significant in prior work (Chua Reference Chua2016: 115–16; Reference Chua2018: 482), the interaction between them was dropped in Model 4-Wells to see whether this would yield their significance again; here, period is found significant (estimate=0.227, SE=0.081, z=2.812, p<.01), alongside segment count (estimate=−1.274, SE=0.269, z=−4.745, p<.001). Model 4-Wells does not differ significantly from Model 3-Wells (chi-square chi=0.5219, df=1, p>.05), accepting Model 4-Wells for its relative simplicity. Since penultimate weight effects have not drawn close to significance in the first few modellings of dataset-Wells, its interaction with segment count and as a simple effect were, respectively, dropped in Models 5-Wells and 6-Wells. Both models retain as significant period (Model 5-Wells: estimate=0.218, SE=0.080, z=2.738, p<.01; Model 6-Wells: estimate=0.218, SE=0.079, z=2.767, p<.01) and segment count (Model 5-Wells: estimate=−1.393, SE=0.264, z=−5.272, p<.001; Model 6-Wells: estimate=−1.392, SE=0.252, z=−5.516, p<.001). Given non-significant differences between them, Model 5-Wells is accepted over Model 4-Wells (chi-square chi=1.9472, df=1, p>.05), and Model 6-Wells over Model 5-Wells (chi-square chi=1e-04, df=1, p>.05), with the simpler model accepted in each case. To see whether any significance of morphology as a simple effect might obtain, the interaction between morphology and segment count was dropped in Model 7-Wells, which has period (estimate=0.223, SE=0.082, z=2.720, p<.01) and segment count (estimate=−1.147, SE=0.274, z=−4.190, p<.001) as significant effects. Models 7-Wells and 6-Wells do not significantly differ (chi-square chi=2.6966, df=1, p>.05), accepting Model 7-Wells for its relative simplicity. Morphology was dropped from Model 7-Wells, to see if a better explanation of the data might obtain. The resultant model, however, is non-convergent, i.e. the model struggles to explain the data. This indicates that morphology, though non-significant, must be retained, accepting Model 7-Wells as most explanatory of dataset-Wells.
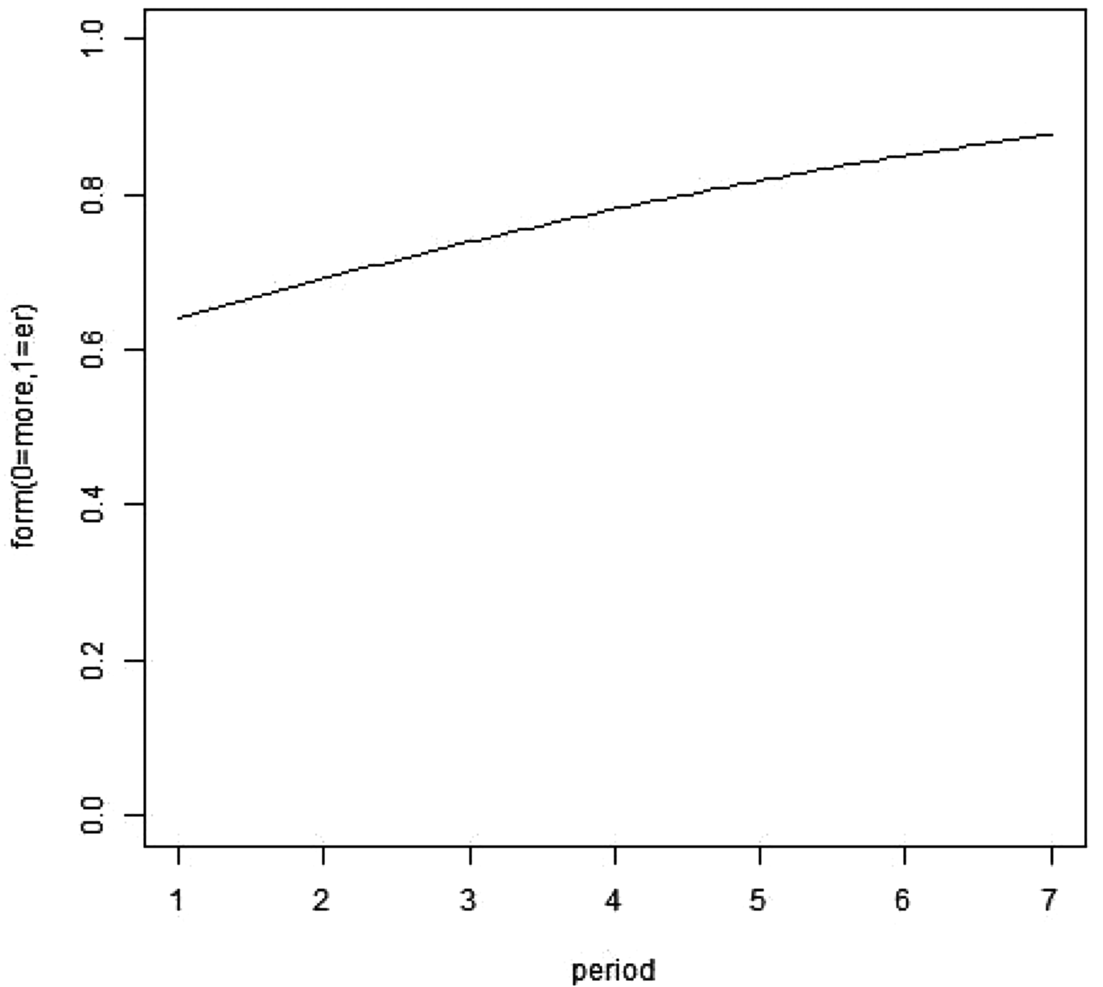
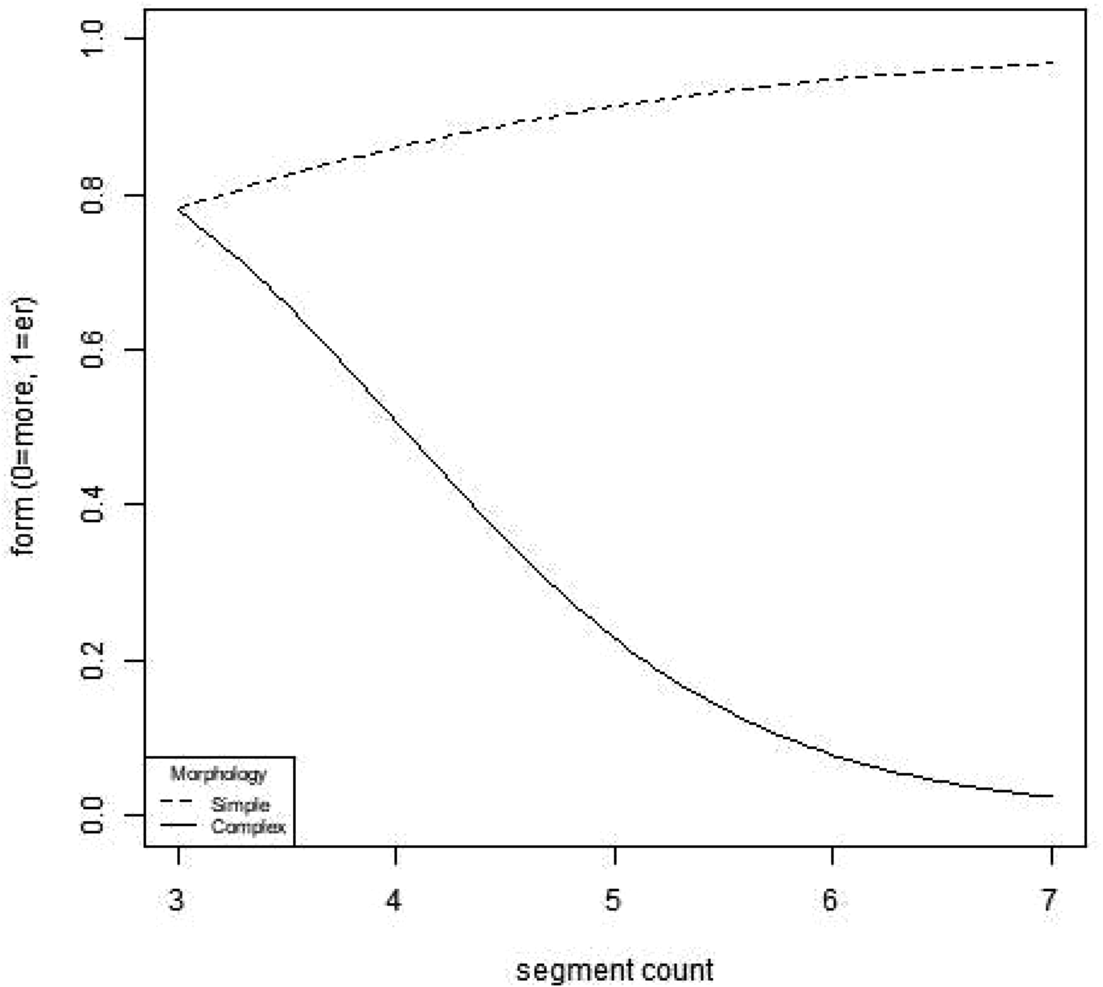
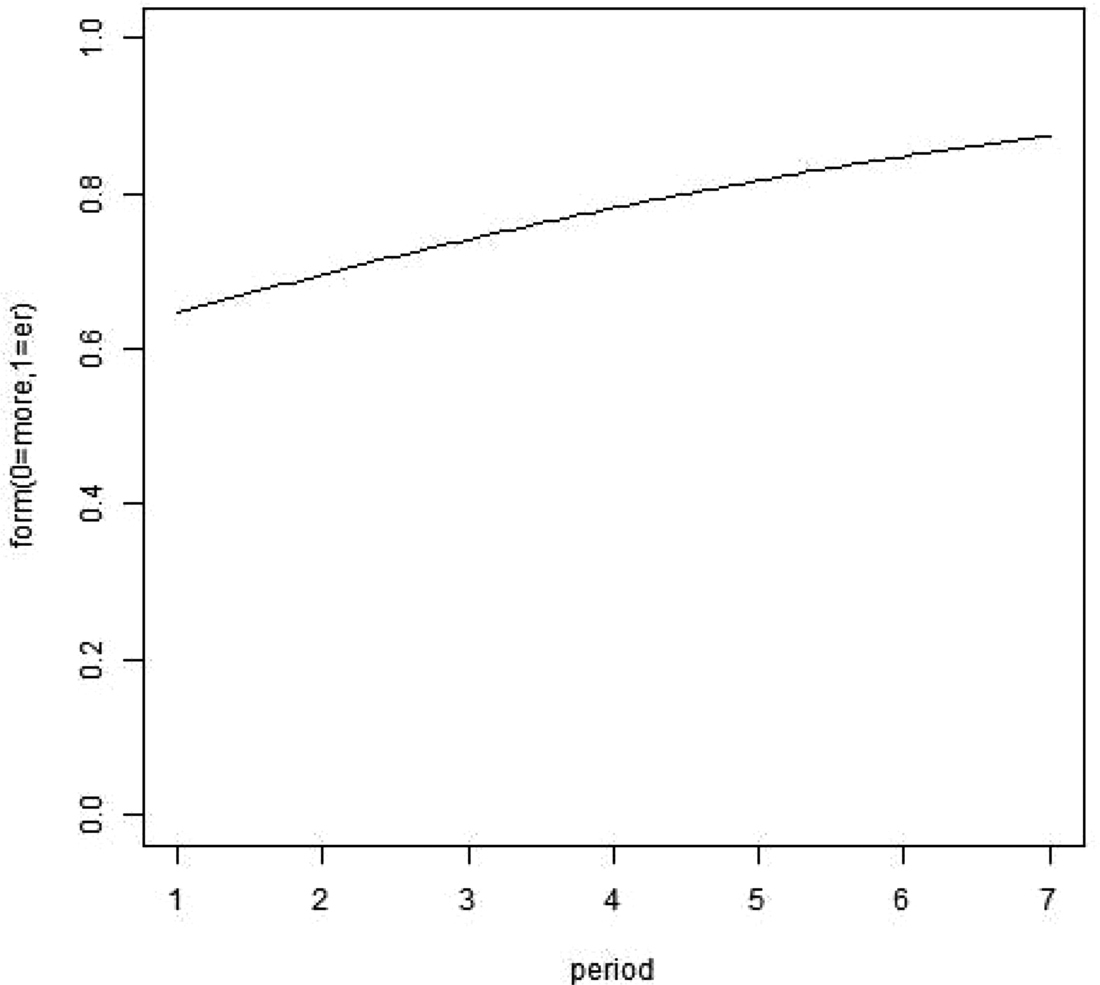
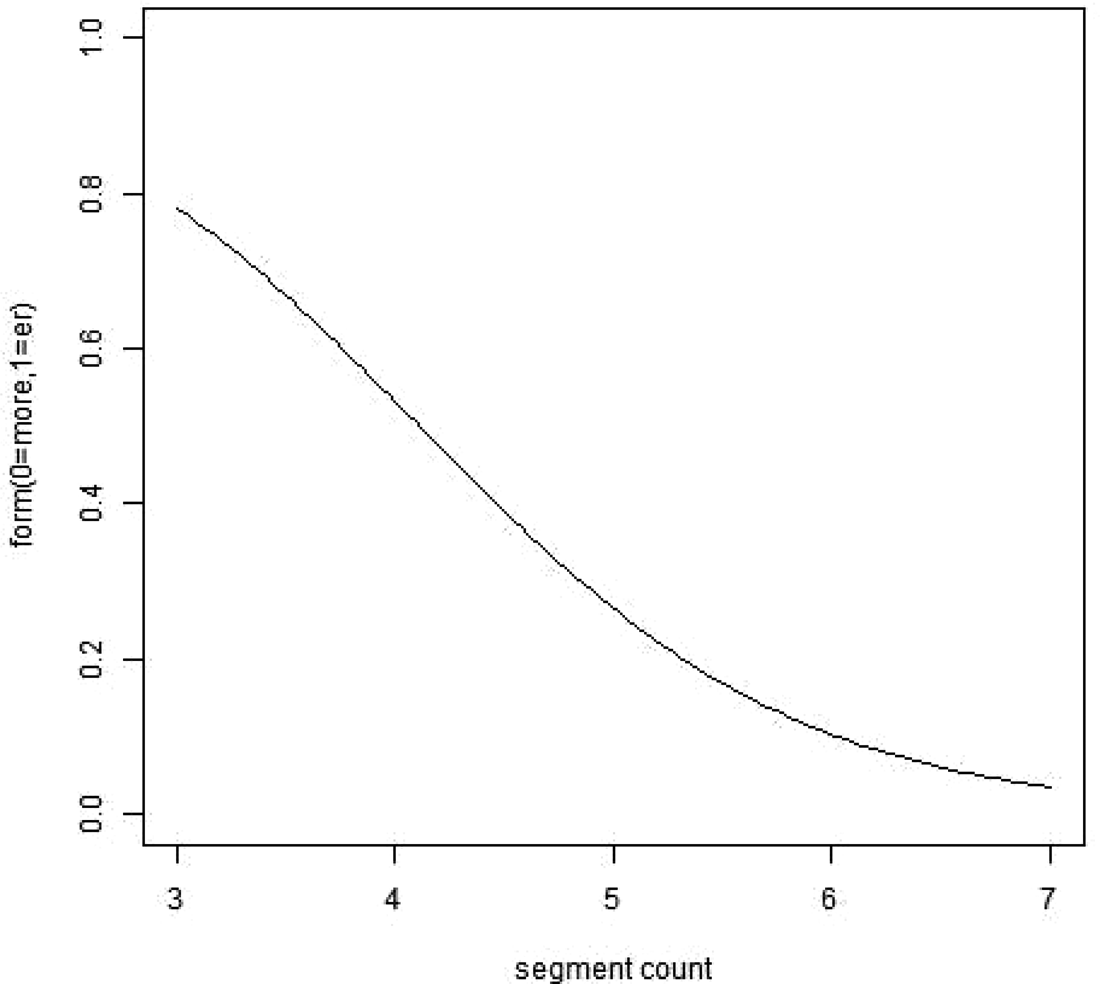
From the model accepted for dataset-MOP (Model 4-MOP), figures 1 and 2 plot, respectively, the significant effects of period (estimate=0.232, SE=0.081, z=2.852, p<.01), and the interaction between segment count and morphology (estimate=1.789, SE=0.867, z=2.063, p<.05). From the model accepted for dataset-Wells (Model 7-Wells), figures 3 and 4 plot, respectively, the significant effects each of period (estimate=0.223, SE=0.082, z=2.720, p<.01) and segment count (estimate=−1.147, SE=0.274, z=−4.190, p<.001).
Graph of the effect of period in Model 4-MOP, dataset-MOP
Notes: The spans in years represented by each period along the x-axis are as follows: period 1 (1601–50); period 2 (1651–1700); period 3 (1701–50); period 4 (1751–1800); period 5 (1801–50); period 6 (1851–1900); and period 7 (1901–50). Values along the y-axis approaching 1.0 indicate a comparative -er tendency, and those approaching 0.0, a comparative more tendency.

Graph of the interaction effect between segment count and morphology in Model 4-MOP, dataset-MOP
Notes: Segment counts exclude the final /i/ consistently found in y-adjectives. An example of a simple adjective is silly, and a complex one, lucky. Values along the y-axis approaching 1.0 indicate a comparative -er tendency, and those approaching 0.0, a comparative more tendency.

Graph of the effect of period in Model 7-Wells, dataset-Wells
Notes: The spans in years represented by each period along the x-axis are as follows: period 1 (1601–50); period 2 (1651–1700); period 3 (1701–50); period 4 (1751–1800); period 5 (1801–50); period 6 (1851–1900); and period 7 (1901–50). Values along the y-axis approaching 1.0 indicate a comparative -er tendency, and those approaching 0.0, a comparative more tendency.

Graph of the effect of segment count in Model 7-Wells, dataset-Wells
Notes: Segment counts exclude the final /i/ consistently found in y-adjectives. Values along the y-axis approaching 1.0 indicate a comparative -er tendency, and those approaching 0.0, a comparative more tendency.

Y-axis values approaching 1.0 in all figures indicate a comparative -er tendency, and those approaching 0.0, a comparative more tendency. Figures 1 and 3 therefore show a shift towards comparative -er from periods 1 to 7 for both datasets-MOP and -Wells.
For dataset-MOP, figure 2 shows that while for simple y-adjectives, an increase in segment count sees an increased comparative -er probability, for complex y-adjectives, an increase in segment count sees a decreased -er probability. Figure 2 also shows an increase in -er probability for simple y-adjectives as most apparent with segment count increases from 3 to 4, after which the trend begins to equilibrate with segment count increases from 4 to 7. With complex y-adjectives, a decrease in -er probability is sharpest with segment count increases from 3 to 5 and the decrease begins to equilibrate as segment count increases from 5 to 7. A gradient difference between the two lines in figure 2 suggests that for dataset-MOP, with an increase in segment count, the shift away from -er (presumably, towards more) is more apparent for complex y-adjectives than the shift towards -er for simple y-adjectives. This may in part be because both simple and complex y-adjectives with around 3 phonemic segments have a relatively high probability of an -er pairing, close to 0.8 (the point the two lines meet in figure 2). Any shift towards -er is therefore more constrained than a shift away from it.
For dataset-Wells, figure 4 shows segment count to independently predict comparative form with no implication of morphology. Though it is the case for all y-adjectives alike in dataset-Wells, the trend in figure 4 closely mirrors that of complex y-adjectives in dataset-MOP. That is, an increase in segment count sees a decreased comparative -er probability, where the decrease is sharpest with segment count increases from 3 to 5 and begins to equilibrate as segment count increases from 5 to 7.
6 Discussion
Datasets-MOP and -Wells differ in having penultimate weight informed by the maximal onset principle (MOP; Carr Reference Carr1999: 74; Schlüter Reference Schlüter and Minkova2009: 169) in the former, and by Wells’ (Reference Wells2002) syllabification conditions in the latter. The analyses of both datasets point to segment count effects on y-adjective comparatives. This is regardless of whether the effects are found independently, or in interaction with morphological complexity. Independently, an -er bias diminishes with an increased segment count of y-adjectives. Where it implicates morphology, an increased segment count sees more of an -er bias for simple y-adjectives and more of a more bias for complex y-adjectives. Segment count is studied because it aligns with previously studied factors such as syllable and morpheme count in attending to the volume of linguistic units to explain English comparative form choice (section 2). Hence, findings that segment count indeed explains this choice buttress the theory that comparative more and -er alternation rests, in part, on the volume of material constituting an adjective. In my case, this volume takes the form of the number of phonemic segments.
Where segment count consistently predicts y-adjective comparative forms across datasets-MOP and -Wells, a redefinition of base adjective length from syllable to segment count to advance an understanding of comparative alternation is empirically supported. Broadly speaking, this implies that whenever adjectival length proves insufficiently robust in predicting comparative forms, we may do well to examine whether our conception of this length has been exhausted before concluding that adjectival length per se is unhelpful for the predictions. The present article shows that adjectival length based on segment count is helpful in predicting y-adjective comparatives. On the other hand, the place of penultimate weight in accounts of y-adjective comparatives remains difficult to determine. Penultimate weight is not found to be a significant predictor in either the account accepted for dataset-MOP or dataset-Wells. However, to surface the significance of morphological effects, a consideration of penultimate weight had to be retained in the account accepted for dataset-MOP (table 5); in the account accepted for dataset-Wells (table 6), though, no consideration of penultimate weight had to be included. To recall, penultimate weight is analysed in the first instance because this weight is informed by, and thus recognises, the syllable unit where segment count does not (section 4). Where the role of penultimate weight remains difficult to pin down, the question that is then raised is what the role of the syllable unit is in understanding the comparatives of y-adjectives. This, together with the consistent finding of segment count in explaining y-adjective comparatives, reinforces the important point that where the syllable unit informs a default conception of adjectival length, a rethinking of this length in terms of phonemic segments is crucial to explain y-adjective comparatives, if not also, subject to further study, the comparatives of other English adjectival groups.
It is notable that any issue on the syllable unit that refers back to penultimate weight derives primarly from different syllabification principles – the MOP (Carr Reference Carr1999: 74; Schlüter Reference Schlüter and Minkova2009: 169) versus Wells (Reference Wells2002). This differentiation affects the way penultimate weight is scoped for coding and any consequent data analyses. Therefore, in the non-consistent demands between the accounts accepted for datasets-MOP and -Wells to keep in penultimate weight, what is apparent is the capacity of these accounts, taken together, to make manifest a non-congruence between different syllabification theories. Seeking a resolution to the non-congruence is not the goal here, though the downstream implications of this non-congruence are worthy of note. Datasets-MOP and -Wells differ only in the syllabification principles they draw upon to inform penultimate weight assessments. Hence, any discrepancy between them on the contribution of morphological complexity to explaining y-adjective comparatives may reasonably be linked to a differentiation in the syllabification principles applied to each dataset; specifically, the discrepant findings are in the significance of morphological effects (in interaction) in the model accepted for dataset-MOP, with no matching significance of these effects in the model accepted for dataset-Wells. Granted, the model accepted to explain dataset-MOP factors in previous support for morphological complexity in comparative form choice (section 5.3), without which the model accepted for dataset-MOP might not be unlike the one accepted for dataset-Wells, i.e. with no significant morphological effect. However, we may note that while morphological effects are significant in four models from dataset-MOP (table 5), in no model from dataset-Wells (table 6) are they significant. Given this and the fact that morphological boundaries potentially overlap with the syllable boundaries that inform penultimate weight, especially in dataset-Wells, it is fair to propose that the models accepted for datasets-MOP and -Wells may, between them, turn out discrepant findings on morphological effects because of upstream differences in subscribed syllabification theories.
Where they do contribute to data explanation, however, in dataset-MOP, morphological effects found advance prior understandings; the interaction of these effects with segment count in dataset-MOP (figure 2, section 5.3) adds granularity to our understanding of how morphological complexity predicts comparative forms. In no other work has segment count been infused into this prediction, such that where discrepancies arose between corpus and experimental data of independent morphological effects on y-adjective comparatives (Chua Reference Chua2016, Reference Chua2019), a suppression theory was instead proposed. The idea then was that a sufficiently high frequency of pre-experimental, real-world-derived, cognitive accumulation of more and -er patterns of comparative constructions could have suppressed any morphological effects that would otherwise surface (Chua Reference Chua2016: 177–8; Reference Chua2019: 397). However, the qualification of morphological effects by segment count in the model accepted for dataset-MOP in this work proposes that morphological effects on y-adjective comparatives may also be suppressible by base adjective segment count. Equilibria reached towards an -er bias for simple y-adjectives and away from this bias for complex y-adjectives, respectively, at 4 or more and 5 or more segments (figure 2, section 5.3), suggest that for y-adjectives, morphological effects on comparatives tend to be obvious only below certain segment count thresholds. Morphological effects are very subtle, in other words, when backgrounded against frequencies of patterned comparative constructions (Chua Reference Chua2016: 177–8; Reference Chua2019: 397), base adjective segment count and subscribed syllabification principles, the last given discrepant findings on the morphological factor between datasets-MOP and -Wells (see previous paragraph). The implication here of the claimed subtlety of morphological effects is that their non-consistent emergence in accounts of y-adjective comparatives does not necessarily mean the effects’ non-existence.
Indeed, previously clear morphological effects from the same corpus data used here (Chua Reference Chua2016: 115–16; Reference Chua2018: 482), when contrasted against their present elusiveness, may be evoked to support morphological subtlety in y-adjective comparative form predictions. It is possible that in previous relevant works (Chua Reference Chua2016, Reference Chua2018), other considered predictors exert relatively less influence on y-adjective comparatives, so that morphological effects, even if subtle, may independently surface. Presently, segment count could be influential in predicting comparative forms to the extent that morphological effects may no longer surface independently (in dataset-MOP) or significantly (in dataset-Wells). What is affirmed, though, is that where morphological effects are found, as in the model accepted for dataset-MOP, the direction of those effects coheres with previous accounts. A claimed bias for comparative -er in morphological simplexes (Leech & Culpeper Reference Leech and Culpeper1997: 355; Mondorf Reference Mondorf, Rohdenburg and Mondorf2003: 283; Hilpert Reference Hilpert2008: 407; Chua Reference Chua2018: 482) is reflected in figure 2 (section 5.3), where, for the most part, the dashed line (representing morphological simplexes) is visually closer to the value of 1.0 (representing an -er bias) than the solid line (representing morphological complexes).
Moving away from the morphological factor, what remains congruent across the models accepted for datasets-MOP and -Wells is a threshold beyond which segment count effects dilute. For complex y-adjectives in dataset-MOP (figure 2) and for all y-adjectives in dataset-Wells (figure 4), the shift away from a comparative -er bias is sharpest as segment count increases from 3 to 5, and this shift becomes more gradual with segment count increases from 5 to 7. Where segment count here is an indicator of adjectival length, indicated then is a quantifiable threshold beyond which adjectival length becomes less apparent in predicting y-adjective comparative forms. Lending support to this are reports of needed thresholds to surface the predictive effects of word length on linguistic outcomes (McGinnies et al. Reference McGinnies, Comer and Lacey1952: 69; New et al. Reference New, Ferrand, Pallier and Brysbaert2006: 48). That said, implicit notions of these thresholds might already exist for English comparative alternation, where word length constraints in predicting comparative forms are recognised through a study of several factors (Hilpert Reference Hilpert2008) alongside syllable count. What the present work importantly does is to secure a handle on these constraints by indicating, for y-adjectives, a quantifiable threshold beyond which word length effects on comparative forms begin to dissipate. The way in which this threshold manifests itself reinforces the value of phonemic segment count in advancing an understanding of comparative alternation. Especially for y-adjectives, where syllable count varies minimally and so offers little in granting access to word length thresholds that inform comparative form choices, segment count becomes a useful means of granting this access. This usefulness simultaneously highlights an importance of phonetic factors relative to phonological ones in predicting y-adjective comparatives. Unlike segment count (predominantly phonetic), penultimate weight (predominantly phonological) remains undetermined in the present work in contributing to an understanding of y-adjective comparatives. Indeed, the fuzziness of phonological factors in accounting for comparative forms is previously found as well in such other considerations as stress positioning (Chua Reference Chua2018: 461–2).
From the present work, the effect of period on y-adjective comparatives is also noteworthy. Found in both accepted models for datasets-MOP and -Wells is an independent biasing of y-adjectives towards -er with the passage of time, i.e. from the earliest period 1 to the most recent period 7 (figures 1 and 3). In data external to the ones here used, comparative -er stabilisation is likewise found for y-adjectives by the end of the twentiethth century – see Bauer (Reference Bauer1994: 58–9) and Mondorf (Reference Mondorf2009: 140). Although Bauer (Reference Bauer1994: 58–9) notes an exception to the -er bias for y-adjectives with a ‘suffix -ly’, these constitute less than a quarter of each of datasets-MOP and -Wells (41 of 253 tokens in each dataset), meaning that most of the y-adjectives in these datasets are indeed on their way towards -er stabilisation as they approach the start of the twentieth century in period 7 (representing the years 1901–50). Empirical support for this stabilisation in datasets-MOP and -Wells alike suggests that the accepted statistical models from these datasets that obtain period effects bear external validation in Bauer (Reference Bauer1994) and Mondorf (Reference Mondorf2009). Regardless then of any non-agreement between them on whether (and how) morphological complexity and penultimate weight impact y-adjective comparatives, the models accepted for datasets-MOP and -Wells may each be taken to reasonably explain comparative y-adjectives from a diachronic view.
In view of this, let us recap the account accepted for dataset-MOP, to examine its potential implication for our understanding of morphophonological processes. In this account, a statistical significance in morphological predictions of y-adjective comparatives requires a simultaneous consideration, within the account, of penultimate weight. What is here suggested seems to be the existence of a morphophonological intersection of some sort, where the English comparative form is the output. Conventionally, morphophonological processes realise a phonological response that occurs within the vicinity of morphological rule applications (Chomsky & Halle Reference Chomsky and Halle1968; Kiparsky Reference Kiparsky, van der Hulst and Smith1982; Mohanan Reference Mohanan1986; Inkelas Reference Inkelas, Goldsmith, Riggle and Yu2011). However, it is some distance from the demarcation between the penultimate and final syllables of y-adjectives where comparative forms show up, as periphrastic more or suffixal -er. Therefore, if there is indeed a morphological and penultimate weight intersection tantamount to a morphophonological process reflected in the account accepted for dataset-MOP, what is implied is that, in a diachronic context, the outcomes of morphophonological processes might well diffuse beyond the vicinity of these processes. How this diffusion may be operationalised is not yet known; it remains worth considering in future work and is subject to the syllable unit's stability in deriving comparative form outcomes.
Finally, if, at its core, this article highlights the importance of segment count for understanding y-adjective comparatives, then highlighted as well is the way English y-adjective comparatives may advance the English alternation scholarship. Coupled with findings that have shown character count to predict genitives (Ehret et al. Reference Ehret, Wolk and Szmrecsanyi2014: 276; Rosenbach Reference Rosenbach2014: 227), segment count predictions of y-adjective comparatives here suggest that word length indicated by units smaller than the syllable may be fundamental to understanding English alternations. The notion of shared tenets that hold across English alternations is not at odds with analogies drawn before across these alternations. A study on children's use of English comparatives has presented evidence supporting an analogy of these uses with children's use of English agentives on the common ground of engaging transparency and productivity principles (Chua Reference Chua and Cruz-Ferreira2010: 100–2). A contextualisation of genitive alternation within a general pattern (Wolk et al. Reference Wolk, Bresnan, Rosenbach and Szmrecsanyi2013) that applies also to dative alternation has analogised ‘animacy effects’ across genitive and dative constructions (Rosenbach Reference Rosenbach2014: 240–1). The proposal that English y-adjective comparatives and English genitives alike are predictable by units more fine-grained than the syllable thus adds on to existing studies that have surfaced shared tenets across English alternations. In so doing, the potential place of English y-adjective comparatives in advancing an understanding of English alternations should not be underestimated.
7 Conclusion
In conclusion, a key affirmation of this article is that phonemic segment count and the passage of time consistently predict y-adjective comparatives. Availed, additionally, is a quantifiable segment count threshold within which adjectival length remains important for the predictions. Though the morphological factor in predicting y-adjective comparatives remains less clear, where found, it coheres with prior notions of an -er bias with simplexes, and a more bias with complexes. The existence of the morphological factor seems, moreover, subject to syllabification principles that inform penultimate weight considerations in the analyses, positioning accounts of y-adjective comparatives, when taken together, as potential sites that make manifest non-congruences between syllabification theories. At least one of the accounts presented points, nonetheless, to potentially important insights for our understanding of morphophonological realisations. Turning out broad and varied implications, this article has indeed bitten off more than it can chew! At the heart of these implications are calls to consider our conception of adjectival length for accounts of English comparatives, to consider whether the syllable unit itself is sufficiently stable for these accounts, and to consider whether this stability eventually entails coming to terms with downstream implications of engaging different syllabification theories.