Youth is a time for forging a social identity as well as a particular period of vulnerability for the development of mental health problems (Cobigo, Ouellette, Lysaght, & Martin, 2012; Fowler et al., Reference Fowler, Hodgekins, Arena, Turner, Lower, Wheeler, Corlett and Wilson2010; Kessler et al., Reference Kessler, Amminger, Aguilar-Gaxiola, Alonso, Lee and Ustun2007). Social inclusion is a key goal in mental health treatment because social exclusion is associated with the persistence and exacerbation of mental health problems (Department of Health, 2011). However, social disability is observable before the onset of complex mental health problems (Fowler et al., Reference Fowler, Hodgekins, Arena, Turner, Lower, Wheeler, Corlett and Wilson2010), constituting a clear risk factor for development of such problems (Valmaggia et al., Reference Valmaggia, Stahl, Yung, Nelson, Fusar-Poli, McGorry and McGuire2013). In the general population, social inclusion is associated with greater psychological and physiological health and well-being, yet research has tended to focus on social exclusion and exclusively within vulnerable groups (Begen & Turner-Cobb, Reference Begen and Turner-Cobb2014; Spandler, Reference Spandler2007). Thus, little is known about “what” or “how much” social inclusion might be considered normative, despite its positioning as an important and supposedly achievable goal in mental health interventions (Spandler, Reference Spandler2007). An empirical study of the model of social inclusion that is applicable to both clinical and nonclinical populations of young people is needed. It is important to understand what “normative” social inclusion looks like in a broad healthy population, in which mental health is considered a continuum, before subsequently testing its variation and applicability with people who have been given clinical diagnoses. This is in keeping with the recent paradigm shift in mental health services to focus on health and well-being as meaningful to all people, rather than studying “illness” and disability within select groups (Slade, Reference Slade2010; Wood & Tarrier, Reference Wood and Tarrier2010).
The Structure of Social Inclusion
Measurement of social inclusion is hampered by multiple definitions and a lack of empirical investigation (Cobigo et al., Reference Cobigo, Ouellette-Kuntz, Lysaght and Martin2012; Hall, Reference Hall2009; Lloyd, Tse, & Deane, Reference Lloyd, Tse and Deane2006; Morgan, Burns, Fitzpatrick, Pinford, & Priebe, Reference Priebe2007). The concept overlaps with constructs such as community integration and social functioning (Priebe, Reference Priebe2007; Wellman & Berkowitz, Reference Wellman and Berkowitz1988; Wong & Solomon, Reference Wong and Solomon2002), but extends them, encapsulating objective and subjective indices across social, vocational, and occupational domains (Hall, Reference Hall2009; Parr, Philo, & Burns, Reference Parr, Philo and Burns2004; Sayce, Reference Sayce2001). Reliance on both objective and subjective indices is the key strength of social inclusion: the former easier to interpret and persuade policymakers, the latter potentially more changeable, less value laden, more sensitive to individual experiences and aspirations (Corrigan & Buican, Reference Corrigan and Buican1995; Priebe, Reference Priebe2007; Spandler, Reference Spandler2007). Furthermore, increased objective activity without associated positive subjective experience may actually decrease well-being (Corrigan & Buican, Reference Corrigan and Buican1995; Hall, 2010).
Suggested candidate objective indicators reflect the presence or absence of social networks and social, cultural, and leisure activities (Cobigo et al., Reference Cobigo, Ouellette-Kuntz, Lysaght and Martin2012; Hall, Reference Hall2009; Martin & Cobigo, Reference Martin and Cobigo2011; Morgan et al., Reference Morgan, Burns, Fitzpatrick, Pinfold and Priebe2007). Suggested subjective indicators focus on a sense of belonging, perceiving that one fits in with and is valued by others and that relationships are mutual and reciprocal (Hagerty, Williams, Coyne, & Early, Reference Hagerty, Williams, Coyne and Early1996; Mahar, Cobigo, & Stuart, Reference Mahar, Cobigo and Stuart2013; Norman, Windell, Lynch, & Manchanda, Reference Norman, Windell, Lynch and Manchanda2012). Active objective political participation is not necessarily a normative youth activity per se (Harris, Reference Harris2010; Tonge, Mycock, & Jeffrey, Reference Tonge, Mycock and Jeffery2012), but feeling one's political beliefs are listened to promotes subjective belonging (Harris, Reference Harris2010).
Paid employment, often cited as the key indicator of social inclusion, inadequately reflects the contributions of young people to society within current high youth unemployment and complex transitions post-age 16 (Bynner, Reference Bynner2005; Hall, Reference Hall2009; Harris, Reference Harris2010; Smith, Lister, Middleton, & Cox, Reference Smith, Lister, Middleton and Cox2005), and especially so for vulnerable people who may not all be able or desire to engage in paid work (Priebe, Reference Priebe2007). A broader conceptualization of occupation including education, leisure, and cultural activities may better capture the occupational domain of young people's social inclusion (Harris et al., 2008). The current study is the first known exploration of how such indicators of social inclusion cluster together.
Predictors of Social Inclusion
While we acknowledge structural impediments to social inclusion such as economic instability (Sayce, Reference Sayce2001), locating social inclusion fully within a “barriers” approach may perpetuate exclusion by locating causes within unchangeable systems (Levitas, Reference Levitas1998). An individual capacities approach can help to identify potential targets on which to focus interventions. Our approach follows the premise that beliefs about oneself influence activities, behaviors, and relationships (Safran & Segal, Reference Safran and Segal1996; Saltzberg & Dattilio, Reference Saltzberg and Dattilio1996), and focuses especially on hope theory (Snyder, Reference Snyder2002) and cognitive theory (Beck, Rector, Stolar, & Grant, Reference Beck, Rector, Stolar and Grant2009) in keeping with an equal weighting to both “positive” and “negative” characteristics in functioning (Wood & Tarrier, Reference Wood and Tarrier2010).
Hopefulness
Hope theory (Snyder, Reference Snyder2002) suggests that what people hope and expect to come influences their behavior. Hope is “a cognitive set that is based on a reciprocally-derived sense of successful agency (goal-directed determination) and pathways (planning to meet goals)” (Snyder, Irving, & Anderson, Reference Snyder, Irving, Anderson, Snyder and Donelson1991, p. 571). Agency, the motivation and belief in one's ability to attain goals, sparks the identification of pathways, with both components mutually reinforcing during ongoing goal pursuit (Snyder, Reference Snyder2002). Goals are essential to hope and must be sufficiently valuable to occupy an individual's thoughts without being unquestionably obtainable (Snyder, Reference Snyder2002).
Global trait hope predicts outcomes for young people including academic and athletic attainment (Marques, Lopez, Fontaqine, Coimbra, & Mitchell, Reference Marques, Lopez, Fontaine, Coimbra and Mitchell2015). However, the more concrete domain-specific hope should greater predict activity and experience in associated life domains and may be particularly amenable to intervention (Snyder, Reference Snyder2002). Domain-specific hope correlates with academic, athletic, social, leisure, and family life attainment and satisfaction in healthy young people (Kwon, Reference Kwon2002; Robinson & Schumacker, Reference Robinson and Schumacker2009; Snyder, Reference Snyder2002). However, previous studies have prioritized nonsocial and objective outcomes (Gilman, Dooley, & Florell, Reference Gilman, Dooley and Florell2006), and no know studies have focused on social inclusion.
Dysfunctional attitudes
Two types of dysfunctional attitudes were first identified in Beck Epstein, and Harrison's (1983) account of cognitive vulnerabilities to depression: “defeatist performance” beliefs reflecting exaggerated concern with performance and “need for approval” beliefs reflecting exaggerated concern with others’ approval. Reportedly, dysfunctional attitudes undermine self-worth and increase sensitivity to adverse life events, leading to withdrawal from tasks and effortful activities for protection against anticipated failure and criticism (Beck et al., Reference Beck, Epstein and Harrison1983, Reference Beck, Rector, Stolar and Grant2009). Dysfunctional attitudes are fairly stable (Vázquez & Ring, Reference Vázquez and Ring1993) but can change during psychological intervention (Rector, Reference Rector and Steel2013).
Dysfunctional attitudes predict social and occupational functioning in psychosis and are thought to mediate the impact of negative symptoms in long-term, short-term, and at risk for psychosis populations (Beck & Rector, Reference Beck and Rector2005; Beck et al., Reference Beck, Rector, Stolar and Grant2009; Morrison et al., Reference Morrison, French, Lewis, Roberts, Raja, Neil and Bentall2006). For adolescents and young adults without mental health problems, dysfunctional attitudes are cross-sectionally associated with lower perceived social support, greater loneliness (Halamandaris & Power, Reference Halamandaris and Power1997; Wilbert & Rupert, Reference Wilbert and Rupert1986), increased likelihood of interpersonal problems (Whisman & Friedman, Reference Whisman and Friedman1998), reduced quality of life (Long & Hayes, Reference Long and Hayes2014), university adjustment, and well-being (Halamandaris & Power, Reference Halamandaris and Power1997). However, analyses have not tended to control for mood, despite dysfunctional attitudes representing vulnerability to low mood and depression (Beck et al., Reference Beck, Epstein and Harrison1983). Furthermore, no known exploration of associations with social inclusion exists. The “broaden and build” model suggests that while negative thoughts and emotions encourage narrowly focused “survival” behaviors, such as withdrawal in the context of dysfunctional attitudes, strengths such as hope promote novel positive behavioral strategies and distract individual from these negative thoughts (Compton, Reference Compton2005; Fredrickson, Reference Fredrickson1998; Renner, Schwarz, Peters, & Huibers, Reference Renner, Schwarz, Peters and Huibers2013).
A developmental lens
Developing a social identity and negotiating new activities in the social world are key developmental tasks, and aging provides different opportunities for interactions and activities (Cobigo et al., Reference Cobigo, Ouellette-Kuntz, Lysaght and Martin2012). There is little agreement regarding what “developmentally appropriate” health and social care looks like and how it should be operationalized (Farre et al., Reference Farre, Wood, Rapley, Parr, Reape and McDonagh2015), yet in youth, vulnerability to social exclusion and mental health problems is high and interventions conducted sensitively at relevant turning points can have a particularly effective and long-lasting impact (Cohen Kadosh, Linden, & Lau, Reference Cohen Kadosh, Linden and Lau2013; Fowler et al., Reference Fowler, Hodgekins, Howells, Millward, Ivins, Taylor and Macmillan2009; Mahar et al., Reference Mahar, Cobigo and Stuart2013). Thus, there is a clear need to consider social inclusion within a developmental context (Cobigo et al., Reference Cobigo, Ouellette-Kuntz, Lysaght and Martin2012; Martin & Cobigo, Reference Martin and Cobigo2011; Priebe, Reference Priebe2007).
Processes of identity forming and understanding the self in relation to friends, family, and romantic partners are key developmental trajectories in adolescence (Hill et al., Reference Hill, Allemand, Grob, Peng, Morgenthaler and Käppler2013). Socializing and friendships represent particularly important goals for adolescents, with occupation and community involvement more paramount for young adults (Hartup & Stevens, Reference Hartup and Stevens1997; Iarocci, Yager, Rombough, & McLaughlin, Reference Iarocci, Yager, Rombough and McLaughlin2008; Steinberg & Morris, Reference Steinberg and Morris2001). Objective social activities and network sizes increase through adolescence then decline in young adulthood, perhaps as people learn to derive equal subjective benefit from fewer interactions (Carstensen, Reference Carstensen and Schaie1991; Wrzus, Hänel, Wagner, & Neyer, Reference Wrzus, Hänel, Wagner and Neyer2013).
Dysfunctional attitudes are thought to influence behaviors more when people reach cognitive maturity (i.e., early adulthood; D'Alessandro & Burton, Reference D'Alessandro and Burton2006), suggesting that a stronger association with social inclusion would be present in young adulthood compared to adolescence. It has been suggested that high hope arises in secure childhood attachments to caregivers (Snyder, Reference Snyder2002), yet developmental changes in the course and impact of hope is unclear (Esteves et al., Reference Esteves, Scoloveno, Mahat, Yarcheski and Scoloveno2013). Younger people may be more confident in their abilities (Schunk & Meece, Reference Schunk, Meece, Pajares and Urdan2006) and thus have increased agency, yet adults arguably benefit from more experience in goal pursuit (Freund, Hennecke, & Riediger, Reference Freund, Hennecke and Riediger2010). Thus, we made no a priori prediction regarding the nature of age differences in associations between hopefulness and social inclusion.
Gender and ethnicity are also potentially important covariates, although again no a priori hypotheses were made. Females report closer relationships, provision of more social support (Belle, Reference Belle, Barnett, Biener and Baruch1987), and greater community participation (Bruegel, Reference Bruegel and Franklin2005; Lowndes, Reference Lowndes2000). People identifying with a minority ethnic group may have reduced objective indices of inclusion (Campbell & McLean, Reference Campbell and McLean2003; McPherson, Reference McPherson1999), but experience increased subjective social inclusion within distinct ethnic communities (Campbell & McLean, Reference Campbell and McLean2003).
Hypotheses
We hypotheszsed that social inclusion would be denoted by (a) objective participation in social networks and activities, (b) subjective experience of social acceptance and relationship reciprocity, (c) objective participation in occupational (cultural and leisure) activities, and (d) subjective sense of belonging, including valued occupation and political inclusion. We hypothesized that domain-specific hopefulness (social, romantic, leisure, work, academic, and family) and dysfunctional attitudes would predict social inclusion in related domains, and that greater domain-specific hopefulness would protect against negative associations between dysfunctional attitudes and social inclusion. We also hypothesized that social and objective domains of inclusion would be more pronounced in adolescence and occupational and subjective social inclusion domains more pronounced in young adulthood, and dysfunctional attitudes would be more strongly associated with social inclusion in young adulthood compared to adolescence.
Methods
Sample size
Power is not readily computable for complex exploratory modeling as is the present focus (Thoemmes, MacKinnon, & Reiser, Reference Thoemmes, MacKinnon and Reiser2010); thus, sample size heuristics were consulted. Heuristics recommend 300 cases for factor analytic modeling (Comrey & Lee, Reference Comrey and Lee1992; Kahn, Reference Kahn2006) and ≥5:1 cases per free model parameter for path modeling more generally (Bentler & Chou, Reference Bentler and Chou1987; Tanaka, Reference Tanaka1987). Thus, a target minimum sample size was set at 300, with an additional criterion of testing models with at least 5:1 cases to free parameters.
Procedure
Measures were administered via an anonymous cross-sectional online questionnaire using Bristol Online Survey software (http://www.survey.bris.ac.uk). A convenience sample of young people was recruited from university and National Health Service staff and students in the South of England; social media including Facebook, Netlog, The Student Room, Jobseekers Advice Forum, Football.co.uk Forum, Teen Forum and Habbox; and survey websites including Psych Hanover Psychological Research on the Net, Online Psychology Research, and the Social Psychology Network. Ethical approval for the research was provided by the university research ethics committee (KGCB0511). Participants provided informed consent by responding affirmatively to a consent item and submitting the questionnaire. No personal data were requested or obtained as part of the questionnaire.
Participants
Participants were aged 14 to 36 years, with residence of the United Kingdom or the Republic of Ireland, and no current mental health problems. The final sample (N = 387), 238 (61.5%) females, 139 (35.9%) males, 6 (1.6%) nonresponses, and 4 (1.0%) trans or other gender, was aged from 14 to 36 years (M age = 20.83, SD = 4.49) and described their ethnicity as follows: 298 (77.0%) White British; 25 (6.5%) White other; 20 (5.2%) British Indian, Pakistani, or Bangladeshi; 15 (3.9%) unknown; 14 (3.6%) Black British; 7 (1.8%) mixed; 3 (0.7%) African; 3 (0.7%) Asian; and 2 (0.5%) Chinese, with 341 (88.1%) born in the United Kingdom, 44 (11.4%) not, and 2 (0.5%) unknown. Almost all participants (95.9%) were engaged in vocational activity; 33.33% (n = 129) were in education only; 21.44% (n = 83) were in paid employment only; and 41.10% (n = 159) in a combination of employment and education.
A total of 619 people started the online questionnaire and the following exclusions made; 9 did not meet inclusion criteria, 6 gave wholly invalid or incongruous responses, 70 reported current mental health problems, and 147 provided demographic information only. Of these 147, the age range was very comparable to the final sample (range = 15–33 years, M age = 19.66, SD = 3.83). Gender was reported by 66 of these people, with 33 (50%) male, 32 (48.5%) female, and 1 (1.5%) trans or other. Ethnicity was reported by 69 people, with 46 (66.7%) White British; 9 (13.0%) White other; 6 (8.7%) British Indian, Pakistani, or Bangladeshi; 5 (7.2%) Black British; 2 (2.9%) mixed; and 1 (1.4%) Chinese, with 55 (72.4%) born in the United Kingdom, 21 (27.6%) not, and 71 nonresponses. Where present, demographic details of those people not completing the questionnaire are comparable to those of the final sample.
Measures
Social inclusion
Objective social and occupational activity
The Social Relationship Scale (McFarlane, Neale, Norman, Roy, & Streiner, Reference McFarlane, Neale, Norman, Roy and Streiner1981) was used to capture objective indicators of the size and reciprocity of individuals’ social networks across social (home and family, personal and social), occupational, and other life areas (work, money and finances, issues relating to society, and personal health). Participants listed people with whom they would discuss each life area (size) and whether these people would also discuss this area with them (reciprocity).
As studies suggest, healthy young people have social networks of at least 10–20 people (Macdonald, Hayes, & Baglioni, Reference Macdonald, Hayes and Baglioni2000) but often mention the same person in multiple areas (McFarlane et al., Reference McFarlane, Neale, Norman, Roy and Streiner1981); the cap of number of people spoken to in each life area was raised to ≤17 from the original 6. Participants were also asked to report the proportion of reciprocal relationships, that is, scoring “How many of these people would talk to you about the same life area?” from 1 (none of them) to 5 (all of them). Two variables were derived: (a) the number of relationships and (b) proportion of reciprocal relationships in each area, with higher scores reflecting greater social network size and reciprocity, respectively.
Subjective social and occupational experience
Indicators of social and cultural activity, valued occupation, political inclusion, and social acceptance were captured using the Social Inclusion Measure (SIM; Secker, Hacking, Kent, Shenton, & Spandler, Reference Secker, Hacking, Kent, Shenton and Spandler2009). Items such as “I have felt accepted by my friends” are rated for the preceding month from 1 (not at all) to 4 (yes, definitely). This 16-item measure was developed with people with serious mental health problems and amended to ensure equal applicability to the normative “healthy” population. Three SIM items referring explicitly to mental health problems or services, for example, “I have been involved in a group, club or organization that is not just for people who use mental health services,” were amended. Instead, participants responded in reference to the group they felt most strongly defines them (e.g., ethnicity and vocational status), thus assessing inclusion within other sub/cultures than that of their primary identification.
Hopefulness
Hope across life areas thought relevant to social inclusion (academic, work, social, family, romantic, and leisure) was captured using the Domain-Specific Hope Scale (DSHS; Sympson, Reference Sympson1999). Participants respond to eight items in each of six life areas, for example, “I can always get a date if I set my mind to it” (romantic hope), from 1 (definitely false) to 8 (definitely true). The DSHS achieved excellent internal reliability for healthy young people; overall α = 0.93 and subscales ranging from 0.86 to 0.93 (Sympson, Reference Sympson1999). Higher scores reflect greater hopefulness.
Dysfunctional attitudes
Negative self-beliefs were measured using the Dysfunctional Attitudes Scale (Weissman & Beck, Reference Weissman and Beck1978). Dysfunctional attitudes, for example, “If you cannot do something well, there is little point in doing it at all,” scored from 1 (totally agree) to 7 (totally disagree). The defeatist performance beliefs (occupational) and the need for approval (social) subscales have been found reliable with healthy young people (de Graaf, Roelofs, & Huibers, Reference de Graaf, Roelofs and Huibers2009; Horan et al., Reference Horan, Rassovsky, Kern, Lee, Wynn and Green2010), although one study suggested some subscale overlap (Prenoveau et al., Reference Prenoveau, Zinbarg, Craske, Mineka, Griffith and Rose2009). Higher scores reflect greater dysfunctional attitudes.
Mood
Mood was measured using a global item (Abdel-Khalek, Reference Abdel-Khalek2006); “Do you feel happy in general?” scored from 0 (very unhappy) to 10 (very happy). This item has high test–retest reliability over 1 week with young people (r = .86; Abdel-Khalek, Reference Abdel-Khalek2006) and has been used to capture mood in both healthy and clinical populations (Badcock, Paulik, & Maybery, Reference Badcock, Paulik and Maybery2011; Brown, West, Loverich, & Biegel, Reference Brown, West, Loverich and Biegel2011). This item correlates strongly and positively with multiple item happiness measures and strongly and negatively with negative affect and anxiety (Abdel-Khalek, Reference Abdel-Khalek2006).
Demographics
Self-reported age, gender, ethnicity, and place of birth were also recorded.
Analysis
Data analysis was conducted in PASW (Version 20, IBM Corp., 2011) and Mplus (Version 6.0; Muthén & Muthén, Reference Finney, DiStefano, Hancock and Mueller1998–2010). Factor analysis and structural equation modeling allow our hypotheses to be tested in a series of linked analyses. First, the multidimensional structure of social inclusion in a normative population, that is, the extent to which designated indicators of social inclusion “hang together” (Cronbach & Meehl, Reference Cronbach and Meehl1955), was explored through factor analysis leading to a social inclusion measurement model. Using the factor model of social inclusion, covariates, predictors of social inclusion, and invariance of associations across age groups were then tested using structural equation modeling (Gregorich, Reference Gregorich2006; Horn & McArdle, Reference Horn and McArdle1992). The structure of dysfunctional attitudes and domain-specific hopefulness were first explored and tested before inclusion in structural equation modeling. Good model fit was indicated by nonsignificant chi-square statistic (χ2) or χ2/degrees of freedom ratio of ≤2:1, root mean square error of approximation (RMSEA) < 0.06, standard root mean square residual (SRMR) < 0.05, and comparative fit index (CFI) > 0.95, and examining scree plots, interitem correlations and Cronbach α (Hu & Bentler, Reference Hu and Bentler1999; Schreiber, Nora, Stage, Barlow, & King, Reference Schreiber, Nora, Stage, Barlow and King2006; Tabachnick & Fidell, Reference Tabachnick and Fidell2007).
Although people self-reporting current mental health problems were excluded to support first testing a “normative” social inclusion model, 72 participants self-reported a previous mental health problem and 68 stated “not sure.” These participants were included in order to represent a broad healthy population continuum. Post hoc invariance testing was performed to confirm that the inclusion of these participants was appropriate. It was found that the measurement model was equivalent, and thus findings from the full sample of 387 participants are presented here. Self-reporting a previous or possible mental health problem is not equivalent to a clinical diagnosis, and inclusion of people who have or do experience some form of mental distress actually best represents the general population (Moffitt et al., Reference Moffitt, Caspi, Taylor, Kokaua, Milne, Polanczyk and Poulton2010).
Results
Social inclusion measurement model development
Missing values were observed for most variables ranging from 1% to 17% missing. Missing values analysis revealed no substantial patterns in missing data in relation to any demographic or study variables with two exceptions. More missing values were observed for items appearing later in the online questionnaire, deemed due to fatigue, and for participants not born in the United Kingdom or Republic of Ireland, deemed due to incomprehension or early exit due to eligibility concerns. Within measures, case-by-case mean substitution was used with missing data of ≤25% to preserve present information (Little & Rubin, Reference Little and Rubin1987; Schafer & Graham, Reference Schafer and Graham2002). Between variables, missing data was handled using full information likelihood estimation, which computes parameters using all present data and the implied missing data based on maximum likelihood (Johnson & Young, Reference Johnson and Young2011). The majority of the study variables were positively skewed and nonnormal, requiring mean and variance adjusted weighted least squares (WLSMV) estimation with categorical variables and multiple linear regression with continuous variables (Finney & DiStefano, Reference Finney, DiStefano, Hancock and Mueller2006; Muthén & Muthén, Reference Muthén and Muthén1998–2010).
First, structures within each social inclusion measure were explored using individual exploratory factor analyses (EFAs). Using WLSMV estimation, EFA of the Social Relationship Scale (McFarlane et al., Reference McFarlane, Neale, Norman, Roy and Streiner1981; 12 items) resulted in a three-factor solution according to the scree plot and model fit indices. The third factor comprised only lower magnitude cross-loading items, with the first two factors comprising all network size and reciprocity items, respectively. Therefore, a two-factor solution, although subthreshold in fit, χ2 (43) = 195.93, p <. 001, CFI = 0.89, RMSEA = 0.11, was selected as preferable conceptually. Cronbach α for these two derived subscales was acceptable: social network size α = 0.73 and social network reciprocity α = 0.71 (with removal of money reciprocity).
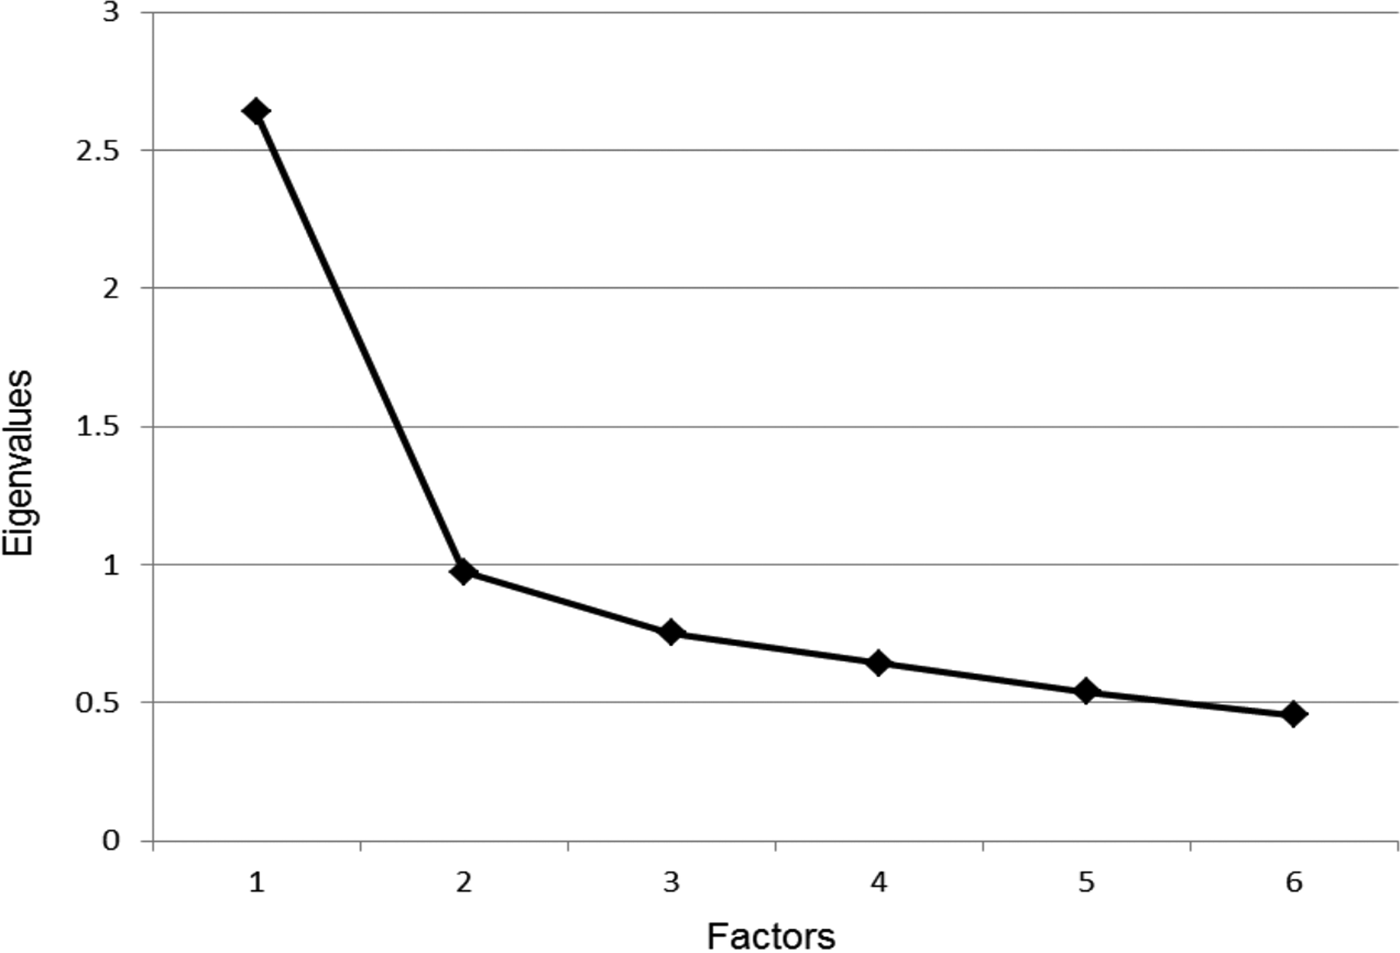
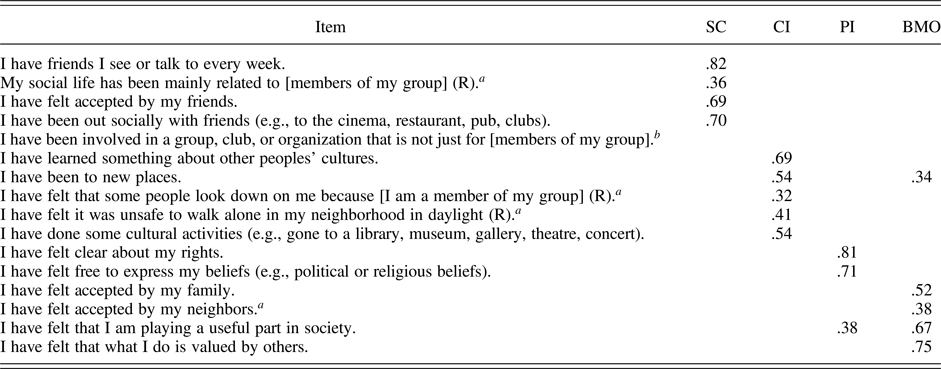
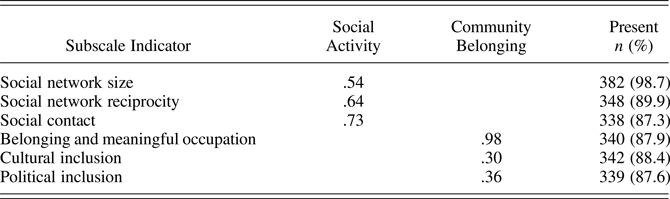
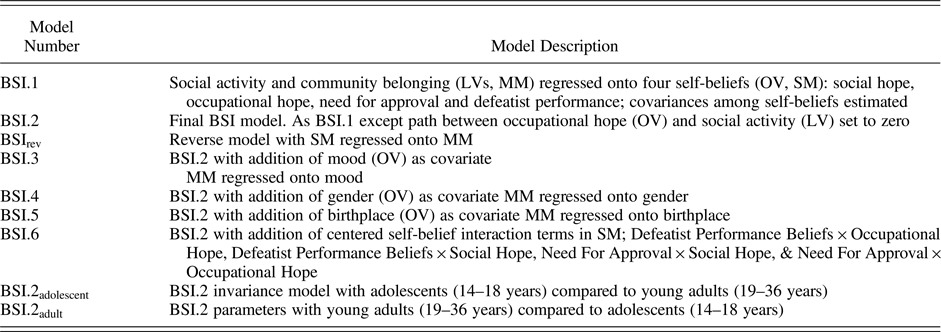
An EFA of the SIM (Secker et al., Reference Secker, Hacking, Kent, Shenton and Spandler2009; 16 items) using WLSMV estimation resulted in a four-factor solution instead of the three conceptually derived subscales proposed by the authors. Despite a significant χ2 goodness of fit test, χ2 (62) = 124.06, p < .001, alternative model fit indices were excellent, χ2/df ratio = 2.00, CFI = 0.98, RMSEA = 0.05, SRMR = 0.04, and the scree plot suggested four factors. The four factors were deemed to represent social contact, cultural inclusion, political inclusion, and belonging and meaningful occupation (Table 1). Two items had cross-loadings greater than 0.3 (“I have been to new places” and “I have felt that I am playing a useful part in society”), but were restricted to the factor with the higher loading for greater parsimony. The item “I have been involved in a group, club, or organization that is not just for [members of my group]” did not load >0.3 on any factor and was excluded. Consideration of Cronbach α led to the removal of four further items to improve the internal reliability (Table 1), resulting in final Cronbach α = 0.80 for social contact, α = 0.66 for cultural inclusion, α = 0.72 for political inclusion, and α = 0.75 for belonging and meaningful occupation. An EFA of the six social inclusion indicators (social network size and reciprocity, social contact, cultural inclusion, political inclusion, and belonging and meaningful occupation) using maximum likelihood robust estimation suggested two factors, with a clear “break” in the scree plot (Figure 1) and excellent fit indices: χ2 (4) = 4.40, p = .35, CFI = 1.00, RMSEA = 0.02, SRMR = 0.02, with no cross-loadings >0.3. The two-factor structure (Table 2) represents social inclusion as comprising one more objective, socially focused factor (“social activity”) and one more subjective, occupational, and community-focused factor (“community belonging”).
Scree plot showing factor eigenvalues for social inclusion indicators.

Exploratory factor loadings (>.3) for individual Social Inclusion Measure items

Note: Items are adapted from the Social Inclusion Measure (Secker et al., Reference Secker, Hacking, Kent, Shenton and Spandler2009). SC, social contact; CI, cultural inclusion; PI, political inclusion; BMO, belonging and meaningful occupation; (R), reverse-scored item.
aItems were removed from derived subscales to improve internal reliability.
bThe item did not load onto any factor >.3.
Exploratory factor loadings (>.3) for social inclusion two factor solution

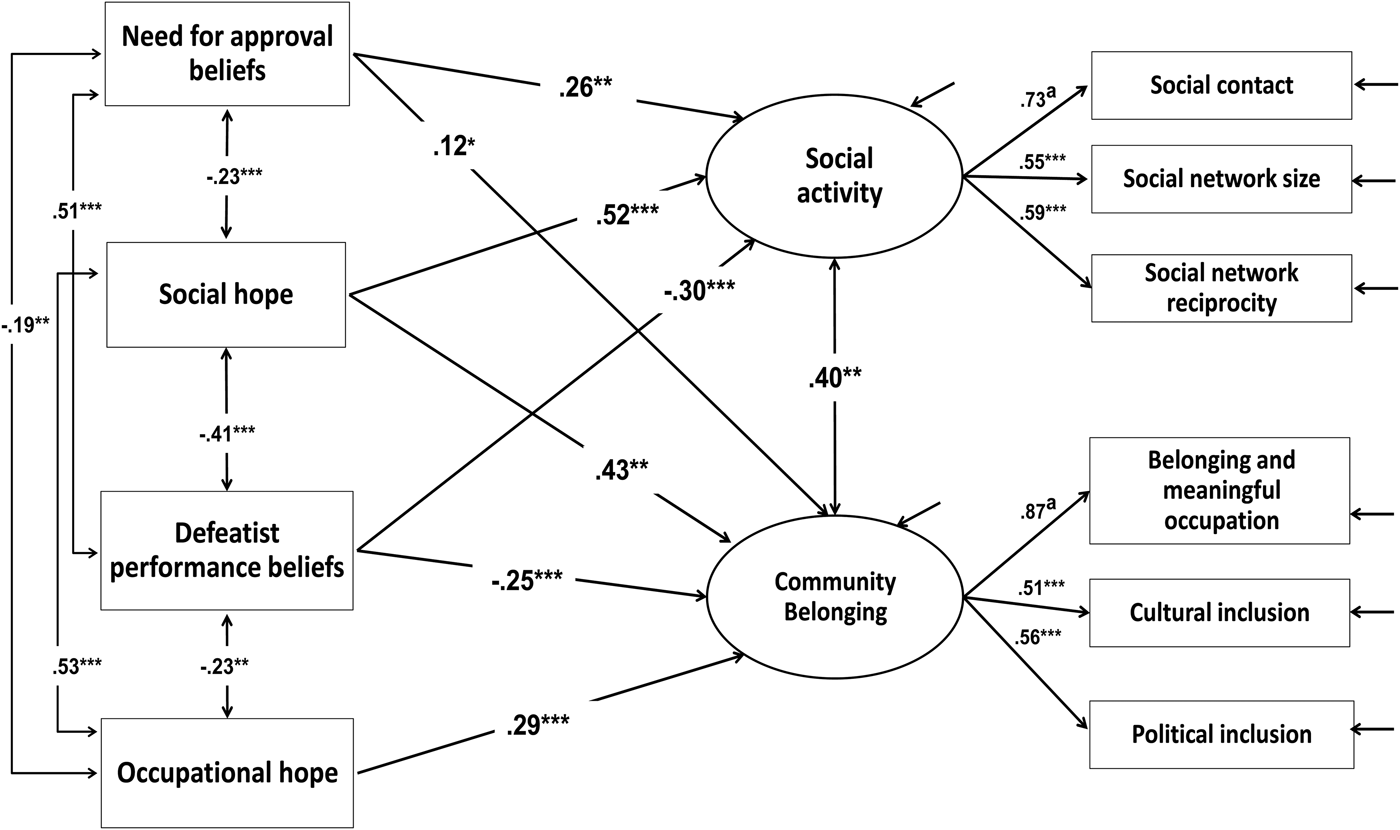
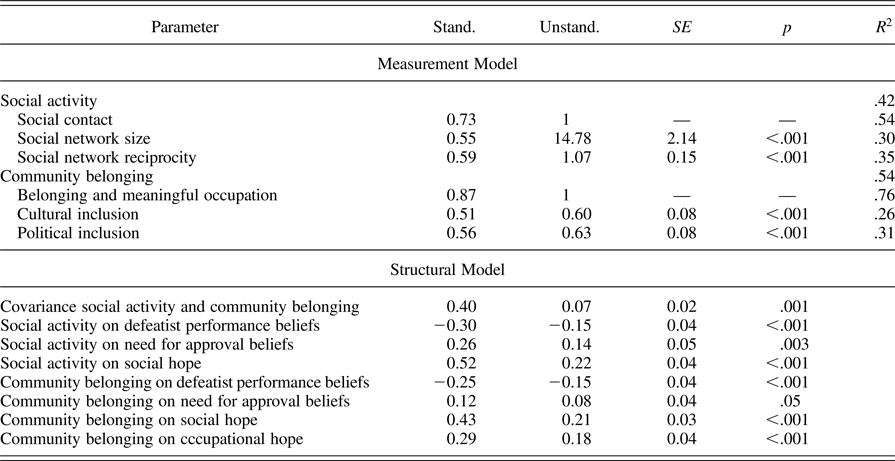
The social inclusion measurement model was created by respecifying the two-factor model as a confirmatory factor analysis using maximum likelihood robust estimation with cross-loading paths fixed to zero. Model fit was excellent: χ2 (8) = 10.22, p = .25, CFI = 0.99, RMSEA = 0.03, SRMR = 0.03. This structure partially supported the hypothesis that objective and subjective and social and occupational indicators would form separate factors, as social activity is a socially focused factor (composed of mainly objective items), and community belonging is mainly occupation or community focused (mixed objective and subjective items) as shown in Figure 2.
The beliefs in social inclusion model. Significance for factor loadings not shown for factor reference indicators as (unstandardized) factor loadings set at 1. Parameters are standardized path coefficients. *p < .05, **p < .01, ***p < .001.

The beliefs in social inclusion (BSI) model
The structures of domain-specific hopefulness and dysfunctional attitudes were first tested before specification of the BSI model. An EFA using WLSMV estimation for categorical data confirmed the 48 DSHS (Sympson, 2000) items form six separate hope scales: academic, work, social, romantic, family, and leisure hope, with acceptable model fit, χ2 (855) = 1,991.05, p < .001, CFI = 0.96, RMSEA = 0.06, and SRMR = 0.03. However, the scree plot indicated a break after two factors, and a subsequent EFA maximum likelihood robust estimation using the six subscale mean scores supported a two-factor structure, χ2 (8) = 15.78, p = .05, comprising occupational hope (academic and work) and social hope (social, romantic, leisure, and family). Thus hopefulness was represented as two subscale scores: occupational hope (mean of 16 items; α = 0.89) and social hope (mean of 32 items; α = 0.95).
A confirmatory factor analysis with WLSMV estimation confirmed the fit of the two-factor, defeatist performance and need for approval, dysfunctional attitudes (Weissman & Beck, Reference Weissman and Beck1978) structure was subthreshold, χ2 (274) = 1,054.39, p < .001, CFI = 0.90, RMSEA = 0.09, SRMR = 1.50. However, the scree plot supported a two-factor solution, further factors comprised only one or two theoretically incongruent cross-loading items, and Cronbach α was high for the defeatist performance (α = 0.92) and need for approval (α = 0.82) subscales; thus the two subscales were retained.
The BSI model was tested by regressing the two latent social inclusion variables onto hopefulness (social and occupational) and dysfunctional attitudes (need for acceptance and defeatist performance beliefs). Correlations between hopefulness and dysfunctional attitudes did not suggest significant multicollinearity (Field, Reference Field2009; Table 3).
Descriptive statistics and bivariate correlations among hope (social and occupational) and dysfunctional attitudes (defeatist performance beliefs and need for approval) using listwise deletion

Note: SH, social hope; OH, occupational hope; DP, defeatist performance beliefs; NA, need for approval.
*p < .05. **p < .01. ***p < .001.
This model (BSI.1) demonstrated good fit, χ2/df = 2.11, CFI = 0.94, RMSEA = 0.05, SRMR = 0.04, and an appropriate case to free parameter ratio of 9.68, albeit with a significant χ2 test, χ2 (24) = 50.66, p = .001. Occupational hope did not significantly predict social activity (β = 0.00, b = 0.00, p = .95), and fixing this path to zero did not significantly reduce model fit, Δχ2 = 0.03 (1), p > .10; thus, it was removed. In the amended model (BSI.2), the pathway from need for approval to community belonging was only just significant (β = 0.12, b = 0.08, p = .05), but removing it significantly reduced model fit, Δχ2 = 4.18 (1), p < .05; thus, it was retained. The fit of BSI.2 (depicted with standardized coefficients in Figure 2 and parameter estimates in Table 4) was good: χ2 (25) = 50.65, p = .001, χ2/df = 2.03, CFI = 0.95, RMSEA = 0.05, SRMR = 0.04. BSI.2 suggests greater social hope, lesser defeatist performance beliefs, and, unexpectedly, greater need for approval predict social activity and community belonging are predicted by, with greater occupational hope also predicting community belonging. Individual paths represent mainly moderate effect sizes, and the model overall explained a large amount of variance in social activity (R 2 = 41.8%) and community belonging (R 2 = 53.7%; Cohen, Reference Cohen1988, Reference Cohen1992). A specificity of association was found only for occupational hope and community belonging; all other self-beliefs in each domain (social and occupational) predicted both social inclusion domains.
Beliefs in social inclusion model (BSI.2) parameter estimates

A reverse model (BSIrev) was computed by regressing all four self-beliefs onto the two social inclusion factors to ascertain whether the data are also consistent with social inclusion predicting self-beliefs. BSIrev provided near equal fit to the original model, χ2 (25) = 51.17, p = .001, but does not improve on explained variance in its dependent variables compared to BSI.2. In this model, community belonging (β = –0.24, b = –0.38, p = .04), but not social activity (β = 0.14, b = 0.26, p = .27), was associated with need for approval, which differs from BSI.2. It could be that need for approval drives people to seek greater social activity and community belonging (BSI.2), with greater community belonging also leading to remittance of need for approval (BSIrev); however, the lack of association between social activity and need for approval (BSIrev) is counterintuitive. Although BSIrev cannot be fully discounted, BSI.2 has at least equivalent model properties and is theoretically superior due to the greater supposed degree of influence from beliefs to behaviors (Safran & Segal, Reference Safran and Segal1996). A nonrecursive (reciprocal) model was considered and tested. This model again provided near equivalent fit, χ2 (25) = 49.86, p = .002, to the original and reverse models, albeit with issues of power and stability with respect to residual variances. Model findings lent further statistical support to retaining the hypothesized model as parameters relating to paths from self-beliefs to social inclusion (i.e., as hypothesized) remained intact yet paths from social inclusion to self-beliefs (i.e., reciprocal) largely did not reach statistical significance.
BSI.2 was recomputed with mood as a covariate by regressing both social inclusion factors onto mood (BSI.3; see Table 5 for model key). Positive mood significantly predicted both social activity (β = 0.18, b = 0.05, p = .02) and community belonging (β = 0.19, b = 0 .06, p = .002). Associations between dysfunctional attitudes, hope, and social inclusion changed little compared to BSI.2 (<0.1 change in standardized coefficients), and mood explained little additional variance (1% social activity and 0.1% in community belonging); thus, associations between self-beliefs and social inclusion are robust to the influence of mood.
Model key

Note: BSI, Beliefs in social inclusion; LV, latent variables; MM, measurement model; OV, observed variable; SM, structural model.
Associations between gender and ethnicity and model variables were examined. When covarying gender, need for approval marginally rather than significantly predicted community belonging (β = 0.12, b = 0.07, p = .06). All other parameters remained significant and changed little in magnitude (<0.1 change in standardized coefficients), and thus gender has negligible impact. Ethnicity was not associated with social inclusion and was not analyzed further. Due to greater missing data for people born outside the United Kingdom, birthplace (i.e., United Kingdom vs. other) was covaried (BSI.5). Being born in the United Kingdom was associated with greater social activity (β = 0.15, b = 0.25, p = .03), but there were no other changes to parameter estimates.
A protective effect of the hopeful self?
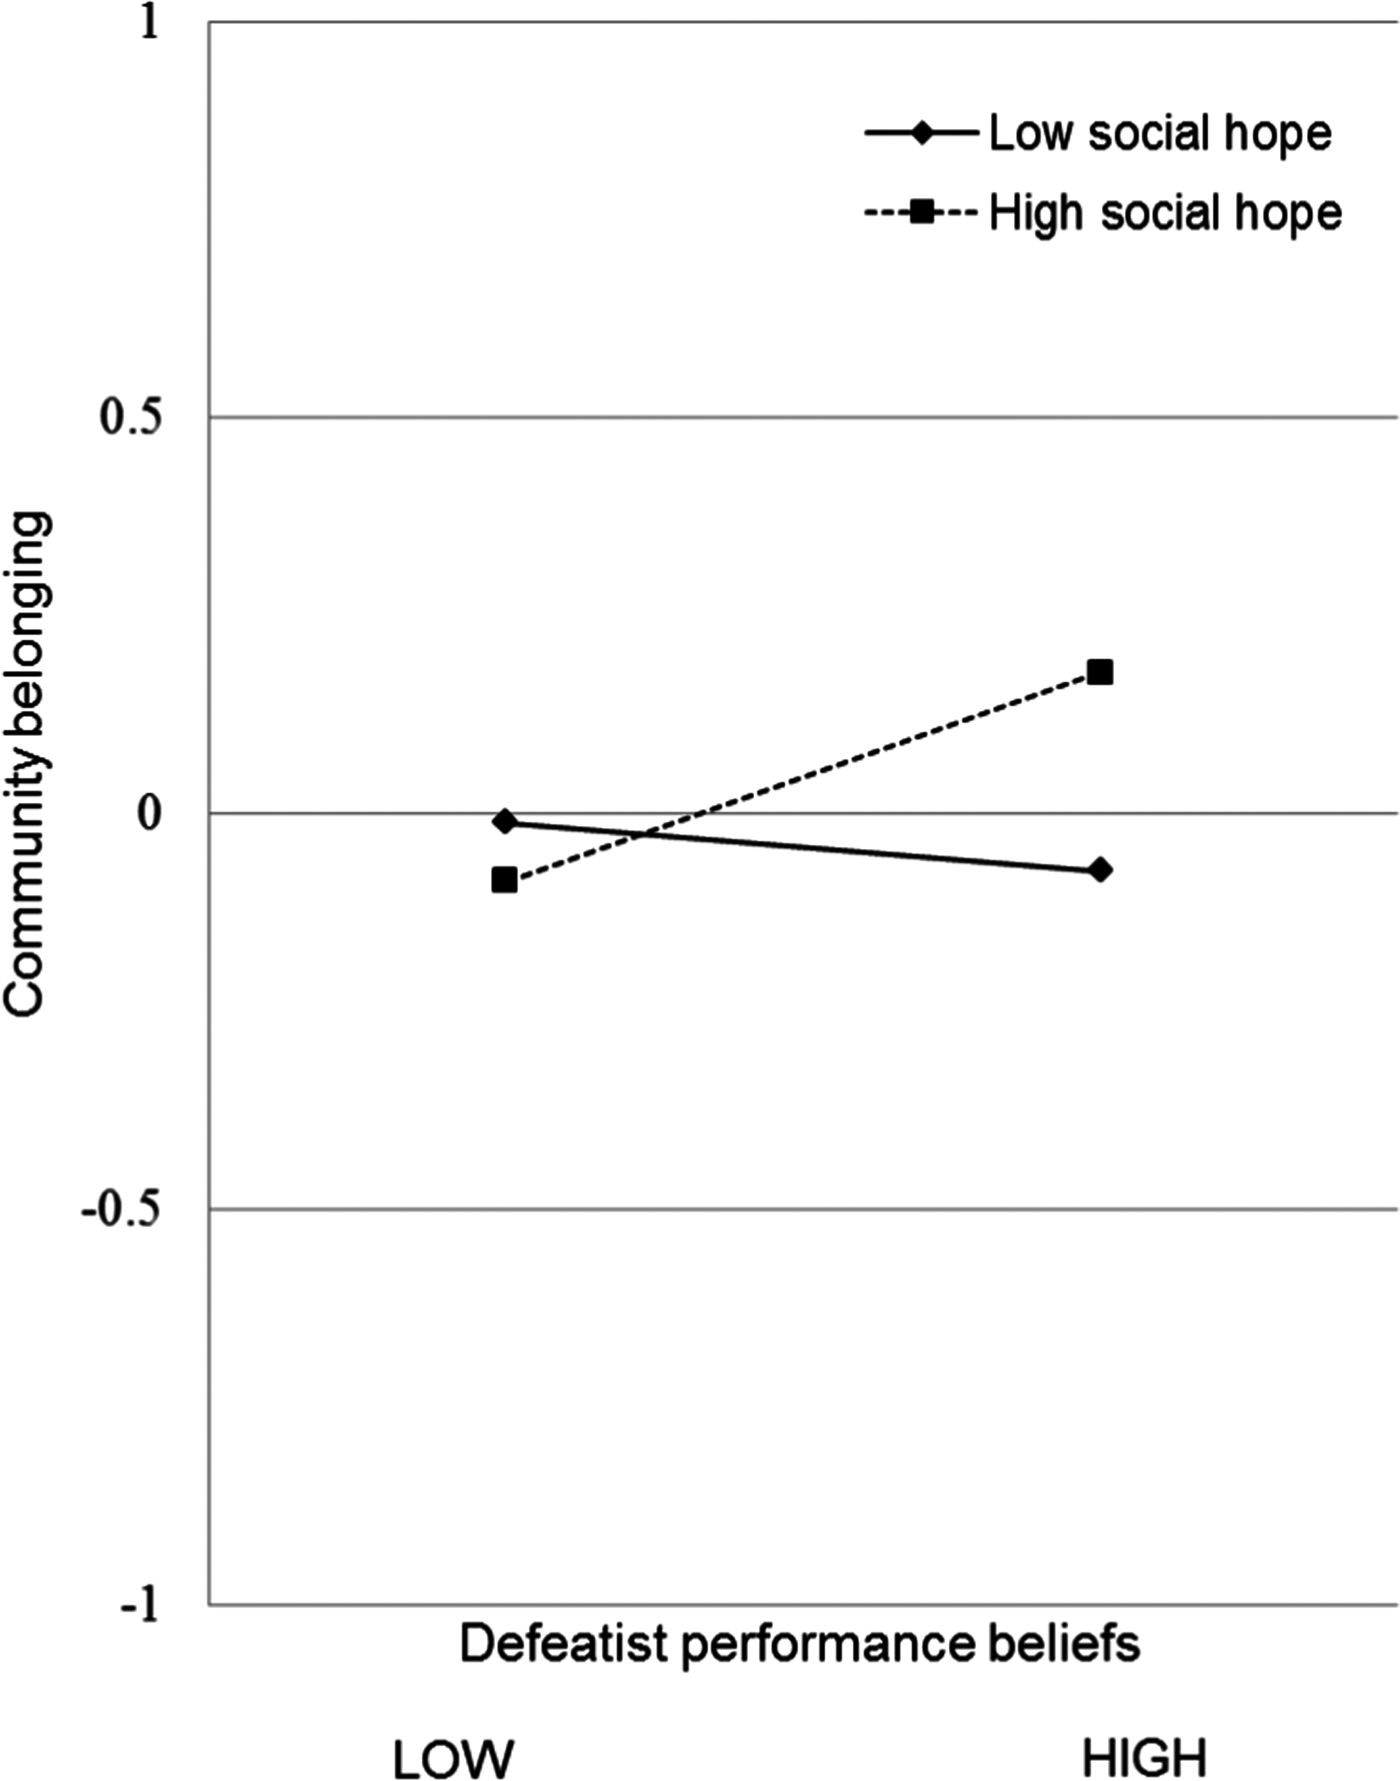
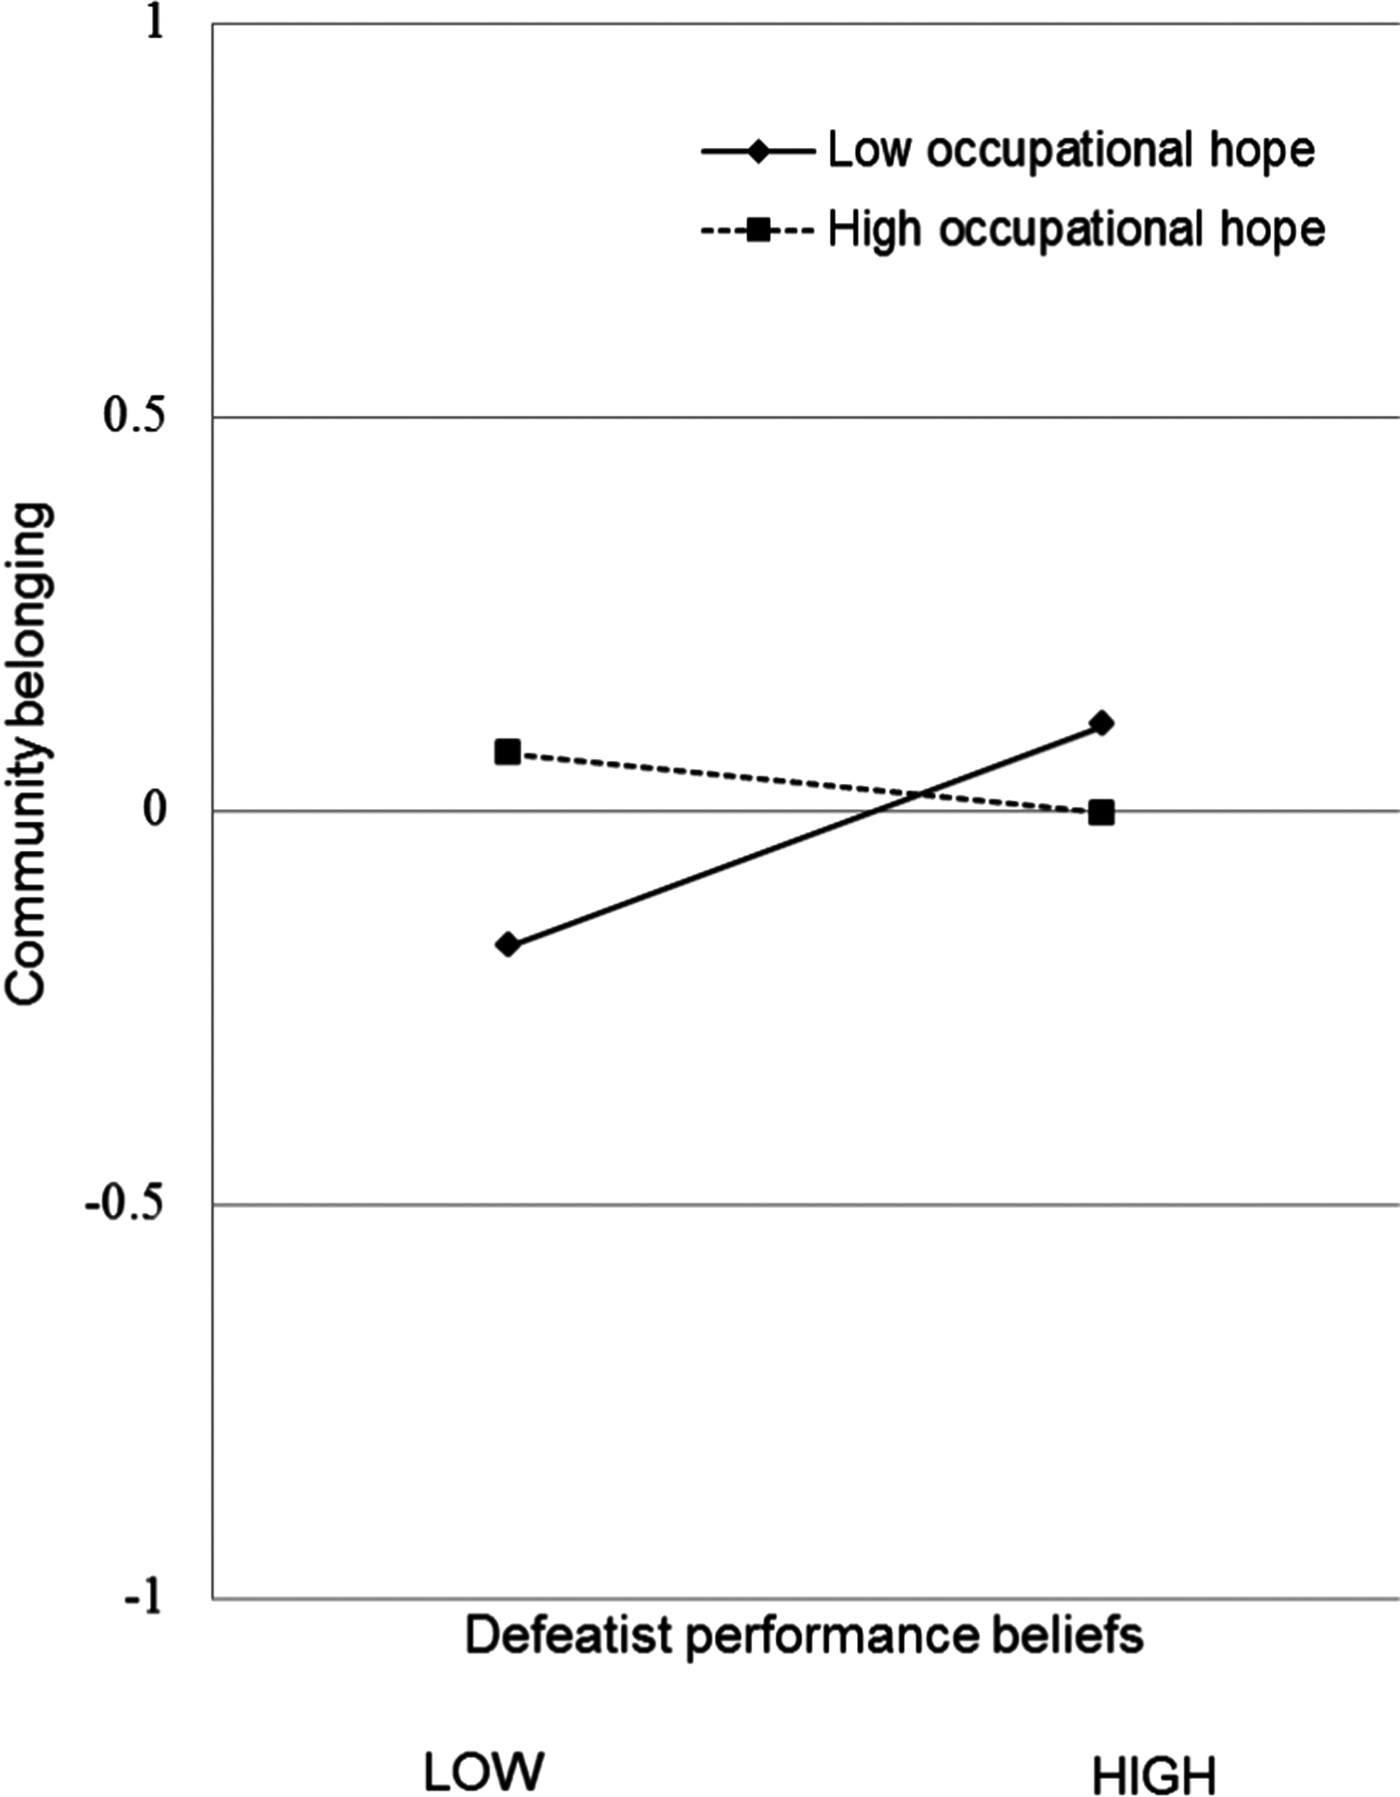
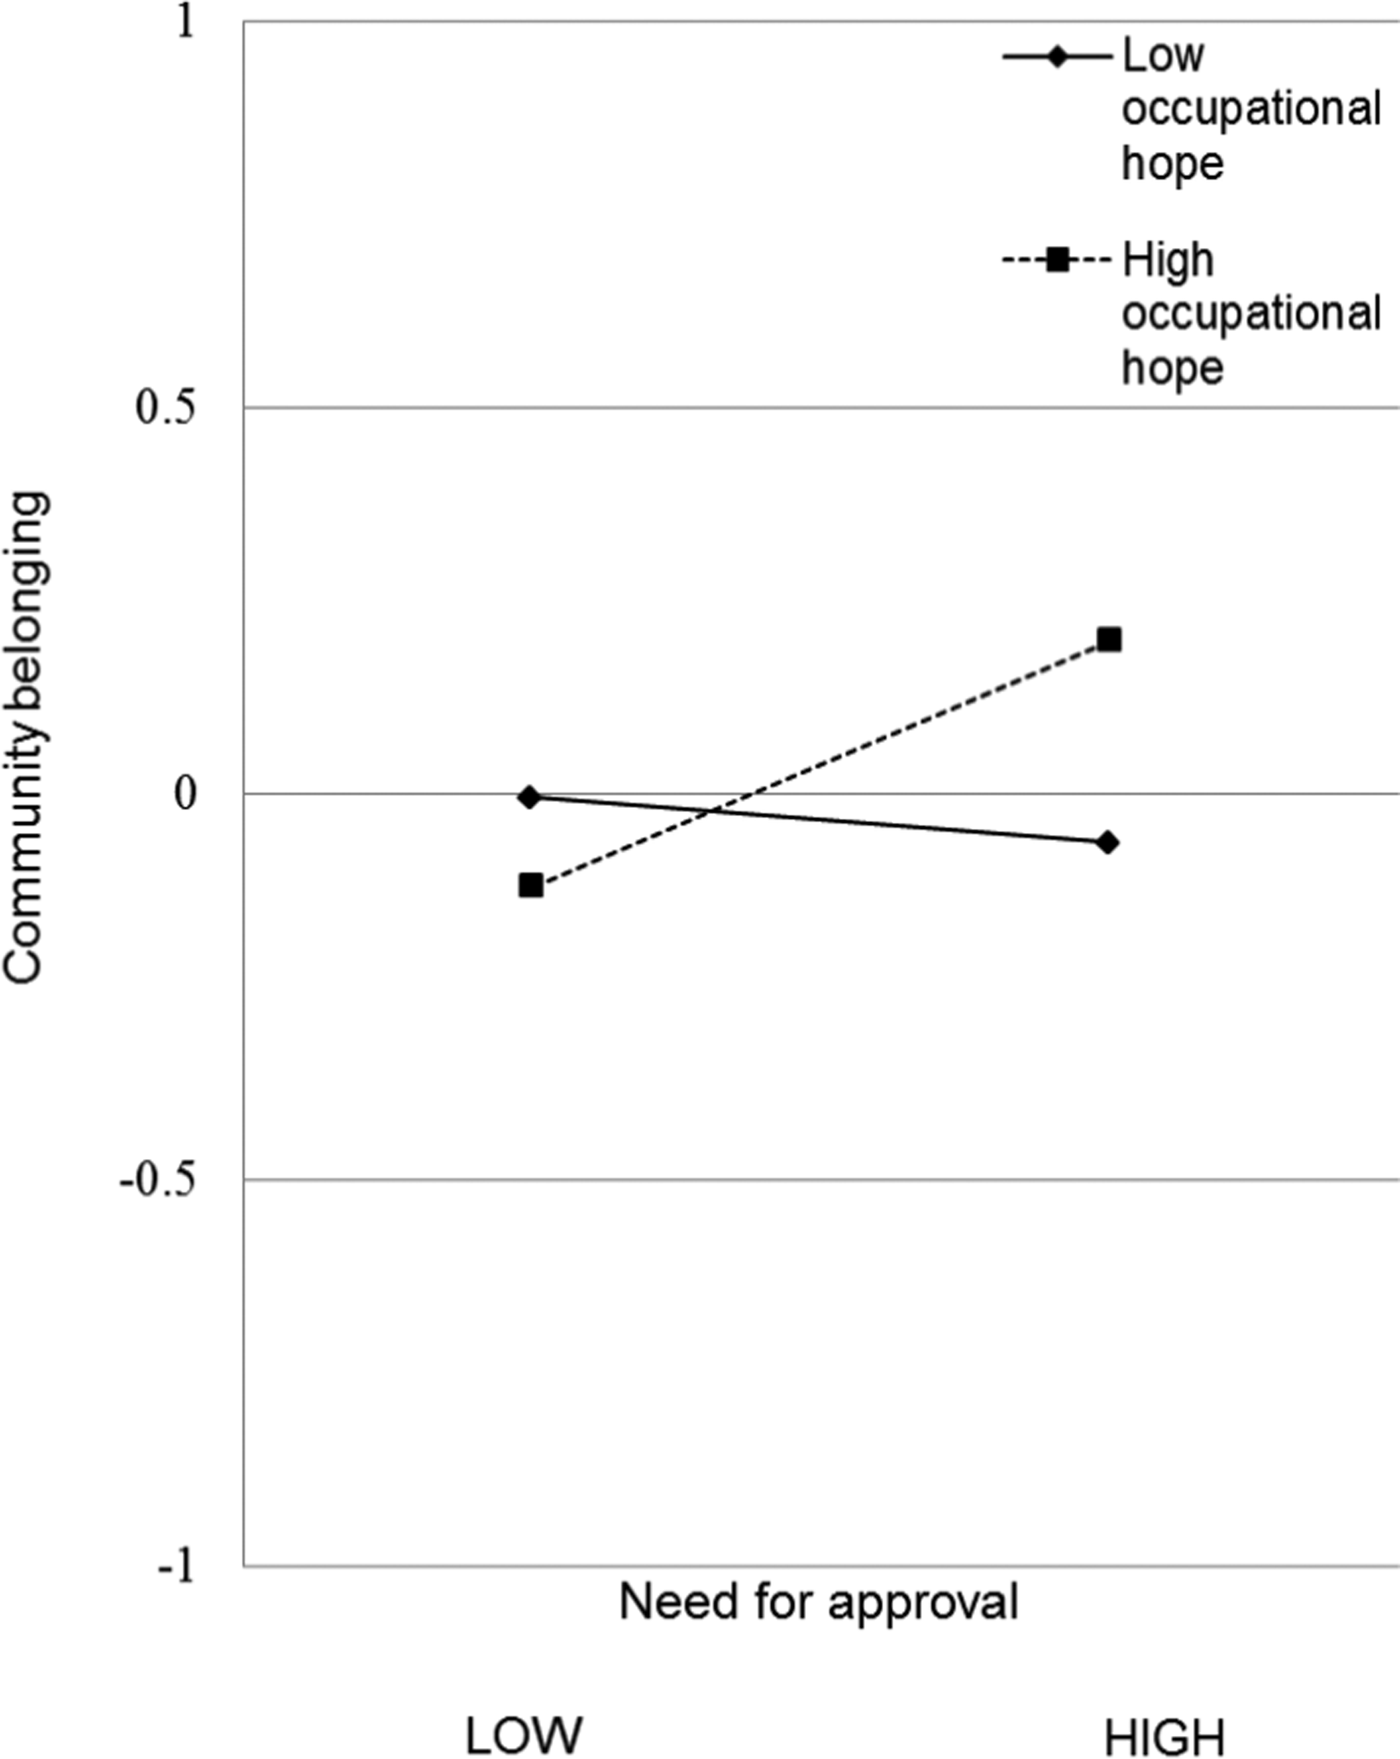
In order to investigate whether hope protects against the association between dysfunctional attitudes and social inclusion, grand mean-centered product terms were created and introduce as predictors of social inclusion: Defeatist Performance Beliefs × Occupational Hope, Defeatist Performance Beliefs × Social Hope, Need for Approval × Social Hope, and Need for Approval × Occupational Hope. The fit of this model (BSI.6) was excellent: χ2 (43) = 46.80, p = .32; CFI = 0.99, RMSEA = 0.02, SRMR = 0.03. No interaction effects were significant with respect to social activity, but significant small interactions were observed for Defeatist Performance Beliefs × Social Hope (β = 0.23, b = 0.08, p = .02), Defeatist Performance Beliefs × Occupational Hope (β = –0.20, b = –0.08, p = .02), and Need for Approval × Occupational Hope (β = 0.20, b = 0.09, p = .02) with respect to community belonging. Interaction plots were created representing ±1 SD for each self-belief. As a latent variable, community belonging has a mean and intercept of 0 and is represented on the y axis in standard deviation units of its measurement model reference indicator (i.e., belonging and meaningful occupation, M = 2.98, SD = 0.72).
To support the hypothesis that hope protects against the influence of negative self-beliefs, community belonging should be greater for high versus low hope when negative self-beliefs are high. As shown in Figure 3, high defeatist performance beliefs are associated with reduced community belonging only in the context of low social hope, suggesting high social hope is protective. Conversely, the findings did not support high occupational hope protecting against high defeatist performance beliefs, as community belonging was not greater when both defeatist performance beliefs and occupational hope were high (Figure 4).
Interaction between defeatist performance beliefs and social hope in their association with community belonging. The latent community belonging variable is represented on the y axis in standard deviations of the measurement model reference indicator (belonging and meaningful occupation, M = 2.98, SD = 0.72).

Interaction between defeatist performance beliefs and occupational hope in their association with community belonging. The latent community belonging variable is represented on the y axis in standard deviations of the measurement model reference indicator (belonging and meaningful occupation, M = 2.98, SD = 0.72).

Finally, despite the main positive association between need for approval and social inclusion overall, the findings still support a buffering effect of hope here (Figure 5). When occupational hope is high, high need for approval is associated with greater community belonging versus reduced community belonging in the context of high need for approval and low occupational hope.
Interaction between need for approval and occupational hope in their association with community belonging. The latent community belonging variable is represented on the y axis in standard deviations of the measurement model reference indicator (belonging and meaningful occupation, M = 2.98, SD = 0.72).

Looking through the developmental lens
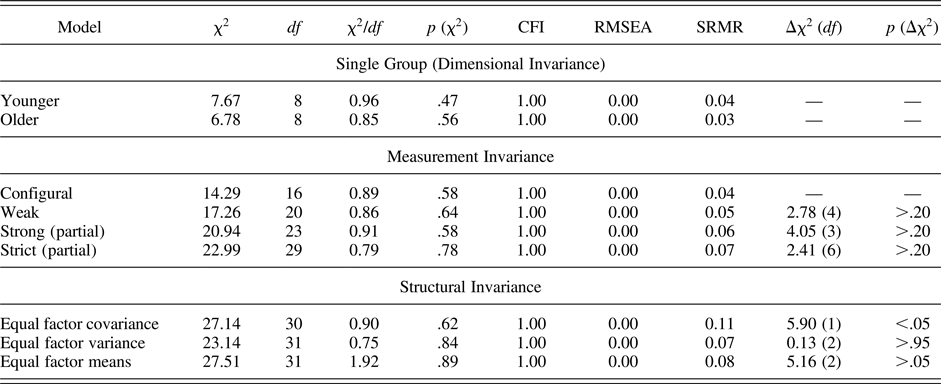
The sample was split into adolescents (14–18 years, n = 152) and young adults (19–36 years, n = 235) using age as a proxy for development. Developmental differences were tested using multigroup invariance testing in a series of hierarchical stages. First, the invariance of the measurement model was tested (social inclusion measurement model; i.e., equivalence of model fit, factor loadings, intercepts and residuals). Second, the invariance of the structural model (BSI.2) was tested (i.e., equivalence of factor means, variances, and covariances). As each additional element was constrained to equivalence and the new model compared to the previous step, a significant Δχ2 difference test implied significant difference and thus variance between groups (Widaman & Reise, Reference Widaman, Reise, Bryant and Windle1997). Partial variance was accepted in the measurement model, in which some model parameters (e.g., intercepts) can vary between groups, as long as at least one indicator per factor was invariant other than the reference indicator used to define the latent variable scale (Muthén & Christoffersson, Reference Muthén and Christoffersson1981; Steenkamp & Baumgartner, Reference Steenkamp and Baumgartner1998).
Invariance testing (Table 6) confirmed that the two-factor social inclusion structure fits well within (dimensional invariance) and equivalently across (configural invariance) adolescents and young adults, and factors have equivalent meanings (equivalent factor loadings; weak invariance). When testing equivalence in the meaning of scores (intercepts; strong invariance), the χ2 difference test revealed a significant difference, Δχ2 (4) = 12.38, p < .02; the source being the intercept for the social network reciprocity (M adolescent = 3.46, M adult = 3.77). Freeing this intercept resulted in a nonsignificant difference in comparison to the preceding model, Δχ2 (3) = 4.05, p > .05, confirming partial strong invariance (Table 6). Testing the strict partial invariance model confirmed that the between group difference relates only to the social network reciprocity intercept and not residual variances. Confirmation of partial measurement invariance allowed progression to testing structural invariance (Muthén & Christoffersson, Reference Muthén and Christoffersson1981).
Multigroup analysis of the beliefs in social inclusion model (BSI.2) comparing adolescents (14–18 years, n = 152) and young adults (19–36 years, n = 235)

The factor covariance, variances, and means were successively constrained to equivalence across groups and model fit compared. Factor means and variances were equivalent. However, the covariance between social activity and community belonging for adolescents (BSI.2 adolescent; β = 0.42, b = 0.13, p = .002) was significantly reduced compared to young adults (BSI.2 adult; β = 0.88, b = 0.25, p > .001), suggesting greater interrelatedness in the two social inclusion domains for young adults than adolescents.
In BSI.2 adolescents, neither defeatist performance nor need for approval beliefs predicted social activity (defeatist performance: β = –0.20, b = –0.11, p > .05, need for approval: β = 0.13, b = 0.07, p > .05) or community belonging (defeatist performance: β = 0.07, b = 0.04, p > .05, need for approval: β = –0.04, b = –0.02, p > .05). All paths were significant in model BSI.2 adult. Wald χ2 tests were used to ascertain whether these associations with each self-belief were significantly different between groups. Wald tests confirmed that need for approval (p = .049) and defeatist performance beliefs (p = .001) predicted community belonging to a significantly greater extent for young adults compared to adolescents. Occupational hope predicted community belonging to a greater extent in BSI.2 adolescent (β = 0.44, b = 0.26, p < .001) than BSI.2 adult (β = 0.22, b = 0.14, p < .05), but this difference did not reach statistical significance (p = .13). Group differences remained when controlling for mood.
Analysis of mental health status
Multigroup invariance testing was used to explore any differences between those participants self-reporting none (n = 246) versus previous or possible (“not sure”) mental health problems (n = 140). The results suggested that the social inclusion measurement model retains the same structure within and across both groups, although social network size was greater in the “none” group. Structural invariance testing suggested decreased social activity and community belonging in the “previous/possible” group, plus greater variance within these social inclusion factors and covariance between them. Parameter comparison suggested that higher need for approval only predicts increased community belonging for people with no history of mental health problems, whereas social hope predicts social activity to a lesser extent, as compared to the previous/possible group. These findings confirm that the BSI.2 model equally represents social inclusion for people reporting previous or possible compared to none, while providing preliminary evidence of some group differences.
Discussion
The BSI model
We present a novel exploratory model of social inclusion and its self-belief predictors within a healthy young population. The BSI.2 suggests that social inclusion can be represented as two separate but related domains of social activity and community belonging, which are predicted by hopeful and dysfunctional beliefs about the self related to social/interpersonal and occupational life domains independently of mood, gender, and ethnicity. Social hope, need for approval, and defeatist performance beliefs predicted both social activity and community belonging; occupational hope predicted only community belonging. The empirically explored structure of social inclusion is in keeping with its conceptualization as a multidimensional construct comprising indices of social, occupational, community activity, and subjective experience (Hall, Reference Hall2009; Morgan et al., Reference Morgan, Burns, Fitzpatrick, Pinfold and Priebe2007; Parr et al., Reference Parr, Philo and Burns2004). The incomplete separation of indicators into social versus occupational domains was not as predicted but is understandable considering that most or even all occupations are enacted in a social sphere (Grant & Parker, Reference Grant and Parker2009).
The associations between defeatist performance beliefs, social and occupational hope, and social inclusion follow theory that people's beliefs about themselves influence their behavior (Safran & Segal, Reference Safran and Segal1996), that hopefulness motivates and sustains goal-directed action (Snyder, Reference Snyder2002), and that dysfunctional attitudes lead to withdrawal from activity (Beck et al., Reference Beck, Rector, Stolar and Grant2009). Associations between all self-beliefs and both social inclusion domains (with the exception of occupational hope, which did not predict social activity) supports the notion that domain-specific self-beliefs predict performance and experience in the respective domain (Snyder, Reference Snyder2002), albeit in other domains as well.
Need for approval, ostensibly a negative self-belief that predicts greater symptoms in psychosis (Beck & Rector, Reference Beck and Rector2005; Lincoln et al., Reference Lincoln, Mehl, Ziegler, Kesting, Exner and Rief2010), unexpectedly predicted greater social activity and community belonging in the current healthy population. A particularly low level of need for approval does not explain this finding; the mean in the current sample exceeds that of previous healthy young samples (de Graaf et al., Reference de Graaf, Roelofs and Huibers2009) and is more akin to young people experiencing depression (Whisman & Friedman, Reference Whisman and Friedman1998). We wonder therefore whether even high need for approval can be adaptive for healthy young people (Abela & Hankin, Reference Abela, Hankin, Abela and Hankin2008) if perchance, and perhaps unlike people with mental health problems, they believe they can attain the interpersonal approval so desired. Our data are partially consistent with this idea, for this positive predictive effect of need for approval disappeared when testing the model only for people reporting previous or possible mental health problems, although no interaction was observed between need for approval and social hope in our sample.
Evidence for our hypothesis that hopefulness protects against the detrimental impact of dysfunctional attitudes (Fredrickson, Reference Fredrickson1998) was mixed. No interactions were observed with respect to social activity. The association between defeatist performance beliefs and community belonging was reduced when social hope was high, and the association with need for approval was particularly positive when occupational hope was high. However, when occupational hope was low, high defeatist performance beliefs actually predicted increased community belonging. We hypothesize that people with high defeatist performance beliefs may be defensively pessimistic and create unrealistically low targets and expectations for themselves, a strategy which improves anxious peoples’ goal attainment (Norem & Chang, Reference Norem and Chang2002). Thus, if people with high defeatist performance beliefs are anxious about failure, the exhibition of low occupational hope may be a defensive pessimist strategy that actually improves their perceived community belonging.
A developmental lens
We hypothesized that more objective indices of social activity would be greater for adolescents, and more subjective, occupational, and community indicators of inclusion would be greater for young adults, due to the former's developmental prioritization of peer relationships and the latter's prioritization of occupation and community involvement (Hartup & Stevens, Reference Hartup and Stevens1997; Iarocci et al., Reference Iarocci, Yager, Rombough and McLaughlin2008). However, levels of social activity and community belonging did not differ between groups. Progressively, complex developmental transitions and delays in when it is normative to achieve certain developmental milestones (Arnett, Reference Arnett2000; Farre et al., Reference Farre, Wood, Rapley, Parr, Reape and McDonagh2015) may have had an impact here. The inclusion of young adults aged up to 36 years is a key strength of the current paper. When considering “developmentally appropriate” interventions, previous work has tended to focus more purely on adolescents or perhaps the youngest of young adults. Associations between social inclusion domains did differ by age; reduced covariance between social activity and community belonging was observed for adolescents, perhaps suggesting that community belonging is associated with additional unmodeled factors in adolescents, such as school connectedness.
Associations between beliefs about the self and social inclusion also differed across age. Despite lower absolute levels compared to adolescents, defeatist performance beliefs (negatively) and need for approval (positively) predicted social inclusion only for young adults. Our findings are consistent with the theory that negative self-beliefs influence behaviors more when people reach cognitive maturity (i.e., early adulthood; D'Alessandro & Burton, Reference D'Alessandro and Burton2006). Theory suggests that need for approval is adaptive for adolescents but confers vulnerability when no longer considered normative (Abela & Hankin, Reference Abela, Hankin, Abela and Hankin2008). Therefore, evolving societal conceptualizations of what is normative for modern young people (Arnett, Reference Arnett2000) may delay and prolong the social benefits of need for approval, meaning that it may have negligible impact for adolescents and a positive impact for young adults before becoming pervasive later in life. We wonder whether the extent to which both adolescents and young adults now live their lives online, thus seeking and attaining instantaneous approval from others, may itself normalize prolonged need for approval. Use of online socializing may also be greater for young people exhibiting greater need for approval (Weidman et al., Reference Weidman, Fernandez, Levinson, Augustine, Larsen and Rodebaugh2012), which may contribute to us not observing a detrimental impact of need for approval in the present study. Future work is needed to replicate these age differences and consider both younger adolescents and older adults to understand the potential impact of a hopeful and dysfunctional self-view across the life course. Future work should also consider including online social experiences and activities when modeling social inclusion due to their importance in youth; we acknowledge the absence of this as a limitation of the current work.
No a priori predictions were made regarding age-related differences in hopefulness; however, our results point toward a greater association between hopefulness and social inclusion in adolescence. We hypothesize that repeated experiences of failure or struggle to attain goals may make young adults more aware of their limitations and blockages and thus undermine the benefits of hope (Byrne, Reference Byrne1998). Adolescents, in contrast, are less realistic and overendorse their own competence (Schunk & Meece, Reference Schunk, Meece, Pajares and Urdan2006), which may mean they strive further to achieve even more ambitious goals (Lachman & Burack, Reference Lachman and Burack1993; Snyder, Lehman, Kluck, & Monsson, Reference Snyder, Lehman, Kluck and Monsson2006). It may also be that adolescents’ goals are more synchronous, whereas for young adults more conflicting goals (e.g., family vs. friends vs. work) may limit the impact of even high hopefulness (Shah & Kruglanski, Reference Shah, Kruglanski, Boekaerts, Zeidner and Pintrich2000).
Limitations
Future work should involve cross-validation of the BSI model to further refine the construct and increase generalizability (MacCallum & Austin, Reference MacCallum and Austin2000) and to test its relevance to people with clinical diagnoses. We have some evidence that domain-specific hopefulness is relevant to predicting social inclusion for young people experiencing psychosis (Berry & Greenwood, Reference Berry and Greenwood2015), but explorations of associations with dysfunctional attitudes and other negative self-beliefs are warranted. The limitations of the current study include an inability with the present sample size to conduct higher order factor analysis of all social inclusion questionnaire items, a method that may have resulted in greater separation between social and occupational and subjective and objective indicators. A greater focus on objective measures of functioning is also warranted as recent research suggests actual weekly hours spent in constructive economic and other structured activity represents an important way to conceptualize social recovery in clinical populations with meaningful comparisons in the general population (Hodgekins et al., Reference Hodgekins, French, Birchwood, Mugford, Christopher, Marshall and Fowler2015).
Although our present research question focused on testing whether current data were consistent with self-beliefs influencing social inclusion, a reciprocal (nonrecursive) model was specified. Despite some statistical support for the hypothesized direction of effects from reciprocal direction model testing, current data (which were cross-sectional and did not include instrumental variables) were not collected to facilitate testing or comparing reciprocal effects. Future research could focus on increasing understandings of potential cyclical associations between self-beliefs and social inclusion perhaps using experience sampling methodology to further explore temporal predictive associations between these variables.
Finally, although our present focus was on individual-level predictors of social inclusion in the context of a capacity-building approach, we acknowledge that social inclusion is an interpersonal construct that operates within societal structures, and their absence is a limitation of the current study. A future focus on individual experiences and trajectories of social inclusion within the wider social and societal context, for example, considering school, peer, socioeconomic, and neighborhood influences, is encouraged. We have some evidence that relationships with professionals may support hopefulness and social inclusion for young people experiencing psychosis (Berry & Greenwood, Reference Berry and Greenwood2015). Furthermore, clinical research suggests, in addition to beliefs about the self, neurocognition, social cognition, and metacognition are relevant to social and occupational functioning, and thus their inclusion would arguably improve prediction of social inclusion across populations. In addition, there was increased chance of attrition of people not born in the United Kingdom in the current research, and consequently, uncertainty regarding the generalizibility of current findings to those born outside of the United Kingdom.
Recommendations for further research and practice
Youth and mental health professionals should be aware that in adolescence, the absence of hopefulness, rather than the presence of dysfunctional attitudes, may especially increase withdrawal from social activity and reduced sense of community belonging. Social exclusion is a clear risk factor for mental health problems (Fowler et al., Reference Fowler, Hodgekins, Arena, Turner, Lower, Wheeler, Corlett and Wilson2010; Kessler et al., Reference Kessler, Amminger, Aguilar-Gaxiola, Alonso, Lee and Ustun2007) and experiencing social disability itself then reinforces low hopefulness (Cohn, Reference Cohn1978), identifying young people with low hope and reduced social inclusion is especially important. There is emerging evidence too that preventative interventions, which traditionally may have focused on negating risks, may be more effective if focused on promoting strengths such as hopefulness (Kwon, Birrueta, Faust, & Brown, Reference Kwon, Birrueta, Faust and Brown2015). Our evidence supports broadening the scope of such preventative interventions in youth beyond the more commonly espoused foci of mood, general well-being, and academic achievement or treating mental health problems, toward the improvement of hope and young people's social inclusion.