

INTRODUCTION
From its inception in the wake of WWII, the United Nations (UN) has always been a world-making organization. As one of its specialized agencies, the United Nations Educational, Scientific, and Cultural Organization (UNESCO) emerged at a time when nations, cultural regions, and international boundaries were being re-drawn by the victors of that conflict. Despite the patently Western origins of UNESCO’s World Heritage program, nations like the U.S., Canada, and Australia that did much of the directing in the early years were not necessarily the nations to achieve the highest numbers of sites inscribed on the World Heritage List.Footnote 1 As in most globalizing arenas, the creation of UNESCO and the shift to global heritage ended up reinforcing the interests of sovereign states because it is so strongly pegged to national identification, prestige, and the recognition of a particular modernity. In fact, the nation state continues to be a particularly intransigent force in all of UNESCO’s operations. This situation is particularly acute in the case of World Heritage, and paradoxically one strongly in opposition to the ideals of global responsibility underpinning its original conceptualization.
Already obvious in the 1980s and brought before the World Heritage Committee in the 1990s, the over-representation of a handful of nations and representation of sites on the World Heritage List has caused international consternation. In 2000 the Cairns Decision was adopted to foster increased regional diversity of listings, to create greater equity and to curb ongoing European hegemony within the List. Entire programs like the Global StrategyFootnote 2 and the more recent “upstreaming process” have been initiated by UNESCO to address the structural imbalance in regional listings and profiles.Footnote 3 However, most commentators freely admit the failure of these programs, as was publicly stated in the 2015 World Heritage Committee meetings in Bonn, Germany. Reporting on the status of the Global Strategy, the Chairperson of the Working Group on the revision of the Operational Guidelines argued that “the imbalance in the List among regions and cultures has been deepened.”Footnote 4 States Parties to the Convention have long been vocal critics of this regional imbalance that continues to favor the listing of European properties. This dissatisfaction is similarly mirrored in an outpouring of scholarly criticism about Eurocentrism plaguing World Heritage.Footnote 5
In this paper we suggest that regionalism, both in terms of membership and participation in the World Heritage arena, is an issue that has political salience in the history and future of the Convention. As a structuring force in World Heritage, regionalism is situated between the overarching global aims of the Convention and the restricted national interests of States Parties. As a topic, regionalism has received surprisingly little attention in World Heritage scholarship despite its clear importance in site nomination, listing, and conservation. Writing on the 60th anniversary of UNESCO, Pierre Sané argued:
A more recent tension, part of the new configuration of international relations, comes from the increasing power of regionalism and of organizations of regional integration and cooperation. Whether we speak of the European Union, the African Union, MERCOSUR or ASEAN, the tendency taking shape is towards an increase and an intensification of scientific and intellectual cooperation with these blocs, accompanied by a common institutional approach with respect to external partners. The implications of this new regional multilateralism have not yet been fully integrated into reflexions[sic] on the future of the United Nations and UNESCO, although they could have a great impact on them in the long term. Footnote 6
Given our previous writing on multilateralism,Footnote 7 an examination of regionalism in the World Heritage arena is the logical next step. In our analysis, we integrate quantitative and qualitative methods to understand the changing regional trends within UNESCO over time. We approach World Heritage both in terms of outcomes, that is, the successful inscription of sites on the World Heritage List, and participation, both at annual sessions of the World Heritage Committee and on the Committee itself. In terms of sites inscribed on the List, we note a shift following the Cairns Decision in 2000 that limited the number of sites individual countries could inscribe per year.Footnote 8 We thus focus on identifying trends in regional dominance within this new paradigm following the implementation of the Cairns Decision in 2001 through 2014. In assessing regional participation, we analyze the size of all national delegations attending the annual Committee meetings,Footnote 9 a variable that we argue serves as a proxy for interest and investment in World Heritage. While all nations that have ratified the Convention can send delegations to these meetings, it is the States Parties with mandates to the World Heritage Committee that are the primary actors within the decision-making framework of World Heritage. As such, regional representation in the Committee represents another important dimension of this study.
Not least because of our overall results, this paper will focus specifically on the profiles of two of the most prominent regional groupings: “Europe and North America,” the most represented regional group on the World Heritage List with 491 sites out of the total 1031 as of July 2015, and “Asia and the Pacific,” which currently demonstrates the most dynamic growth in terms of site listing and Committee participation. In particular, we identify the sub-region of Southeast Asia as the most active group within the broader region. On the qualitative side, our ethnographic study includes long-term participation in the annual World Heritage Committee meetings as well as sustained interviews with members of the UNESCO secretariat, officials from the Advisory Bodies (ICOMOS, IUCN, ICCROM),Footnote 10 ambassadors and members of national delegations, and archaeologists and conservators involved in site nominations, as well as evaluators, consultants, and academics involved in various aspects of World Heritage.
THE MAKING OF REGIONS: THE UNITED NATIONS AND UNESCO
The particular crafting of global regions that we see today at UNESCO owes its structure largely to the United Nations, for which it serves as a specialized agency. Regional groupings, however, were neither specifically foreseen nor discussed during the 1945 UN Conference of International Organization in San Francisco when the UN Charter was first signed.Footnote 11 In subsequent years, regional grouping was informally recognized as a pragmatic tool for facilitating smooth functioning within the UN,Footnote 12 eventually becoming official in the 1960s.Footnote 13 Membership in regional groups allows a state to be eligible for candidacy in various UN forums. Currently, the UN has organized its member states in five regional groups: Africa, Asia-Pacific, Eastern Europe, Latin America and the Caribbean, and Western Europe and Other States (WEOG).Footnote 14 As Forteau notes,Footnote 15 this specific regional subdivision reflects an anachronistic Cold War situation that favors the European States. Europe’s division into two different groups gives member states belonging to those groups (Eastern Europe and WEOG) a stronger chance for election across UN forums.
While those groups are labeled “regional,” this classification should not be understood in a strict geographical sense. Rather, regional groupings are sometimes used to strengthen pre-existing political and economic relations.Footnote 16 Such classification encompasses both characteristics of geographical location and political affiliation.Footnote 17 Within the UN regional system there are a few noteworthy geographic exceptions in regional groupings. For example, Turkey formally belongs to both the Asia-Pacific Group and to WEOG, yet is considered a WEOG member for electoral purposes. The U.S., while not officially belonging to any group, attends meetings and votes with WEOG. Another case is Israel, which since 2004 has been a member of WEOG on a permanent basis.Footnote 18 Moreover, as noted by several authors, in a world of increasing multipolarity, geographical proximity might not be a necessary condition for grouping. A particularly salient example is the group of countries subsumed under the acronym of BRICS (Brazil, Russia, India, China and South Africa). The acronym BRICS was first coined at Goldman Sachs to refer to the set of nations at similar stages of newly advanced economic development.Footnote 19 Over the years, those countries have transformed what was an externally imposed and economically based categorization into a political grouping.Footnote 20 Since 2007 they have held BRICS summits and restated their political positions through a series of declarations released at the end of those summits. It has been shown previously that the cohesion of this non-geographical grouping has important implications in the World Heritage arena.Footnote 21
As with the UN, during the 1960s the UNESCO General Conference defined its regions with a view to the execution of regional activities. The five regions were: Africa, Latin American and the Caribbean, Arab States, Asia, Europe.Footnote 22 However, before 1973, regional grouping in UNESCO was organized informally and not all member states were assigned to a specific region. In fact, as noted by Hoggart, there were the ambiguous cases of member states that belonged “culturally to regions of which they are not geographically part.”Footnote 23 In particular, five members were not assigned to any region: the U.S., Canada, Australia, New Zealand and Israel.Footnote 24 In 1973 the Executive Board decided to define a formal classification and invite member states to join the assigned grouping.Footnote 25 Member states were classified according to three criteria: a) the state’s interests and abilities to contribute to the activities of the regions and facilitate the Organization’s mission; b) its geographical position; and c) its historical, cultural, or social traditions. On the basis of this classificatory scheme, the Executive Board decided to include Canada and the U.S. in the European regional group.Footnote 26
This decision was the result of the intense diplomatic efforts by the U.S. and Canada, as revealed in a WikiLeaks cable.Footnote 27 American diplomats, recognizing that UNESCO was bolstering its “regional approach” to the implementation of its activities, considered that exclusion from full participation in a regional group would be detrimental to the U.S.’s international influence. The decision of the U.S. to pursue membership in the European group was pointedly motivated by three factors: European issues reflected the concerns of industrialized nations and were thus of particular interest to the U.S.; it was asserted that those were the matters where the U.S. could contribute; and finally the U.S. felt there were close cultural, social, and educational ties between themselves and Europe. The 18th General Assembly approved both U.S. and Canadian requests for membership in the European group, while Australia and New Zealand were designated to the Asian group.
The situation with Israel was more complex and is often considered the first example of “politicization” within UNESCO.Footnote 28 This issue has continued right through to the admission of Palestine as a permanent member in 2011.Footnote 29 In 1974, Israel requested membership in the European region, but the UNESCO General Conference rejected the request.Footnote 30 This decision was connected to another resolution passed that same year by the General Conference condemning Israeli archaeological excavation in East Jerusalem. In response to that resolution the U.S. withdrew financial support from UNESCO for 1977.Footnote 31 As a result, Israel was assigned to Europe during the 1976 session of the General Conference.Footnote 32 After this, Israel’s regional membership in WEOG became consistent across the UN.
UNESCO’s particular system of regionalization has been controversial on a number of fronts. While it makes little sense in terms of geographical regionalism, it has a strong political orientation as with the UN. Indeed, UNESCO is highly conscious of this disjuncture, and to dispel confusion includes a disclaimer at the top of its World Heritage statistics webpage that reads “the regions presented here are defined by UNESCO for its activities, and do not necessarily reflect the actual geographical location of countries.”Footnote 33 UNESCO’s five regional groups today are divided into Africa, Arab States, Asia and the Pacific, Europe and North America, and Latin America and the Caribbean.Footnote 34 However, in order to correct an imbalance in the geographical distribution of seats on the Executive Board, all members of UNESCO are additionally grouped by Electoral Groups: Group I (Western European and North American States); Group II (Eastern European States); Group III (Latin American and Caribbean States); Group IV (Asian and Pacific States); Group V (a) (African States) (b) (Arab States). According to this system of regional electoral grouping, each group is allocated a specific number of seats on the Executive Board.Footnote 35
Significantly, the World Heritage Committee did not follow the regional Electoral Groups as set out by UNESCO. This exception was justified by the fact that the Committee was supposedly one of “experts,” rather than regional representatives. However, the Convention states that there should be equitable representation from different regions and cultures of the world within the Committee.Footnote 36 Indeed, the proposal to apply a system of regional quotas was discussed at the very first session of the General Assembly of the States Parties to the World Heritage Convention (General Assembly).Footnote 37 Syria suggested assigning seats on the basis of electoral groups thereby following a commensurate practice in other UNESCO bodies.Footnote 38 However, this proposal was not met with Committee consensus. Instead, elections proceeded by secret ballot and this practice became the norm.
The issue of equitable representation became an ongoing concern discussed regularly in the General Assembly and the World Heritage Committee. During the 7th General Assembly in 1989, some delegates noted “a lack of balance in the distribution of seats to different geographical groups” and that if “the present [1989] membership of the Committee is examined in the light of the criteria for regional distribution laid down at UNESCO for the execution of regional activities, the following situation emerges:”Footnote 39
| Africa | 2 representatives |
| Latin America and the Caribbean | 3 representatives |
| Asia and the Pacific | 4 representatives |
| Arab States | 3 representatives |
| Europe | 8 representatives |

The 1989 arrangement of seats clearly illustrates European dominance, a trend that has persisted throughout the history of the World Heritage Committee. Some States Parties had at that point been members of the Committee for more than 10 consecutive years.Footnote 40 Over time, numerous working groups have been established to resolve the issue of better representation and rotation of seats, and the idea of a regional quota continued to reemerge as a solution for achieving a balance between technical expertise and equitable representation for different regions, nations, and cultures.Footnote 41
This controversial issue of balance came to the fore again during the 19th General Assembly in 2013 as a reaction to the election of new World Heritage Committee members. Specifically, six African nations proposed their candidacy but none were selected,Footnote 42 despite the region being considered a “priority” for UNESCO.Footnote 43 Instead, this election resulted in nearly one third of the Committee members being drawn from the Asia and the Pacific regional group.
After the 2013 elections, Brazil presented a draft proposal for a system based on the six electoral groups devised by UNESCO.Footnote 44 This system is employed in other UNESCO Conventions, such as the 2003 Convention for Safeguarding Intangible Cultural Heritage and the 2005 Convention of Protection and Promotion of the Diversity of Cultural Expressions. Brazil’s solution, however, divided the General Assembly into two opposing camps. One group argued that the Committee was a technical body and the guiding criterion should be their competence in cultural and natural heritage and not based on a system of prearranged regions. This group argued for a system of free competition among States Parties and suggested that prospective member’s CVs should be circulated. Some opined that a system based on geographical quotas would only lead “to a trivialization of the Committee” and further “politicization.”Footnote 45 The second group contended that the Committee must follow a system of fair geographical representation akin to other UN bodies. They marshaled arguments of justice, equity, and credibility within the World Heritage Committee. While expertise was present in all nations, they stated, not all had the financial means to prepare costly electoral campaigns that resemble those of FIFA. These representatives also argued that equitable geographical distribution should not be conflated with politicization.
After three meetings of an ad-hoc Working Group in Paris and the first-ever extraordinary session of the General Assembly to debate the issue,Footnote 46 the Assembly finally decided to amend the rules of procedure for future elections of the World Heritage Committee. Specifically, elections will now be based on the composition of Electoral Groups as determined by the UNESCO General Conference, with each group being assigned a set number of seats:Footnote 47
| I. Western European and North American States | 2 seats |
| II. Eastern European States | 2 seats |
| III. Latin American States | 2 seats |
| IV. Asian and Pacific States | 3 seats |
| Va. Africa States | 4 seats |
| Vb. Arab States | 2 seats |
| Alternating III. and IV. | 1 additional seat |
| Open Election | 5 seats |
This decision effectively ends the “fiction” that the Committee was primarily a technical body whose members were selected on the basis of their expertise—a fiction that disregards the power relations and political alliances that some countries exert over others during the election period. Gone too is the vision of UNESCO as a depoliticized agency run by international civil servants selected for their intellectual qualities to serve the ideal of the institution, rather than their own nations.Footnote 48
The next section opens with a brief introduction to regionalism. We then present our analysis of official documents from the World Heritage Committee and General Assembly meetings in order to underscore trends in regional activity within the World Heritage arena. We examine inscriptions to the World Heritage List in terms of regional and sub-regional representation to determine patterns of representation and participation through time.
Constructing Heritage Regions
Academic studies of regionalism have recently been reinvigorated, especially in regards to contemporary developments across Asia. More than ever, studies of internationalism must take into account regionally based processes of political and economic integration, security, and social identification. Nowhere have such processes gone further than in Western Europe, according to policy analysts. And yet, surprisingly similar patterns of regional integration have developed in East Asia—once considered a region unlikely to replicate the European experience.Footnote 49 We suggest that this trend manifests itself in the World Heritage arena with the rise of Asian nations on the World Heritage Committee. This also follows with the new phase of global capital that is as much about cultural exchange as it is about economic and political exchange, and that is part of the “culturalization” of economic life.Footnote 50
Typically a region is defined as “a limited number of states linked together by a geographical relationship and by a degree of mutual interdependence.”Footnote 51 Here we consider regionalism as encompassing both intergovernmental and state-led projects that promote a definable geographic area by developing specific institutions and strategies. Such coherent and top-down policies similarly embrace sub-state and non-state actors, coordinating arrangements and activities in a particular part of the world.Footnote 52 Obviously regions develop differentially on the basis of particular geographies, cultural practices, and social traditions. Their degree of coherence is similarly variable. Stated broadly and following Ching, we suggest that “regionalism represents a mediatory attempt to come to terms with the immanent transnationalization of capital and the historical territorialization of national economies.”Footnote 53 As such, regionalism embodies elements of globalization on the one hand, but also of national interests on the other. This arrangement can also be observed in the political economy of World Heritage, in the form of regional blocs that form to serve sovereign interests, as we go on to outline.
While material negotiations involving specific World Heritage properties are intimately bound to locality and sovereignty, the political exchanges that lobby and secure World Heritage inscription are most often tied to territorial exchanges. Symbolic supra-national negotiations about World Heritage processes and politics are increasingly free of any particular spatial referents and can involve an array of commitments, such as the BRICS group.Footnote 54 One might say that World Heritage, by its very nature, is concerned with globalism and global patrimony by entreating all the nations of the world to share in the responsibility of conservation. Yet in reality, World Heritage has a distinctly regional flavor.
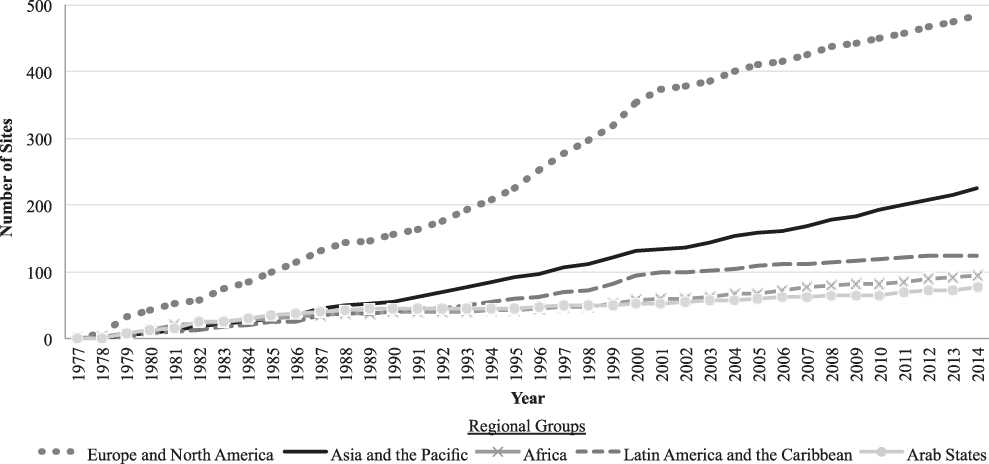
It is not difficult to uncover regional bias within the World Heritage framework. Of the 1007 sites on the World Heritage List until 2014, 48% are from “Europe and North America,” a figure that is more than twice the next highest region “Asia and the Pacific” with 23% of sites. Even lower are “Latin America and the Caribbean” with 13%, “Africa” with 9%, and “Arab States” with 8%. The inequity of this distribution, with Europe and North America on top, goes back to the very beginnings of the World Heritage List in the late 1970s (see Figure 1).
Cumulative number of sites inscribed on the World Heritage List from 1977–2014 by Regional Group.
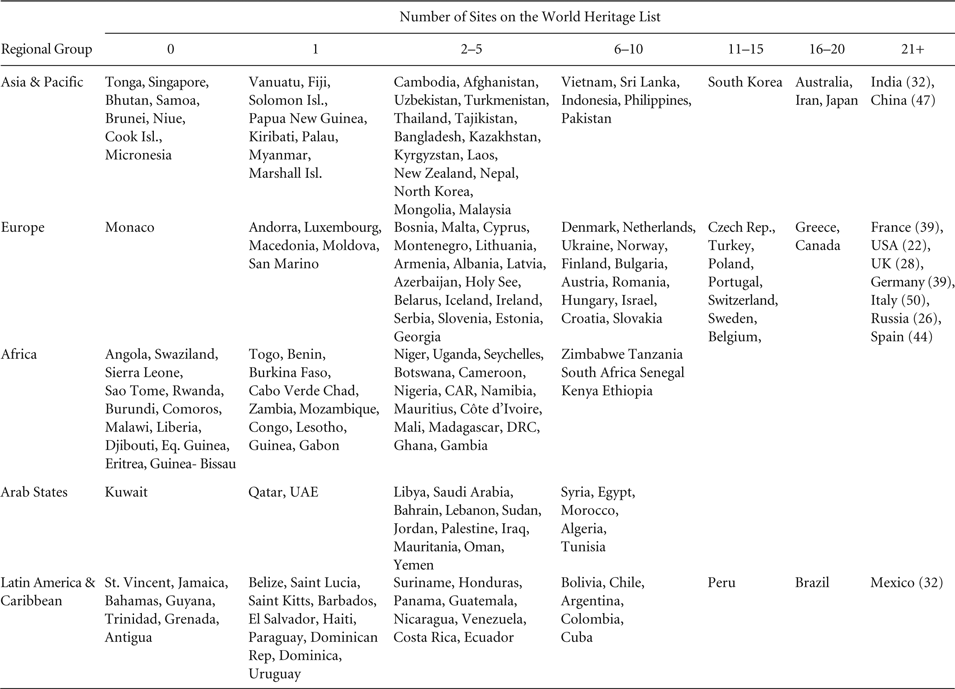
Inequity on the World Heritage List does not only manifest itself regionally, but also exists at the scale of individual countries. As Reyes demonstrates, the role of States Parties must be acknowledged within any discussion of regional activity.Footnote 55 She shows that Italy accounts for 5% of all inscriptions, Italy and Spain account for 9%, while six countries account for 24% (Italy, Spain, France, Germany, China and Mexico), and 13 countries account for 40% (Italy, Spain, France, Greece, Germany, India, U.K, U.S., Canada, China, Mexico, Russia, and Brazil). The inscription activity of individual countries comprising each region is displayed in even greater detail in Table 1, revealing the importance of sovereign states in the creation of what we identify on a macroscale as regional trends in the World Heritage List.
Number of sites inscribed by States Parties on the World Heritage List in 2014 arranged according to Regional Group
Cultural economists Bertacchini and Saccone highlight that the preparation of nominations is very costly, requiring both financial resources and expertise in heritage conservation and management.Footnote 56 Thus, differences in countries’ conditions and consequently nomination capacity are likely to affect the number of sites inscribed on the List. This issue of the cost is approached more generally by Van der Aa. Building on the premise that citizens of wealthy countries have greater heritage capacity, since the care for the built and natural environment becomes more feasible after primary needs are met, Van der Aa suggests that more European sites are on the List because World Heritage sites are predominantly located in richer countries.Footnote 57 Yet this does not imply that poorer nations have fewer outstanding heritage sites and traditions, just fewer resources to mobilize for UNESCO nominations. The world’s twenty-one richest countries have on average thirteen World Heritage sites. The other 146 countries that ratified the convention have on average a little more than three World Heritage sites.
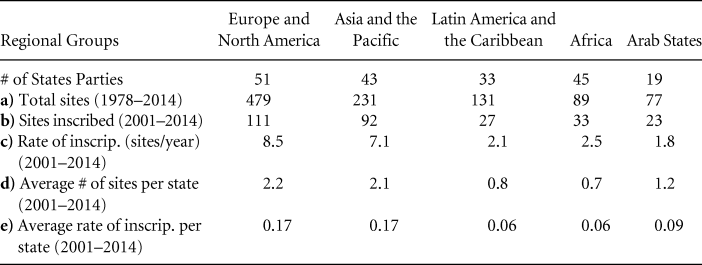
The number of countries within each regional group must also be factored into regional comparisons of inscription activity. Europe and North America consists of 51 countries, Africa 45, Asia and the Pacific 43, Latin America and the Caribbean 33, and Arab States 19. The larger the regional group, the more capacity it has for participation and inscription. Additionally, over the first two decades of the Convention there was no limit to how many sites a country could annually nominate. This resulted in a small number of primarily Western European nations with the resources and influence to mobilize their cultural wealth achieving disproportionate representation on the List. To cite an extreme example, Italy managed to inscribe 10 sites in 1997.Footnote 58 This is remarkable considering that 165 out of the 191 States Parties to the Convention have inscribed less than 10 sites in total.
In order to rectify the growing inequity of representation on the World Heritage List, the Committee enacted a decision at its 24th session in 2001 that set the limit at one new site nomination per country per year. Known as the Cairns Decision, this created a new paradigm within World Heritage, leveling the playing field in an attempt to foster increased regional diversity of listings and to curb the hegemony of heritage powerhouses like Italy, Spain, France, and Germany. Amended several times in subsequent sessions of the Committee, the current limit is set at two new nominations per country annually, given that one is a natural site or a cultural landscape.Footnote 59 In confining our analyses to sites inscribed to the List after 2001, we aim to identify the dominant players within the current system of World Heritage without running into historical biases.
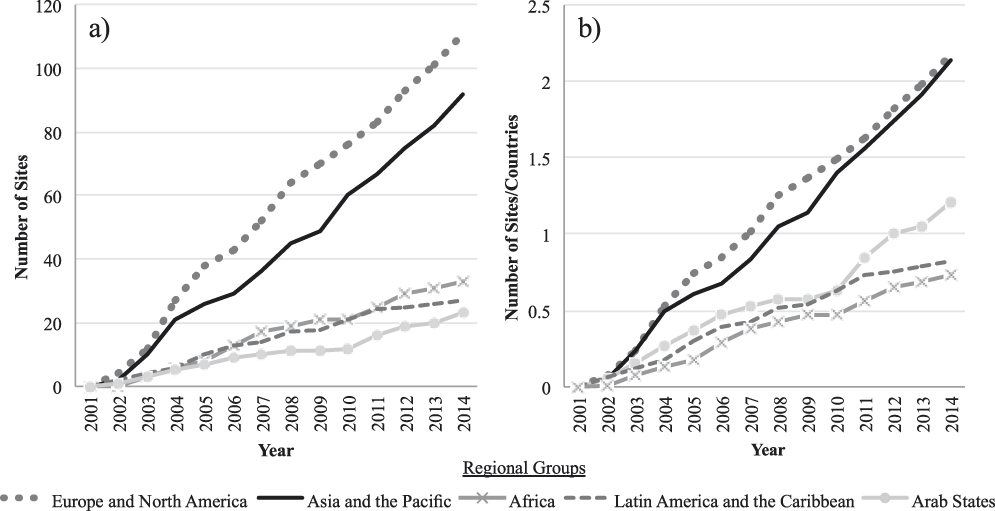
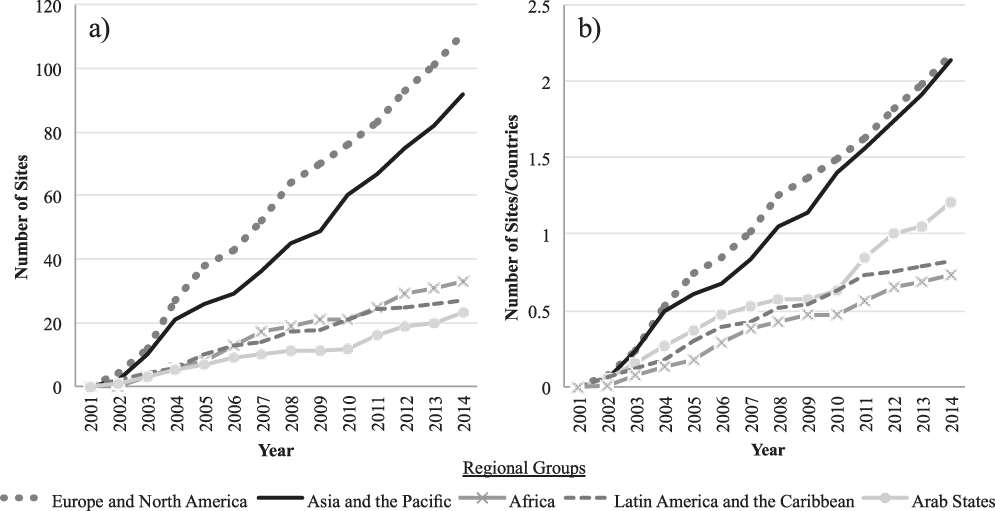
The cumulative number of sites inscribed to the World Heritage List by regional group exclusively during the period of 2001 to 2014 is displayed in Figure 2a. In this new regional distribution, also examined numerically in Table 2, we see Asia and the Pacific much closer to Europe and North America both in number of sites inscribed (92 Asia, 111 Europe) and rate of site inscription (7.1 sites/year Asia, 8.5 sites/year Europe). The other three regions trail far behind with about 20 to 30 sites inscribed between 2001 and 2014 at rates close to two sites per year. However, this distribution does not take into account the difference in number of States Parties within each regional group. Dividing the total number of inscribed sites in each region by its number of countries enables further regional comparisons (Figure 2b).
Cumulative number of sites inscribed on the World Heritage List from 2001–2014 a) by Regional Group; b) corrected to account for the size (number of countries) of each Regional Group.
Regional inscription profiles. Number of sites inscribed on the World Heritage List a) from 1978–2014, b) from 2001–2014; c) average rate of site inscription (sites/year) to the List for 2001–2014; d) the average number of sites inscribed per state from 2001–2014; e) average yearly rate of inscription per state (sites/year/state) for 2001–2014
Correcting for the size of each region, the gap between Asia and the Pacific and Europe and North America regional groups closes, with both regions exhibiting the same level of inscription activity: an average of .17 sites inscribed each year per state, and 2.2 sites inscribed per state during the period 2001 to 2014. The Arab States have the third highest level of inscription activity, a statistic usually masked in uncorrected distributions since it is the smallest regional group with only 19 nations. Africa and Latin America and the Caribbean tie for the lowest level of inscription activity per country. In terms of World Heritage outcomes, Asia and the Pacific clearly rival Europe and North America as a dominant regional group. This trend is paralleled in regional participation at Committee meetings and within the Committee membership itself.
In the next section we analyze the size of national delegations and participation at the World Heritage Committee meetings, as well as candidacy to the Committee. We look here too at regional and sub-regional patterns to achieve a more nuanced vantage on pressing recent issues such as global representation and balance.
REPRESENTING NATIONS AND DELEGATIONS
All States Parties to the Convention, regardless of whether they have a mandate to the World Heritage Committee itself or not, are permitted to send a national delegation to the annual meetings. Delegations from States Parties that are not Committee members have “observer” status and maintain indirect involvement in World Heritage decision-making processes. However, this does not mean that observer delegations are unimportant. On the contrary, their presence is essential for lobbying and consultation with Committee members, especially when a State Party has a nominated property. By examining the scale of diplomatic delegations attending sessions of the World Heritage Committee over the last 15 years, we illustrate changing geopolitical patterns in participation.
Delegation size varies considerably. Table 3 shows the distribution for the 38th session of the World Heritage Committee in Doha, Qatar in 2014. On one end there are many nations that send no representatives, while on the other there are countries with large diplomatic teams. The largest delegation ever sent to any World Heritage Committee session was from China in 2012 with 91 individuals. As noted by Pouliot,Footnote 60 in the context of the UN generally, the size of diplomatic missions, together with the presence of experienced diplomats, is necessary for attaining status in larger political negotiations. In this analysis we use delegation size as a proxy for interest and investment in the World Heritage process, since sending a larger delegation is an expensive and complex undertaking to coordinate. As noted by our informants, some States Parties spend more money in sending delegates to World Heritage Committee sessions than they do in annual contributions to the World Heritage Fund. It is striking that in terms of global participation in the working of the Convention 77 nations did not send a single representative to the 2014 Committee sessions. Of the current signatory parties to the Convention this means that 40% were absent. Historically, this has been a common pattern since the early years of the Convention.
Size of delegations sent by States Parties to the 38th Session of the World Heritage Committee in 2014

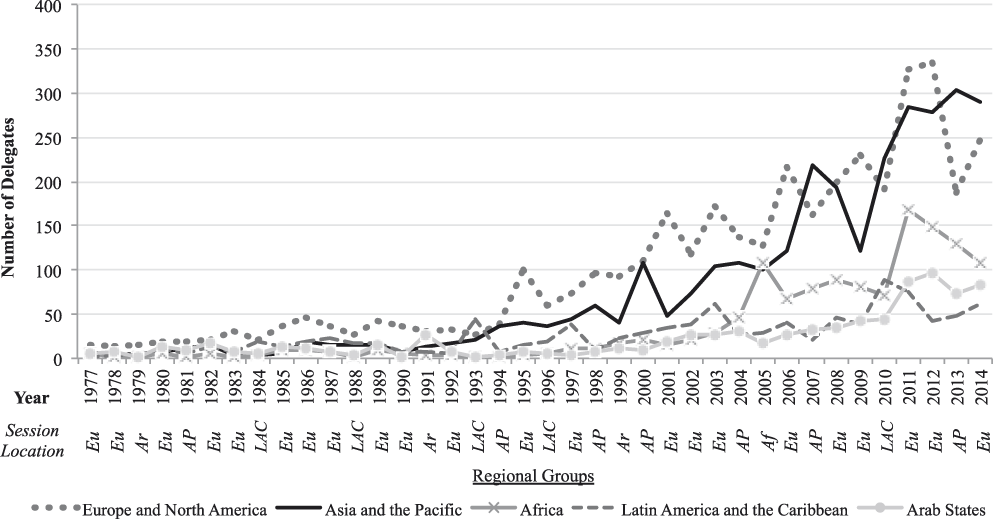
In our analysis, national delegations were tallied together within their regional group for each year from 1977 to 2014 in order to facilitate comparisons in World Heritage participation at a regional scale (Figure 3). For each regional group, there is a rise in delegation size over time. The general increase in participation in World Heritage may reflect changing practices and “politicization,” which necessitates larger delegations for more complex negotiations. This proliferation at the organizational level is underpinned by dynamics at the regional level. The most striking change is the rise of Asia and the Pacific, first coming to prominence in the early 2000s, and then dominance by the late 2000s: it now surpasses the participation of Europe and North America. In four out of the last eight sessions of the World Heritage Committee, Asia and the Pacific has supported the largest regional delegation, the other four seeing a majority from Europe and North America.
Number of delegates sent to the World Heritage Committee Sessions per Regional Group from 1977–2014.
In our examination, we also observed that the location of each annual session had a definite impact on the size of regional delegations in attendance. Each year the World Heritage Committee meeting is held in a different country and regional proximity may affect state participation. Historically, Europe and North America has dominated the World Heritage meetings in regional delegation size regardless of location. However, beginning in 2007 with the 31st session in Christchurch, New Zealand, Asia and the Pacific vies with Europe and North America as the most represented region. Significantly, since 2007, Europe and North America has the most delegates only when meetings are in its own region. Asia and the Pacific has held a majority in meetings held not only within its own region, but also in Latin America and the Caribbean and the Arab States. Indeed, the locations themselves belie the inherent Eurocentrism of World Heritage, as more than half of all Committee meetings have been held in Europe and North America.
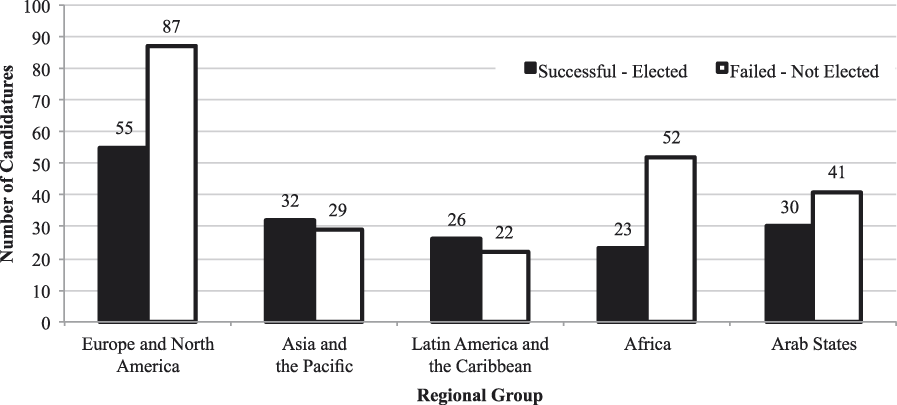
A final indicator in our assessment of World Heritage regionalism is election to the World Heritage Committee. Membership of the Committee is highly sought after, as it is the main decision-making entity in World Heritage and represents a prominent international forum. As confirmed in our ethnographic interviews over the past four years, after a successful election, national governments send professional diplomats with experience in multilateral diplomacy to the UNESCO permanent delegation because they are cognizant of the lobbying and political pressure that is necessarily required. Economic factors are highly influential here too. As Bertacchini and Saccone’s analysis illustrates, the capacity of developed countries to obtain seats in the World Heritage Committee greatly exceeds that of developing countries.Footnote 61 Drawing our data from elections taking place in the General Assembly from 1977 to 2013, we examined the success and failure of States Parties to secure a seat on the Committee in order to understand regional biases in membership (Figure 4).
Success and failure of States Parties’ candidates during elections to the World Heritage Committee by Regional Group from 1978–2013.
There are clear regional differences in the rate of successful election to the World Heritage Committee. Europe and North America leads in overall successes (55 candidates elected), a trend that makes sense both in light of Eurocentric critiques of the World Heritage Committee, but also because it has the most attempts (with 142 candidates from 1978 to 2013). Yet in terms of success rate, it is Asia and the Pacific and Latin America and the Caribbean who lead with 52% and 54% of candidates from these respective regions elected to the Committee. Arab States has a 42% success rate, followed by Europe and North America at 38%. In last place is Africa, with both the lowest number of successful elections (23 candidates elected) and the lowest rate of success at 30%. These results reinforce the trends of European dominance and highlight the crisis in representation on the World Heritage Committee that Africa has experienced in spite of its status as the second largest region with 45 States Parties.
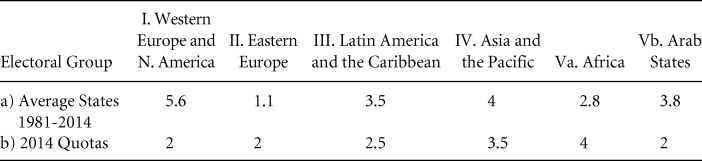
Another way to approach regional representation on the World Heritage is to compile the average number of seats that each region has occupied on the Committee for the period of 1981 (the year in which it became a 21-member Committee), to 2014. Shown in Table 4 by Electoral Group (the only difference being that Europe is split into West and East), these averages illustrate an intense regional imbalance in Committee membership. With the highest average number of seats, Western Europe and North America dominate in terms of representation at 5.6 out of the 21 total seats. The average for Asia and the Pacific follows closely with 4 of 21 seats. The average regional distribution of seats is striking given the 2014 decision to institute quotas for Committee membership (with an additional 5 seats decided by open election), described previously. Institutionalizing representation will have certain impacts on regional influence.
a) Average number of States Parties represented on the (21 seat open election) World Heritage Committee from 1981–2014 by UNESCO Electoral Group; b) regional quotas instituted in 2015 for the restructured (16 quota, 5 open election) Committee
REGIONALISMS: EUROPE AND ASIA
In this discussion we are not referring to “old” regionalisms that focused largely on post-Cold War geographies, but rather on “new” regionalisms such as the recent emergence of ASEAN+3 in East Asia.Footnote 62 Here, regionalism is not simply bound by geographic propinquity or the workings of international capital, but instead is a highly intentional “political process informed by multidimensional economic and strategic factors.”Footnote 63 When comparing Western Europe to East Asia, many commentators would say that there was a greater sense of “regionness” exemplified by formulation of the EU, and indeed European heritage, that transforms and articulates transnational interests. As the setting for the founding of the UN reminds us, there is nothing natural or inevitable about these constructions. Thus the regional can be envisaged as a terrain in between the global and the local: a geographical reality that is spatialized in its transnational deterritorialization and then reterritorialized through a historically constructed geography.
How are these different regionalisms understood and experienced? According to Beeson, the foundations of European integration are to be found in the rather mundane and technocratic negotiations for post-war economic reconstruction and integration, albeit sutured to U.S. economic security and capitalist expansion.Footnote 64 Economic unification was considered one way to avoid another major war in Europe. For example, since their economies were integrated through the European Coal and Steel Community (ECSC), France and Germany would not have the means to enter into war with each other.Footnote 65 Postwar international projects created a new array of intergovernmental organizations designed to institutionalize a new liberal order, of which UNESCO must surely be one. Yet the successes of the EU should not elide the precarious context of that history or presuppose the inevitability that a united group of capitalist democracies might come to dominate Western Europe. Even more remote was the possibility that former enemies Germany and France might form the central pillars of such a deeply institutionalized organization.Footnote 66
In the framework of UNESCO World Heritage, there exists an intermediary level of organization between States Parties and regional group, which is the sub-regional group. Approximating the internal dynamics of regions in terms of their constituent sub-regions increases the resolution of our analysis of trends in World Heritage involvement across time. As we have illustrated, not all States Parties within a given regional group operate alike in terms of inscription activity or participation in Committee sessions. This internal variation can be highlighted and better understood at the sub-regional scale.
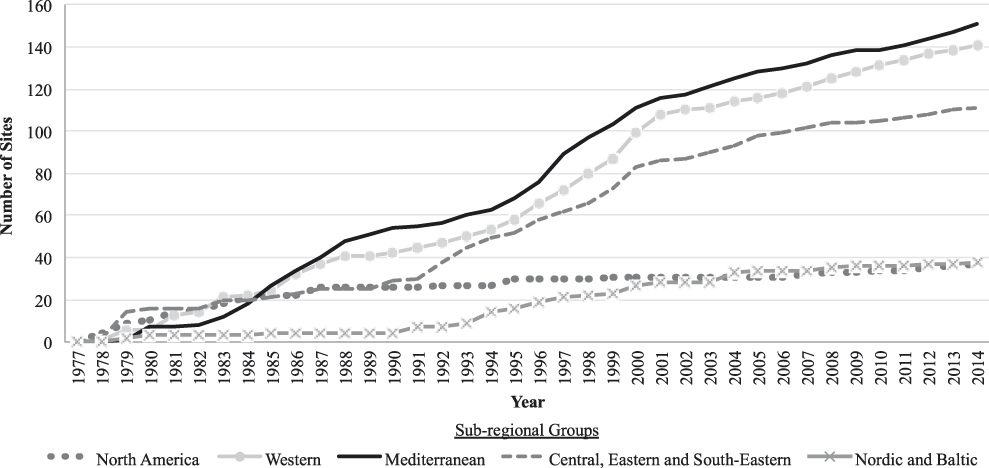
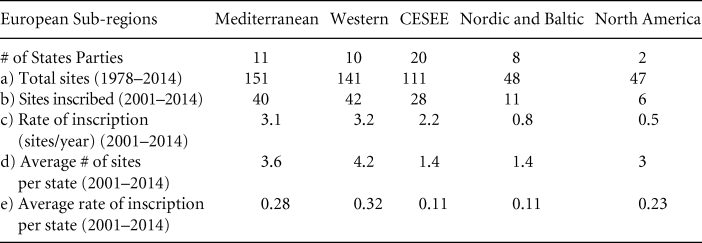
The primary facet of World Heritage in which sub-regional groups are taken into account is its system of Periodic Reporting on the application of the World Heritage Convention. Envisioned as a mechanism to promote regional cooperation and exchange of information and experiences between States Parties,Footnote 67 this series of official reports provides an assessment of the state of World Heritage for each regional group, but at the level of its sub-regional groups. For the purposes of the Second Cycle of Periodic Reporting, Europe and North America was divided into five sub-regional groups: “North America” (2 states), “Western” (10 states), “Mediterranean” (11 states), “Central, Eastern, and South-Eastern” (CESEE) (20 states), and “Nordic and Baltic” (8 states).Footnote 68 In assaying site inscription activity on a sub-regional scale for the five groups comprising Europe and North America, one achieves a clearer understanding of how European regionalism functions within the larger World Heritage framework (Figure 5, Table 5).
Cumulative number of sites inscribed on the World Heritage List by European Sub-regional Groups from 1977–2014.
European sub-regional inscription profiles. Number of sites inscribed on the World Heritage List a) from 1978–2014, b) from 2001–2014; c) average rate of site inscription (sites/year) to the List for 2001–2014; d) average number of sites inscribed per state from 2001–2014; e) average yearly rate of inscription per state (sites/year/state) for 2001–2014
Looking at European inscription to the World Heritage List, it becomes immediately apparent that the Mediterranean and Western European sub-regional groups have dominated historically, and continue to do so both in terms of numbers of sites inscribed on the List, and rates of inscription. With dominant nations like Spain and Italy in Mediterranean, and France and Germany in Western, it is not surprising that these two groups rank first and second in inscription activity. At first glance, CESEE’s place in third, far above Nordic and Baltic and North America, suggests its relative significance within the European regional group. However, one has to factor in the vast advantage the CESEE sub-region has in the number of States Parties (20) compared to Nordic and Baltic (8) or North America (2). In fact, for the period of 2001 to 2014, CESEE and Nordic and Baltic have shown similarly low levels of activity in both average rate of inscription per State Party and average number of sites inscribed per State Party, while North America ranks third.
The dominance of Western and Mediterranean Europe in World Heritage has been clearly illustrated with the intense inscription activity of those two sub-regions. However, their impact is also evinced by the cultural influence that these groups exert beyond their own borders. Reyes concurs in her observation that “the construction of symbolic wealth is heavily dominated by just two countries: Italy and Spain” and to a lesser extent France.Footnote 69 Coding each cultural site’s World Heritage description for words referencing Italian, Spanish, and French influences, and excluding sites within France, Greece, Italy and Spain, Reyes found that “31% (166 of 536) of the remaining cultural sites indicated an Italian influence in their site descriptions, while 10% (51) were influenced by Spain.” She goes on to assert that “clearly, the distribution of World Heritage cultural sites across both cultural regions and countries masks their content, since two or three countries have a worldwide impact on local cultural values. Sites considered to have ‘outstanding universal value’ are those inspired by Italy, Spain, and France.”Footnote 70
Charting inscription activity from 1978 to 2014 in Figure 5 also reveals the impact of significant historical events on European regionalism during the early 1990s within the World Heritage Program. With the end of the Cold War in 1991, CESEE and Nordic and Baltic sub-regional groups, both comprised in part by former Soviet states, experienced a dramatic increase in their inscription rate that continued for the next decade. Western and Mediterranean sub-regions similarly experienced a shift in World Heritage activity at this point, and after 1991 both exhibit exponential growth in inscriptions. The next major shift in inscription activity, visible across all European sub-regions, occurs in 2001 with the Cairns Decision. The interim decade, however, represents a period of significant involvement in the World Heritage arena, not just in Europe but also in Asia.
In Europe, the end of the Cold War served to spur to regional cohesion, while in East Asia it removed the single most important obstacle to regional integration. For example, the withdrawal of Vietnamese forces from Cambodia created a new environment for the conduct of international and regional affairs. The concomitant rehabilitation and growing economic importance of China has removed another critical impediment.Footnote 71 The pivotal historical importance of China in the overall region is revealed by its capacity to shape political and strategic relations even while not directly participating in them.Footnote 72 This is paralleled in the World Heritage arena with China’s dominance, in the number of inscribed World Heritage sites, membership of the World Heritage Committee, and numbers of delegates in attendance at annual meetings.Footnote 73
Though perhaps more difficult to define than for Western Europe, Asian regionalism is characterized by immense diversity in terms of geography, social composition, history, politics and economics. For example, the multiplicity of colonial experiences only served to emphasize the differences among the countries and societies of Asia.Footnote 74 That being said, Asian nations today tend to share a commitment to sovereignty, territorial integrity, and non-interference in the affairs of other countries and an informal, non-confrontational approach to negotiation, sometimes referred to as informal or soft regionalism.Footnote 75 East Asia is becoming an increasingly coherent region due to various integrative economic, political, and socio-cultural processes.Footnote 76 Some commentators argue that the communitarian instincts of state leaders reinforce a particular level and form of cooperation that seeks to overcome the fissures that potentially divide societies and countries in Asia.Footnote 77 Others suggest that Asian regionalism tends to be more culturally articulated as opposed to economic as in North America or political as with Europe.Footnote 78 In this section we focus on the socio-cultural regionalism that is being established through the world-making processes of UNESCO World Heritage.
As with the Europe and North America regional group, Asia and the Pacific is divided into sub-regional groups for the purposes of Periodic Reporting on the application of the World Heritage Convention. The sub-regional groups employed are “West and Central” (7 states), “South” (7 states), “North-East” (5 states), “South-East” (10 states), “Pacific Island States” (12 states), and “Australia and New Zealand” (2 states).Footnote 79 In order to draw out trends in Asian regionalism, we conducted comparisons along these sub-regional lines for the inscription of sites and the size of delegations sent to the annual Committee meetings.
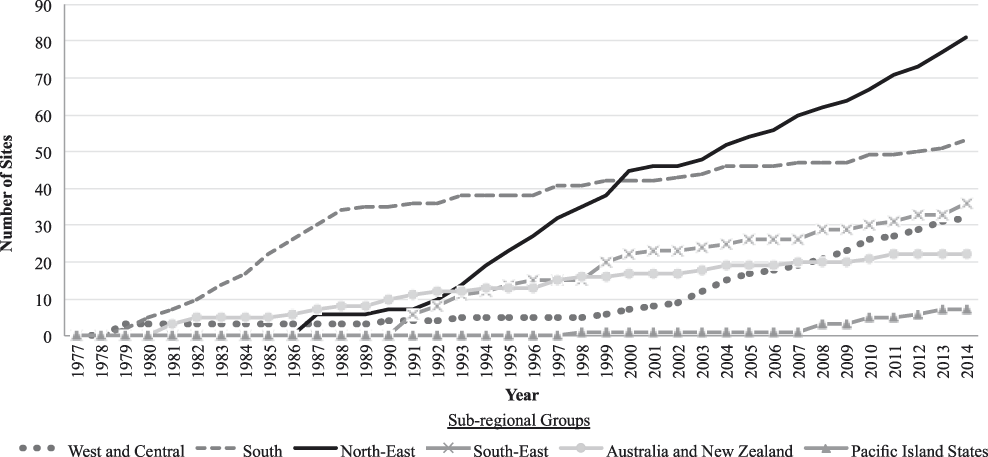
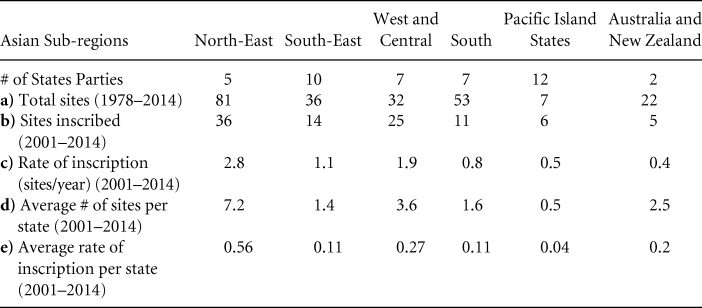
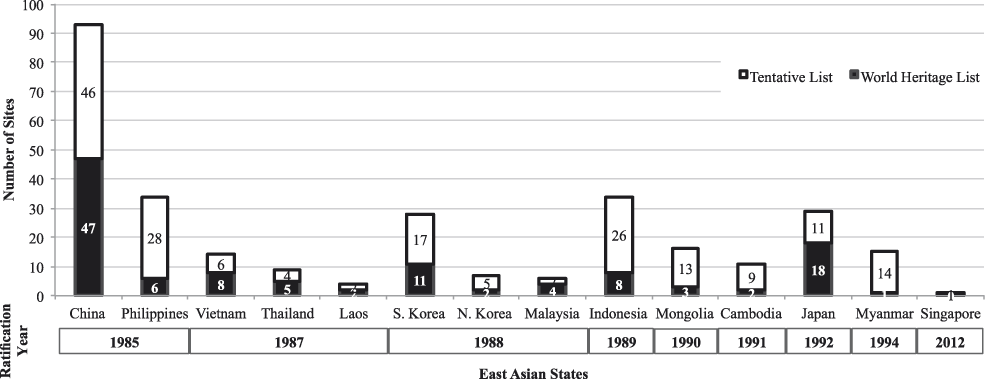
Inscription activity from 1978 to 2014 of Asian and Pacific sub-regional groups is displayed in Figure 6 and Table 6. While the early dominance of South Asia on the World Heritage is striking, it is the consequence of the rather late ratification of the World Heritage Convention in East Asia. As Figure 7 illustrates, no East Asian state had ratified the Convention until 1985, with China and the Philippines, and it was not until the early 1990s that most of East Asia had ratified. In 1987, China successfully put forward one mixed site and five cultural properties, but it was not until 1991 that the first sites from South-East Asia were inscribed, one in Thailand and another in Indonesia. From 1991 onwards there is a steady increase in East Asian inscriptions. This contrasts with West and Central and South Asian sub-regional groups, which have inscribed sites since the late 1970s. In 1999, North-East Asia surpassed South Asia for greatest number of sites on the List, and currently leads as of 2014 with 81 sites.
Cumulative number of sites inscribed to the World Heritage List by Asian Sub-regional Group from 1977–2014.
Asian sub-regional inscription profiles. Number of sites inscribed on the World Heritage List a) from 1978–2014, b) from 2001–2014; c) average rate of site inscription (sites/year) to the List for 2001–2014; d) average number of sites inscribed per state from 2001–2014; e) average yearly rate of inscription per state (sites/year/state) for 2001–2014
Ratification year and number of sites on the World Heritage List and the Tentative List for East Asian States.
Within the Asia and the Pacific regional group, North-East Asia is by far the dominant sub-regional group in terms of inscription activity. Including States Parties like China with 47 total sites, Japan with 18, and South Korea with 11, this sub-region is characterized by its intense activity on the World Heritage List, with an average rate of inscription of 2.8 sites/year for the period of 2001 to 2014. West and Central Asia has the second highest rate of inscription with 1.9 sites/year for 2001 to 2014, which can largely be attributed to Iran having inscribed 15 sites from 2001 to 2014. South-East Asia is third with 1.1 sites/year for 2001 to 2014, followed by South Asia with .8 sites/year, Pacific Island States with .5 sites/year, and Australia and New Zealand with .4 sites/year.
When corrected for the number of States Parties within each sub-region, North-East and West and Central maintain their ranking as first and second most active, while South-East and South Asia actually tie for fourth with an average of .11 sites per state per year for 2001 to 2014. The Australia and New Zealand sub-regional group is third most active, primarily because their sub-region consists of just two countries, and the Pacific Island States is last. The plight of the Pacific Island States, many of which have only ratified the World Heritage Convention in the 2000s, has prompted UNESCO to create of a number of strategies to rectify the situation, such as the Pacific 2009 Programme and the Pacific World Heritage Action Plan (2010–2015).Footnote 80
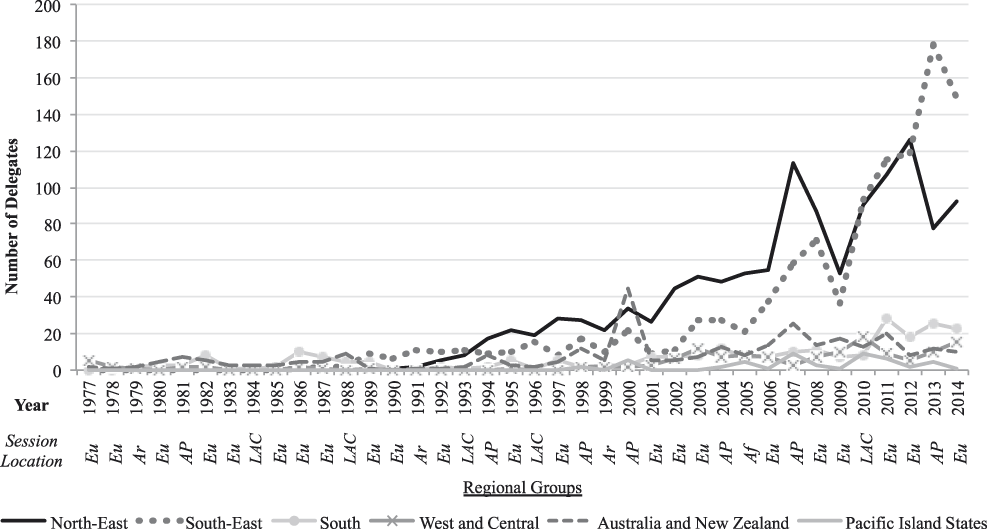
When sub-regional trends are analyzed for Asia and the Pacific along the lines of delegation size rather than site inscription, a very different distribution arises. Figure 8 illustrates the size of sub-regional delegations sent to the World Heritage Committee from 1977 to 2014. Here, the North-East and South-East sub-regions are the key players in terms of Asian participation. Up until 2010, North-East Asia held a majority. However, throughout the 2000s the participation of South-East Asia rose, actually surpassing North-East Asia by 2010. Indeed, in four out of the last five sessions of the World Heritage Committee, South-East Asia has been the most represented Asian sub-region. While North-East and South-East Asian delegations have dramatically increased in size, the participation of the other four sub-regions of Asia and the Pacific has remained relatively low. This disjuncture between inscription activity and delegation size reveals the variation in World Heritage strategies and conditions characterizing sub-regions. While North-East Asia sees high inscription and high participation, South-East Asia sees low inscription and high participation, West and Central Asia sees high inscription and low participation, while South Asia sees low inscription and low participation.
Number of national delegates (Committee members and observers) sent to World Heritage Committee Sessions per Asian Sub-regional Group from 1998–2014.
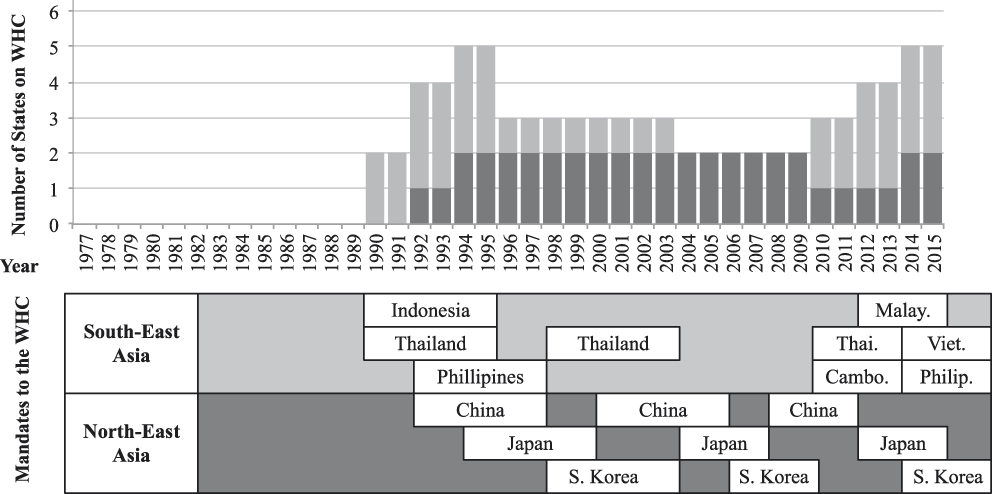
The historic dominance of North-East Asia and the current dynamism of South-East Asia are also reflected in the mandates both sub-regional groups have held on the World Heritage Committee. These mandates and an overall tally for East Asian seats on the World Heritage Committee from 1977 to 2015 are shown in Figure 9. East Asian involvement on the World Heritage Committee begins only in the early 1990s, but has persisted and, in recent years, grown. We have also observed the centrality of World Heritage in the political economy of Asian nations in our observations within the World Heritage Committee meetings. Garnering World Heritage inscription does more than ensure tourist revenues or economic development, as underlined by the examples of Cambodia and Myanmar in the next section.
Number of East Asian States on the World Heritage Committee from 1977–2015 and World Heritage Mandates for North- and South- East Asian States.
A View from Southeast Asia
Given the quantitative patterns above, it might prove instructive to supplement these findings with evidence from our ethnographic interviews. During lengthy meetings with members of Asian delegations to UNESCO at their Paris offices, we discussed the importance of World Heritage in Asia. Ambassadors and other diplomats described how they saw their role as supporting other Southeast Asian nations, especially when on the Committee, a tendency also noted by members of the UNESCO Secretariat. Our informants uniformly talked about the importance of the “the [World Heritage] brand”, national pride, international recognition, and development opportunities. But many were also quick to identify the pitfalls of global tourism that accompany inscription and subsequently impinge upon site conservation.
When asked about the recent interest in Asian World Heritage, one diplomat explained that it was about getting known and “being visible” on the world stage. Inscription brings international funding, support, and training. Other officials described participation in the World Heritage arena, from site inscription to Committee membership, as being tied to ASEAN principles, the role of emerging nations, Asian identity, global branding, and economics. Speaking about the importance of a major archaeological site now being prepared for nomination, one ambassador said it did not simply belong to his country, but “to the world.” On the other hand, some ambassadors were keen to point out that they already had expertise at home and saw Committee membership as an opportunity to share their own technical expertise. Speaking with great pride, one official, trained as an economist, spoke of his delegation’s preparedness and training in natural and cultural heritage and recounted the numerous requests for regional assistance he had received. Being on the Committee was a positive statement for his country, to learn further, to show their skills, to be visible, and to be able to benefit broadly.
The importance of visibility and recognition can further be demonstrated by two high-profile Asian World Heritage nominations from Myanmar and Cambodia. In 2014 Myanmar had its first property, Pyu Ancient Cities, inscribed on the World Heritage List with strong regional support from Malaysia, the Philippines, India, Japan, and Vietnam. The ICOMOS expert recommendation to defer the site was over-turned. Most delegates spoke about the Pyu Cities being important because it was Myanmar’s first World Heritage nomination, rather than addressing its archaeological merits. The Committee’s decision to inscribe had much to do with Myanmar’s participation in world government, its nascent democracy and development, and the timing of this international recognition. Malaysia opened the discussion by connecting Pyu to Angkor (Cambodia) since both are extraordinary examples of Buddhist architecture in South East Asia.Footnote 81 However, the arguments supporting Myanmar’s nomination as its first inscription and its timing in connection with the country’s nascent democracy, reveal another interesting parallel with Cambodia.
Angkor’s inscription in the World Heritage List in 1992 is considered the culmination of a long international diplomatic struggle linked to the recognition of Cambodia’s new legitimate government.Footnote 82 After the Vietnamese invasion of Cambodia in 1979, the Khmer Rouge was driven out of the country and the People’s Republic of Kampuchea (PRK) was established.Footnote 83 In the period that followed (1979–1989), Angkor formed the center of competing political narratives by both the Vietnamese backed PRK and the exiled, but UN recognized, Khmer Rouge regime (Democratic Kampuchea, DK).Footnote 84 During the Khmer Rouge regime, Angkor had suffered from neglect and decay,Footnote 85 prompting an illicit international trade in artifacts.Footnote 86 However, the regime appropriated UNESCO’s rhetoric and adopted a new political mission framed as saving Angkor from the Vietnamese, all in the name of humanity.Footnote 87 As Falser has argued, the exiled Khmer Rouge, through the Permanent Delegation of the Democratic Kampuchea at UNESCO, invented the notion of Angkor as World Heritage and used it to regain territorial control of Cambodia.Footnote 88 The 1989 peace negotiations in Jakarta enabled UNESCO to send an official fact finding mission with the approval of Prince Sihanouk. In the same year Hun Sen, the prime minister of PRK, also requested assistance from UNESCO for international cooperation in Angkor.Footnote 89 Given the embargo on non-humanitarian assistance, however, no in-country project could begin before the 1991, when the Comprehensive Political Settlement of the Cambodian Conflict was signed in Paris.Footnote 90 In 1991 UNESCO Director General Federico Mayor made his first official visit and launched an international campaign to save Angkor, a UNESCO office was opened in Phnom Penh and Cambodia ratified the World Heritage Convention.Footnote 91
The following year, Angkor was inscribed in the World Heritage List and placed on the World Heritage List in Danger.Footnote 92 The Committee, noting the exceptional situation of Cambodia and the need to take urgent action for the protection of the site,Footnote 93 decided to waive their concerns about management and conservation. However, they warned “this action should not be taken as setting a precedent for future inscriptions but as a response to a unique situation.”Footnote 94 UNESCO’s involvement in “saving” Angkor first, and in inscribing it on the World Heritage list in 1992 became integral parts of the process that allowed Cambodia to be legitimately reintegrated into the international community.Footnote 95
Looking forward to Myanmar’s Pyu Ancient Cities, it offers another example of the entanglements between World Heritage inscription and international recognition. Myanmar ratified the World Heritage convention in 1994 and submitted its first properties on the Tentative List in 1996. The Bagan Archaeological Area and Monuments was proposed as the country’s first nomination that same year.Footnote 96 However the Bureau decided to “defer further consideration of this nomination” because of concerns over legal protection and boundaries that impacted the site’s authenticity and integrity.Footnote 97 Similar to Angkor in Cambodia, the management of Bagan has been framed around criticisms of Myanmar’s military regime.Footnote 98 In turn, the military has adopted a legitimizing discourse based on its own association with Bagan’s ancient glory. However, unlike Cambodia, Myanmar’s military has decided to take charge of the restoration.Footnote 99 In both cases, these nations have harnessed UNESCO’s conservation mission and the international community’s willingness to cooperate, whether over heritage or democracy, for their own political ends.
Myanmar’s new civilian government took charge in March 2011 and in 2012 European Union sanctions were lifted, enabling international activities to shift from an emergency basis to long-term approaches that promoted development.Footnote 100 Italy, for example, took a leading role in preserving cultural heritage focused largely on the Pyu Cities and Bagan. UNESCO claims that these efforts have already paid off in the first inscription in 2014, and has paved the way for the future nomination of Bagan.Footnote 101 Obviously Myanmar is not an isolated case, but along with Cambodia, it provides a salient example of where World Heritage inscription is a reward that intersects with economic and political imperatives of the international community. World Heritage is increasingly important for leveraging international recognition, for “being seen” to be part of a world community and for transitioning out of isolation: an effective strategy pursued by these two Southeast Asian nations.
CONCLUDING REMARKS
From its inception, UNESCO has been an organization that creates and reinforces regions, despite the fact that these geographies are often politically crafted and imagined. As recent controversies over World Heritage Committee membership have underlined, such regionalisms have political consequences: the entire African continent continues to be sidelined within World Heritage decision-making despite UNESCO designating the region a priority. In this article we demonstrate the ways in which “Europe and North America” continues to dominate World Heritage notwithstanding UNESCO’s many efforts and initiatives such as the Global Strategy and upstreaming processes. Moreover, our analysis seeks to further nuance this picture, by highlighting with finer resolution the sub-regions and States Parties constituting the most active and influential players. Given these findings, it is striking that regionalism has largely been overlooked as a category of world-making in this context, typically eclipsed by the more obvious imperatives of nationalism coupled with the aspirations of internationalism and indeed even “universalism.”
Yet how can World Heritage be understood as constituting a global patrimony that purports to showcase “outstanding universal value” when participation and power continue to be so imbalanced? Indeed, our findings reveal that in 2014 some 40% of signatory nations had no representation at the World Heritage meetings. We extend this examination back in time, tracing the numbers of delegates for each nation as a proxy for power and influence within World Heritage decision-making. Participation is also clearly connected to the possibilities of involvement and influence in the World Heritage Committee itself, being successfully elected as a new member, and the necessary lobbying for support now commonplace. As other scholars have documented, along with the much sought-after Committee member status comes enhanced abilities for States Parties to have their own sites inscribed on the List. As the main decision-making entity within World Heritage, Committee membership confers considerable prominence not only at UNESCO, but also across other high-profile UN platforms.
Our research underlines the regional trends in World Heritage inscriptions from 1977 to 2014, showing that of the 1007 sites listed, 48% are from “Europe and North America.” However, our results signal another trend that we have witnessed during participant observation at World Heritage Committee meetings, namely the increasing role and participation of “Asia and the Pacific.” This group retains 23% of the List and follows “Europe and North America” in regional dominance. But here too we are careful to evaluate the number of States Parties that comprise a regional grouping and we are attendant to sub-regional trends within the broader groupings. While there are numerous, sustained critiques of the World Heritage system for its Eurocentrism and global imbalance, few studies have attempted to chart and analyze long-term trends or conduct fine-grained comparative analyses.
North American and European States Parties have been instrumental in the early crafting of both UNESCO and the World Heritage Convention and have secured the largest tally of sites through a historic dominance. However, these victors of the post-war era and the architects of the UN system increasingly face difficulty in securing international agreements. They have more often become the targets in forums like World Heritage, regularly criticized for their historical dominance, elitism, and outmoded priorities. Additionally, economic globalization and the rise of new players such as China, India, and Brazil, have altered the ability for states to always effectively cooperate multi-laterally. Our observations at World Heritage Committee meetings confirm that emerging nations increasingly want to set the agenda and control negotiations, and that they have, in recent years, been extremely effective in this pursuit.
Today World Heritage recognition and branding symbolizes far more than site protection, indeed conservation and management issues are increasingly marginalized. Listing provides an index of other, wide-ranging concerns that reinforce modernity and good governance, international legitimation, tourism and development, political and economic partnerships, and so on. Our examples drawn from Cambodia and Myanmar demonstrate the wider effects of World Heritage participation and listing at precise and expedient political moments. A new suite of states, particularly Asian nations that now comprise approximately one third of the World Heritage Committee, is thus reframing the centrality of heritage. New Committee members, with their own political commitments, are systematically challenging prevailing “Western” notions of monuments and their management, as the role and understandings of World Heritage is refashioned to serve expansive, contemporary, and more inclusive global goals. Being attendant to regionalism, how it has been constructed by international agencies, and how it is being performed today is key in understanding current developments in the World Heritage arena.
ACKNOWLEDGEMENTS:
We would like to thank our colleagues at the World Heritage Center, ICOMOS, ICCROM, and the IUCN as well as the many national delegations who have taken time to meet with us. Lynn Meskell would like to acknowledge Keble College, Oxford University where she was Senior Research Visitor and the American Academy in Rome where she was Senior Scholar in Residence. Her fieldwork was also supported under the Australian Research Council’s Discovery scheme (The Crisis in International Heritage Conservation in an Age of Shifting Global Power - DP140102991). Claudia Liuzza wishes to acknowledge fieldwork support from the France-Stanford Center for Interdisciplinary Studies, The Europe Center and the Freeman Spogli Institute for International Studies at Stanford University, and the Stanford Archaeology Center. We also thank Alex Bauer and two anonymous reviewers for their helpful suggestions on this paper.