I. INTRODUCTION
Li-ion batteries, as power sources for mobile communication devices, electrical/hybrid vehicles, and portable electronic devices, have been receiving great attentions due to their high electromotive force and high energy density. Currently, graphite is a common anode electrode material because of its reversibly charged and discharged capability under intercalation potentials. Reference Paek, Yoo and Honma1,Reference Buqa, Goers, Holzapfel, Spah and Novák2 Thus, with the increasing demand for batteries with higher energy density, the practical application of graphite is hindered due to its limited theoretical capacity (372 mAh/g). Therefore, extensive works are being focused on exploring new electrode materials. Reference Akl, Trofymluk, Qi, Kim, Osterloh and Navrotsky3–Reference Kim, Hwang, Kwon, Kang, Park, Choi, Choi and Park6 Tin oxide (SnO2) is a good substitute for the graphitic anode in Li-ion batteries because its high theoretical Li+ storage capacity of 782 mAh/g, which is nearly 3 times that of graphite. However, similar to other lithium reactive electrode materials, very large volume change of about 300% is produced during charge/discharge process of SnO2, which causes cracking and crumbling of electrode, leading to electrical disconnection from current collectors. Reference Wang, Lee and Zeng7–Reference Fan, Wang, Yu, Tu, Jiang and Zhao10 Consequently, SnO2 electrode suffers from rapid fading of capacity and its fading rate is 5–10 times that of graphitic electrode.
To circumvent these problems, hybrid of oxide and graphitic materials are one of the promising alternatives as Li-ion batteries anode, which have been proved effective methods. Reference Wen, Wang, Zhang and Li11–Reference Wang, Zeng and Lee17 Among the graphitic materials, graphene has attracted considerable attentions as substrate materials with unique properties such as superior electrical conductivities, high surface area of over 2600 m2/g, chemical tolerance, and a broad electrochemical window. Reference Li, Wang, Zhang, Lee and Dai18–Reference Gilje, Han, Wang, Wang and Kaner22 Very recently, SnO2/graphene composites with three-dimensionally delaminated flexible structure were prepared by mixing SnO2 hydrosol and graphene nanosheet dispersions, and its nanoporous electrode was made to enhance cyclic performance and lithium storage capacity. Reference Li, Tang and Li14 SnO2/graphene nanocomposite electrodes were also prepared by a surfactant directed self-assembly method, and its Li-ion insertion properties for energy storage were studied. Reference Wang, Kou, Choi, Yang, Nie, Li, Saraf, Hu, Zhang, Graff, Liu, Pope and Aksay15 Despite these recent achievements, it is difficult to load metal oxide nanoparticles on the graphene surface because a pure graphene layer has not homogeneously distributed functional groups on its surface to control the dispersion state and further provide growing points for metal oxide nanocrystals. Furthermore, graphene sheets tend to form irreversible agglomerates or even restack to form graphite through van der Waals interactions in the previous progress, thus forming composites with multilayer graphene in them, which may be induced to losing of their high surface area and intrinsic chemical and physical properties.
Herein, we report an in situ chemical synthesis of SnO2 nanocrystals directly on exfoliated graphite oxide in ethanol solution. In this progress, oxygenated groups on graphene oxide can not only resist restacking of graphene oxide sheets, but also absorbed Sn4+ through electrostatic force, thus forming homogeneously distributed SnO2 nanoparticles on the reduced graphene oxide surface. Meanwhile, graphene oxide can be reduced by SnCl4 in alkaline ethanol solution. In addition, the improvement reason of their electrochemical performance as anode materials in lithium-ion batteries was also studied.
II. EXPERIMENTAL
A. Synthesis of SnO2/reduced graphene oxide composites
Prior to synthesis of SnO2/reduced graphene oxide composites, graphene oxide sheets were synthesized from natural graphite powder by a modified Hummers method. Reference Sun, Li, Xu, Bai, Yao and Shi23 For comparison, the pure reduced graphene oxide sheets used in the electrochemical measurement were prepared by calcining the synthesized graphene oxide sheets at 500 °C for 2 h in nitrogen atmosphere. SnO2/reduced graphene oxide composites were prepared by hydrolysis of SnCl4·5H2O in ethanol solution. In a typical procedure, 0.275 g of cetyltrimethyl ammonium bromide (CTAB) was dissolved in 30 mL ethanol solvent at room temperature to form a homogeneous and clear solution. Then, 50 mg dried graphene oxide was dispersed in the solution with ultrasonic treatment to form colloidal suspension. Subsequently, 40 mg of sodium hydroxide (NaOH) was added into the above suspension under continual stirring. Afterward, 0.175 g of tin (IV) chloride pentahydrate (SnCl4·5H2O) was slowly added to the above mixture under vigorous stirring, and the mixture was then continually stirred for 1 h. At last, the mixture was transferred to a 100 mL Teflon-lined stainless steel autoclave and kept at 160 °C for 15 h. The final precipitates were rinsed with absolute ethanol and deionized water for several times until all soluble materials were removed. The final products were collected for characterization and electrochemical measurement after drying at 60 °C. To investigate the effect of the solvent, the SnO2/reduced graphene oxide composites were prepared by replacing the 30 mL ethanol solvent with 30 mL pure water or mixture of water and ethanol (1:1 by volume). For comparison, pure water was used as the solvent following the same procedure. Additionally, SnO2 nanoparticles used in the electrochemical measurement were synthesized according to the literature. Reference Yang, Hu, Tang, Jin and Qiu24
B. Characterizations
X-ray powder diffraction (XRD) patterns were obtained on the Japan Rigaku D/max-2550 instrument operating at 40 kV and 40 mA using Cu Kα radiation (λ = 0.154 nm), scanning range 2θ was from 10° to 80°. The structural properties and morphology of the products were studied by transmission electron microscopy (TEM, JSM-2010F), high-resolution transmission electron microscopy (HR-TEM, JSM-2010F), scanning electron microscopy (SEM, Quanta400FEG), electron energy disperse spectroscopy (EDS, OXFORD INCA), and Fourier transform infrared spectrometer (FTIR, AVATAR 370). Raman spectra of samples were recorded using a Renishaw (INVIA) system with the excitation wave length of 785 nm and charge-coupled device detector. Thermogravimetric (TG) analysis was carried out with a STA 409 PC/4/Hluxx system at the heating rate of 10 °C/min in the flow of air. Atomic force microscopy (AFM) images were obtained by using a SPM-9600 (Shimadzu, Japan). The substrates used for AFM imaging were freshly cleaved mica substrates. X-ray photoelectron spectroscopy (XPS) measurements were performed on an AXIS ULTRADLD (Kratos) using monochromatic Al Kα x-ray source (Anode HT = 15 kV) operating at a vacuum better than 10−7 Pa. Kratos Vision v 2.2 software was utilized to analyze and deconvolute the XPS peaks.
C. Electrochemical measurement
As-prepared SnO2/reduced graphene oxide composites and bare SnO2 nanoparticles were mixed with binder [polytetrafluoroethylene (PTFE)] and carbon black, at the weight ratio of 80:10:10 in isopropanol solvent to form slurry. Then, the resultant slurry was uniformly pasted on Cu foil substrates. The as-prepared electrode sheets were dried at 80 °C in a vacuum oven for 12 h and pressed under a pressure of 15–20 MPa. Then, the cell was assembled in a glove box filled with argon gas. A mixture of dimethyl carbonate (DMC), diethyl carbonate (DEC) and ethylene carbonate (EC) (1:1:1 by volume) was used as the electrolyte and lithium metal was used as the counter/reference electrode. Discharge/charge testing was carried out on LANDCT200/A cell test system with a current density of 50 mA/g in the range of 0.005–2.0 V. The electrochemical measurement of pure reduced graphene oxide sheets was followed by the same procedure except without addition of carbon black, and the weight ratio of reduced graphene oxide sheets to PTFE was 80:20.
III. RESULTS AND DISCUSSION
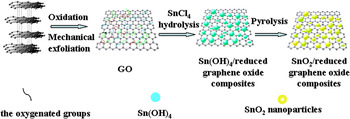
The diagram of the chemical route to the SnO2/reduced graphene oxide composites is displayed in Fig. 1. First, graphene oxide sheets were synthesized by mechanical exfoliation of graphite oxide. Then, as-synthesized graphene oxide sheets were dispersed in the SnCl4 solution without reduction. On the one hand, the oxygenated groups on graphene oxide sheets could increase the affinity of Sn4+ to graphene oxide sheets through electrostatic force and further provide more growing spots for SnO2 crystal, thus leading to form more homogeneously distributed SnO2 nanoparticles on graphene oxide sheets. On the other hand, the oxygenated groups on graphene oxide sheets could resist restacking of graphene oxide sheets, solving the main problems in graphene application. Moreover, graphene oxide sheets could be partially reduced to graphene sheets during the reaction process.
Diagram of the in situ chemical route to the SnO2/reduced graphene oxide composites.

To further confirm the function of oxygenated groups on graphene oxide sheets, TEM image of SnO2/reduced graphene oxide composites synthesized with 500 °C pyrolysis reduced graphene oxide sheets was shown in Fig. S1. As can be seen, the synthesized SnO2 nanoparticles combined badly with graphene oxide sheets and tend to agglomerate.
A. The physicochemical properties of products
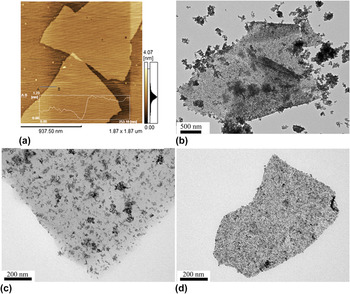
Through experiment verification, it was found that the solvent plays a key role in the formation of final products. Figure 2(a) presents AFM image of as-prepared graphene oxide. The scanned height profile of the graphene oxide sheet is approximately 1 nm, indicating the single layer feature of the graphene oxide sheets. Figures 2(b)–2(d) show TEM images of SnO2/reduced graphene oxide composites synthesized with pure water, mixture of water and ethanol (1:1 by volume), and ethanol, respectively. When pure water was used as a solvent, the obtained SnO2 aggregated into bulk and most of which were not on the reduced graphene oxide surface. Alternatively, when using ethanol as a solvent, all synthesized SnO2 have grown on the reduced graphene oxide surface, and the obtained SnO2 nanoparticles are more uniform and smaller in size than that prepared with water–ethanol mixed solvent. This can be explained as follows: by changing the solvent of water to ethanol there is a strong decrease in the interfacial tension between the reduced graphene oxide and the solvent. Similarly, the free surface energy of the nanoparticles changes and is minimized by growing on the surface of graphene oxide. The results indicate that the ethanol solvent is favorable for the uniform growth of SnO2 nanoparticles.
TEM images of (a) graphene oxide and SnO2/reduced graphene oxide composites synthesized with various solvents: (b) pure water, (c) mixture of water and ethanol (1:1 by volume), and (d) ethanol.

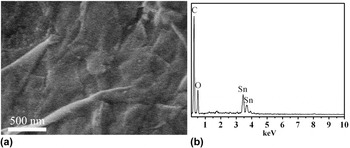
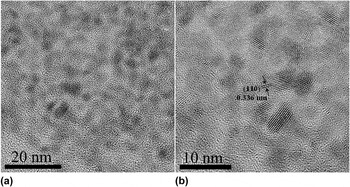
The morphology of the SnO2/reduced graphene oxide composites prepared with ethanol solvent was observed by SEM image. As seen from Fig. 3(a), reduced graphene oxide nanosheets appeared to corrugate into a wavy shape and SnO2 nanoparticles were uniformly coated on wrinkled reduced graphene oxide. Figure 3(b) presents EDS spectra of the products, which obviously shows O peak, Sn peaks at about 3.46 keV, 3.68 keV corresponding to SnLa1, SnLb1, respectively, and a strong C peak deriving from reduced graphene oxide is observed at about 0.27 keV, indicating the products are composed of C, O, and Sn elements. Reference Wen, Wang, Zhang and Li11 The crystalline structure of the SnO2/reduced graphene oxide nanocomposites can be further analyzed by HRTEM image. From Fig. 4(a), SnO2 nanoparticles are uniformly distributed on 2D reduced graphene oxide nanosheets and the average size of SnO2 particles can be determined to be about 3–4 nm. Figure 4(b) presents a lattice-resolved HRTEM image of the SnO2/reduced graphene oxide nanocomposites, in which (110) crystal planes of the SnO2 tetragonal structure can be clearly identified from the interplanar distance of 0.336 nm.
(a) SEM image and (b) EDS spectra of SnO2/reduced graphene oxide composites synthesized with ethanol solvent.

(a) HRTEM image and (b) lattice-resolved HRTEM image of SnO2/reduced graphene oxide composites synthesized with ethanol solvent.

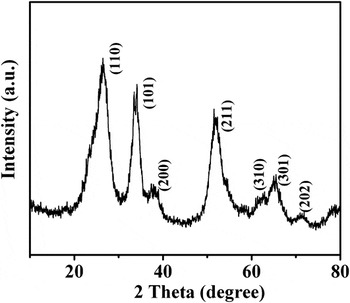
The crystal phase and structure of SnO2/reduced graphene oxide composites were investigated using x-ray diffraction. Figure 5 shows the XRD pattern of the SnO2/reduced graphene oxide composites prepared with ethanol solvent, which can be well indexed as the tetragonal SnO2 with cassiterite structure (JCPDS Card No. 41-1445). The main diffraction (110), (101), (200), (211), (310), (301), and (202) peaks present and no impurities were observed, implying the absence of amorphous phase SnO2, SnO, and orthorhombic SnO2. It is worth mentioning that the broad diffraction peaks of the SnO2 indicate small crystal size, which is in agreement with the TEM images.
XRD pattern of SnO2/reduced graphene oxide composites synthesized with ethanol solvent.

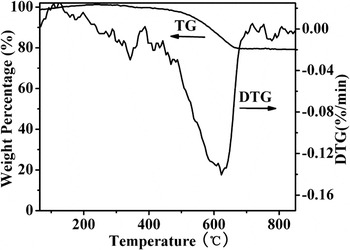
Figure 6 displays the TG and DTG curves of as-prepared SnO2/reduced graphene oxide composites prepared with ethanol solvent. The DTG curve exhibits intense bands centered at about 625 °C, which corresponds to the gasification of reduced graphene oxide. The TG curves of SnO2/reduced graphene oxide composites show a mass loss of 20%, which is attributed to reduced graphene oxide gasification, suggesting that the mass ratio of SnO2 in the composites is about 80%.
TG and DTG curves of SnO2/reduced graphene oxide composites synthesized with ethanol solvent.

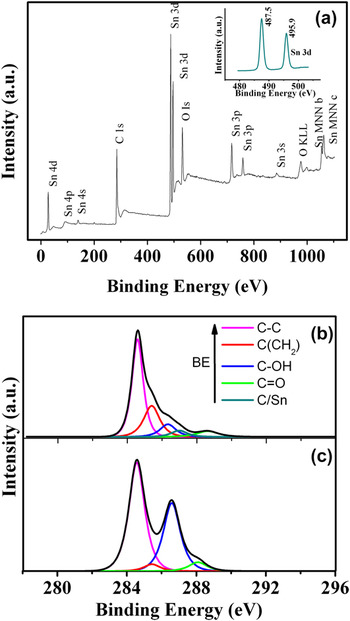
As seen from the XPS spectra (Fig. 7) of the SnO2/reduced graphene oxide composites, the peaks of Sn 3p, 3d, 4s, 4p, 4d are expected from SnO2 and the peak of C 1s at 289.4 eV is attributed to reduced graphene oxide sheets. Meanwhile, as shown in the inset, two peaks at 487.5 and 495.9 eV with an 8.4 eV peak-to-peak separation are attributed to the Sn 3d 5/2 and Sn 3d 3/2 peaks of the SnO2 nanoparticles, further confirming the formation of SnO2 nanoparticles within the reduced graphene oxide matrices. Reference An, Na, Zhang, Miao, Miao, Ding and Liu25,Reference Stankovich, Piner, Nguyen and Ruoff26 The C (1s) XPS spectra of SnO2/reduced graphene oxide composites and graphene oxide sheets are shown in Figs. 7(b) and 7(c), respectively. As shown in Fig. 7(c), C (1s) XPS spectra of graphene oxide sheets can be deconvoluted into four components corresponding to carbon atoms in different oxygen-containing functional groups: The binding energies of 284.6 and 285.4 eV were attributed to the C–C and C (CH2) bonds, respectively. The deconvoluted peaks centered at the binding energies of 286.2 and 288.1 eV were assigned to the C–OH and C=O functional groups, respectively. Reference Akhavan27–Reference Akhavan29 In Fig. 7(b), the C (1s) XPS spectrum of the SnO2/reduced graphene oxide composites shows the presence of the above functionalities and a new peak centered at the binding energy of 287.0 eV. The new peak is likely to correspond to partially oxidized carbons due to remaining defects of graphene oxide. However, compared with C (1s) XPS spectra of graphene oxide sheets, the XPS spectra of SnO2/reduced graphene oxide composites show a much smaller contribution of C–OH and C=O, indicating that the graphene oxide sheets are partially reduced in the reaction process.
XPS spectra of SnO2/reduced graphene oxide composites synthesized with ethanol solvent (a) and peak deconvolution of C (1s) XPS core level of SnO2/reduced graphene oxide composites (b) and graphene oxide sheets (c).

The component and structure of the SnO2/reduced graphene oxide composites are also reflected in the corresponding Raman spectra (Fig. S2) and FTIR spectra (Fig. S3). As can be observed from Fig. S2, four obvious peaks are clearly observed at about 477, 629, 688, and 769 cm−1, corresponding to the Eg, A1g, A2u, and B2g vibration modes of SnO2 nanoparticles, respectively. Reference Fan, Wang, Yu, Tu, Jiang and Zhao10,Reference Tuinstra and Koenig30 Additionally, two peaks at about 1320 cm−1 (D band) and 1594 cm−1 (G band) are observed in the inset spectra, which are attributed to the reduced graphene oxide substrate. Reference Stankovich, Dikin, Piner, Kohlhaas, Kleinhammes, Jia, Wu, Nguyen and Ruoff31 In the Fig. S3, compared with that of graphene oxide, FTIR spectra of the SnO2/reduced graphene oxide composites show two new bands centered at about 655 and 580 cm−1, corresponding to the antisymmetric O–Sn–O stretching mode and the Sn–OH terminal bonds, clarifying that SnO2 particles exist within the reduced graphene oxide matrices. Reference Li, Tang and Li14 Both the Raman spectra and the FTIR spectra are consistent with the TEM, XRD, and XPS results, indicating the formation of SnO2/reduced graphene oxide composites within the reduced graphene oxide matrices.
B. Electrochemical performance
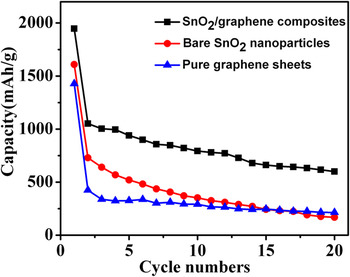
The lithium storage capacity and cyclability of the SnO2/reduced graphene oxide composites as anodes in lithium-ion cells were calculated via galvanostatic charge/discharge cycling. As shown in Fig. 8, the SnO2/reduced graphene oxide composites delivered a discharging capacity of 1946 mAh/g in the first cycle and exhibited a reversible discharging capacity of 1051 mAh/g. After 20 cycles, the SnO2/reduced graphene oxide composite electrode maintained a capacity of 600 mAh/g, retaining about 57.1% of the reversible discharging capacity. For comparison, bare SnO2 and pure reduced graphene oxide were tested. The TEM image of bare SnO2 was displayed in Fig. S4. The bare SnO2 nanoparticle electrode showed a poor cyclability, exhibiting a discharging capacity of 269 mAh/g in the 20th cycle, retaining only 22.1% of its reversible discharging capacity. The pure reduced graphene oxide showed a better cyclability than bare SnO2, retaining about 50.4% of its reversible discharging capacity after 20 cycles. But its specific capacity was rather low. It exhibited only 423.7 mAh/g of reversible discharging capacity and decreased to 213.7 mAh/g after 20 cycles. The results indicated that SnO2/reduced graphene oxide composites as electrodes demonstrated much better cycle performance and higher specific capacity than the bare SnO2 nanoparticles and pure reduced graphene oxide sheets.
Cyclic performances of SnO2/reduced graphene oxide composites synthesized with ethanol solvent, bare SnO2 nanoparticles, and pure reduced graphene oxide sheets.

TEM images of bare SnO2 nanoparticles and SnO2/reduced graphene oxide composites after 20 cycles were displayed in Figs. S5 and S6. After 20 cycles, the bare SnO2 nanoparticles agglomerated, and present a large volume expansion. And the SnO2 coating on the reduced graphene oxide surface was still observed and had no dramatic volume expansion. The steady structure of SnO2/reduced graphene oxide composites favored to avoid large capacity loss during repeated alloying and dealloying processes.
The reason for the improvement in specific capacity and cyclability for SnO2/reduced graphene oxide composites can be explained as follows: first, it is well known that when SnO2 is used as anode in lithium-ion cells, a dramatic volume increase would occur, inducing cracking and pulverization of the anode. In this paper, SnO2 nanoparticles were embedded in reduced graphene oxide nanosheet matrix and the obtained SnO2/reduced graphene oxide composites largely lessened the effects caused by volume change during cycles and thus alleviate the degradation of the electrode. Reference Wang, Lee and Zeng7 Second, the introduced reduced graphene oxide nanosheets not only provided a highly conductive medium for electron transfer during the lithiation and delithiation process, facilitating the electron transport and greatly decreasing the Ohmic loss, but also offered a larger surface area for enhancing the capacity. Reference Lee, Lytle, Ergang, Oh and Stein32
IV. CONCLUSIONS
In summary, the SnO2/reduced graphene oxide nanocomposites were successfully prepared by an in situ chemical approach. Ethanol as the solvent is more favorable for the uniform distribution of smaller size SnO2 particles on the reduced graphene oxide. The TEM and HRTEM images showed that the crystal size of 3–4 nm of SnO2 nanoparticles was uniformly distributed on reduced graphene oxide. Cyclic voltammetry measurements showed that SnO2/reduced graphene oxide composites as electrodes demonstrated much better cycle performance and higher specific capacity than the bare SnO2 nanoparticles, maintaining a discharge capacity of 600 mAh/g after 20 cycles. In addition, the SnO2/reduced graphene oxide composites can be anticipated for the encouraging extensive applications such as nanoelectronics, ultracapacitors, sensors, nanocomposites, and gas storage.
Supplementary Material
To view supplementary material for this article, please visit http://dx.doi.org/jmr.2013.375.
ACKNOWLEDGMENTS
The work was supported by the Natural Science Foundation of China (61174011, 11275121, 21241002, and 21371116), Innovation Program of Shanghai Municipal Education Commission (12YZ013), Key Laboratory of Nanodevices and Applications, Suzhou Institute of Nano-Tech and Nano-Bionics, Chinese Academy of Sciences (12CS02), and State Key Laboratory of Pollution Control and Resource Reuse Foundation, Tongji University (PCRRF12003).