INTRODUCTION
Knowledge of species distributions patterns and identification of environmental factors influencing these patterns are crucial for managing biodiversity (Krebs Reference Krebs1978). Species distribution models (SDMs) have been used to identify management priorities for threatened species (Norris Reference Norris2004), prioritize areas for biodiversity conservation (Araújo et al. Reference Araújo, Cabeza, Thuiller, Hannah and Williams2004), evaluate the potential spread of invasive species (Thuiller et al. Reference Thuiller, Richardson, Pyšek, Midgley, Hughes and Rouget2005), and forecast the potential impact of climate change on species distribution patterns (Bakkenes et al. Reference Bakkenes, Alkemade, Ihle, Leemans and Latour2002). However, species distribution patterns are often the result of interacting factors whose effects are difficult to disentangle. The recent development of analytical methods such as variation partitioning and hierarchical partitioning analyses have proved useful to identify the individual and combined effects of the factors considered (Borcard et al. Reference Borcard, Legendre and Drapeau1992; Hortal et al. Reference Hortal, Rodríguez, Nieto Díaz and Lobo2008). Furthermore, SDMs enable construction of habitat suitability maps that, when compared with actual distributions, facilitate the identification of areas with favourable conditions for the species that are currently unoccupied, thus providing clues about possible causes of recent regression, as well as identifying a number of areas where conservation problems should be further investigated (Seoane et al. Reference Seoane, Viñuela, Díaz-Delgado and Bustamante2003).
Farmland and steppe species are at present the most threatened bird group in Europe, with 83% of species having unfavourable status (Burfield Reference Burfield, Bota, Morales, Mañosa and Camprodon2005). Among steppe birds, the pin-tailed sandgrouse (Pterocles alchata, Linnaeus 1766) and the black-bellied sandgrouse (Pterocles orientalis Linnaeus 1758) are two species of conservation priority at European level (conservation category SPEC3) (Madroño et al. Reference Madroño, González and Atienza2004). Both species are ground-nesting birds of Palearctic distribution associated with open arid habitats, natural steppes and agricultural ‘pseudo-steppes’ (see definition in Suárez et al. Reference Suárez, Martínez, Herranz and Yanes1997). Both sandgrouse are considered ‘vulnerable’ in Spain, the stronghold of the European population (Madroño et al. Reference Madroño, González and Atienza2004); although the proportion of the total European population of the black-bellied sandgrouse that is Spanish (c. 25%) is smaller than that of its counterpart (Madroño et al. Reference Madroño, González and Atienza2004; BirdLife International 2011a , b ).
Albeit this unfavourable status, little is known about the biology of either sandgrouse species, or the possible threats that they face. Their decline is most likely related to changes in land use and landscape structure as a result of agricultural intensification, the expansion of olive groves and irrigated areas, infrastructure development and urbanization (Madroño et al. Reference Madroño, González and Atienza2004; Santos & Suárez Reference Santos, Suárez, Bota, Morales, Mañosa and Camprodon2005). It is important to identify which of these factors are primarily affecting the progressively shrinking distribution of Spanish sandgrouse in order to safeguard their conservation.
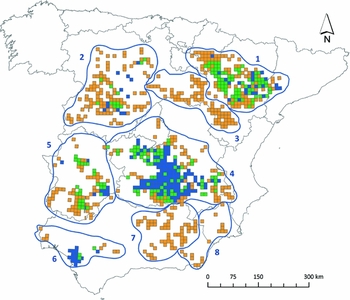
To date, sandgrouse distribution and habitat requirements have been studied only at local scales (Suárez et al. Reference Suárez, Martínez, Herranz and Yanes1997; Martínez et al. Reference Martínez, Suárez, Yanes and Herranz1998; Martín et al. Reference Martín, Casas, Mougeot, García and Viñuela2010a , b; Seoane et al. Reference Seoane, Carrascal, Palomino and Alonso2010). However, the distribution of a species is not only determined by local habitat characteristics, but rather by natural and human-induced environmental factors operating at larger scales through history (Ricklefs Reference Ricklefs1987). Consequently, broad-scale distribution models may help to unravel the factors that affect sandgrouse populations on a larger scale, which in turn can be applied in large-scale conservation programmes to attain more efficient results. Both sandgrouse species are very similar in their ecological requirements, partially sharing their climatic, topographic, trophic and breeding habitat requirements (Herranz & Suárez Reference Herranz and Suárez1999). They often occur sympatrically and a great part of their distribution areas overlap (Fig. 1), yet there are also broad areas where only one of the two species is found (Herranz & Suárez Reference Herranz and Suárez1999). No study has evidently attempted to determine which environmental conditions characterize both areas of overlap and areas where they occur singly at biogeographical scale, information that could contribute to the implementation of coordinated management programmes for both species.
Sandgrouse distribution during the breeding period. Pterocles alchata is present in blue squares, Pterocles orientalis is present in orange squares, and both species are present in green squares. The main geographical regions are: (1) Ebro Valley, (2) Northern Plateau, (3) Iberian Páramos, (4) Southern Plateau, (5) Extremadura, (6) Western Andalusia, (7) Eastern Andalusia and (8) Arid south-east. Adapted from Suárez et al. (Reference Suárez, Hervás, Herranz and Del Moral2006).

The main objectives of this study were to: (1) identify the factors shaping the current distribution in Spain of the pin-tailed sandgrouse and the black-bellied sandgrouse; (2) estimate the relative importance of climate and topography (abiotic factors), land use, landscape and human pressure (anthropogenic factors) and geographic location (geographical factors) in the occurrence of both species in Spain; (3) determine the independent contribution of each anthropogenic variable to occurrence; and (4) generate habitat suitability maps for both species. These maps, when compared with the current distribution, would serve to identify the areas most suitable for conservation efforts and to pinpoint unsuitable areas that are currently occupied.
METHODS
Study area
Mainland Spain is probably the most biogeographically complex country in Europe due to its geology, topography, climate and location between the Eurosiberian and the Mediterranean regions (Font Reference Font2000). Environmental conditions vary from the Central Plateau, with a marked contrast between temperate summers and harsh winters, to the Mediterranean lowlands, with hot summers but temperate and rainy winters, and the more humid and colder Eurosiberian northern strip. Vegetation types vary accordingly, including deciduous and coniferous forests, evergreen woodland, tall and dwarf shrublands, and perennial and annual grasslands. Croplands, mainly located on flatlands, also occupy almost 70% of peninsular Spain (Martí & Moral Reference Martí and Moral2004).
Species distribution data
To analyse the current distribution of sandgrouse, we used the best available data, which are the National Breeding Sandgrouse Survey (NBSS), coordinated by the Sociedad Española de Ornitología (SEO)/BirdLife (Suárez et al. Reference Suárez, Hervás, Herranz and Del Moral2006). The census was designed to cover all the 100 km2 squares where sandgrouse were detected in the Spanish Atlas of Breeding Birds (SABB) (Martí & Moral Reference Martí and Moral2004), while adding additional squares where anecdotal sightings had been recorded in the period between the SAAB and the NBSS. We gathered all georeferenced observations of sandgrouse recorded during the NBSS and overlaid them on the 10 km × 10 km grid of Spain. Every 10 km × 10 km square containing at least one sandgrouse record (a record could consist of 1–41 individuals) was categorized as a ‘presence’ square. We are confident that the 10 km × 10 km resolution is adequate (Dunning et al. Reference Dunning, Stewart, Danielson, Noon, Root, Lamberson and Stevens1995) for studying sandgrouse distribution given the home ranges of c. 40 km2 for pin-tailed sandgrouse (Benítez-López et al. Reference Benítez-López, Martín, Casas, Mougeot, García, Viñuela, Casinello and Castro2010b ) and c. 120 km2 for black-bellied sandgrouse (A. Benítez-López, F. Casas, F. Mougeot, C.A. Martín, J.T. García & J. Viñuela, unpublished data 2007–2013). A smaller scale (for example 1 km2) would have artificially increased absences.
We compiled both data sources, updating the SAAB information with the NBSS data. Our final dataset consisted of 5312 10 km × 10 km squares with presence/absence data for both species (665 squares corresponded to the NBSS data). This information was used to define the main geographical regions where sandgrouse population nuclei were located, which were separated according to topographic and climatic characteristics (Herranz & Suárez Reference Herranz and Suárez1999; Suárez et al. Reference Suárez, Hervás, Herranz and Del Moral2006).
Predictor variables
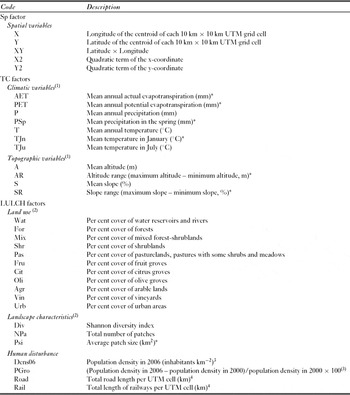
We modelled the distributions of both species in Spain in relation to large-scale environmental conditions, mainly topographic, climatic, land use, spatial and anthropogenic variables (Table 1). Environmental layers were processed with ArcMap 9.3 (ESRI 1999–2005, http://www.esri.com). Topographic and climatic variables were obtained from source maps at 200 m resolution by calculating the mean value of 200 random points within each 10 km × 10 km UTM square (Ninyerola et al. Reference Ninyerola, Pons and Roure2005). Land-use variables were obtained from a continuous vector layer that included all habitats present in mainland Spain (SIGPAC, MARM [Sistema de Información Geográfica de Parcelas Agrícolas, Ministerio de Agricultura, Alimentación y Medio Ambiente] Reference SIGPAC2006) and calculated as the percentage of the area occupied by each land-use category in each square. Additionally, we calculated an index of land-use diversity (DivIndex) using the Shannon function (see Shannon & Weaver Reference Shannon and Weaver1949), the total number of different patches and the mean patch size per square. Human disturbance variables included human population density in 2006, population growth between 2000 and 2006, total road length and railway length in each square (Table 1) (INE [Instituto Nacional de Estadística] 2001, 2006; IGN [Instituto Geográfico Nacional] 2006).
Variables used in the univariate analyses and to model the distribution of pin-tailed sandgrouse and black-bellied sandgrouse. *Variables were not included in the final models to reduce multicollinearity among predictors (see text). Sources: 1Atlas Climático Digital de la Península Ibérica (Ninyerola et al. Reference Ninyerola, Pons and Roure2005). 2Spanish Instituto Nacional de Estadística (http://www.ine.es).3SIGPAC (Sistema de Información Geográfica de Parcelas Agrícolas, MARM). 4Spanish Instituto Geográfico Nacional (IGN).

We accounted for spatial autocorrelation in our models by including a spatial term of the form b1x + b2y + b3×2 + b4xy + b5y2 (Legendre Reference Legendre1993). The inclusion of spatial variables in a model can reveal a geographical trend in distribution that does not reflect the spatial structure of the environmental predictor variables (Borcard et al. Reference Borcard, Legendre and Drapeau1992), and thus could be attributed to historical events or to contagious biotic processes such as migration (Legendre Reference Legendre1993).
Statistical analyses
We characterized squares where species were present and absent by comparing the mean values of the explanatory variables between (1) unoccupied squares, (2) squares occupied by P. orientalis, (3) squares occupied by P. alchata, and (4) squares occupied by both species (ANOVA). Pairwise comparisons were assessed with Bonferroni post-hoc tests (Appendix 1, Table S1, see supplementary material at Journals.cambridge.org/ENC). These exploratory analyses gave us an indication of which predictors could be important at explaining P. alchata and P. orientalis distributions, and served as a starting point for building multivariate models for each species.
We used generalized linear models (GLMs) (McCullagh & Nelder Reference McCullagh and Nelder1989) with a binomial distribution and logit link to relate the probability of occurrence of each sandgrouse species in each square to environmental variables. We grouped our variables according to three explanatory factors: (1) topography and climate (TC factor), (2) land use, landscape and human disturbance (LULCH factor), and (3) spatial variables (Sp factor); we fitted several logistic models within each factor (Table 1). This procedure enabled us to assess the relative importance of abiotic factors (TC) and spatial structuring of the populations (due to contagious biotic processes and historical evolutionary processes; Sp), compared to anthropogenic variables (LULCH) which can be managed for conservation purposes. All explanatory variables were standardized in order to facilitate the interpretation and comparison of the estimated coefficients in our models. Prior to model building, we avoided multicollinearity among variables within each factor by removing strongly intercorrelated variables (Spearman's coefficient > 0.8) (Legendre Reference Legendre1993; Zuur et al. Reference Zuur, Ieno and Smith2007) and retained those that explained more deviance in univariate logistic models. Models were built starting with the variable that best fitted the data and subsequently adding the rest of the variables. All candidate models were ranked using the corrected Akaike Information Criterion (AICc), the Akaike weight and the model fit (percentage of explained deviance) (Burnham & Anderson Reference Burnham and Anderson2002). We calculated variance inflation factors (VIFs) for each model (package ‘car’; Fox & Weisberg Reference Fox and Weisberg2011; R Development Core Team 2012) and removed the explanatory variables with the highest VIF and those that contributed the least to parsimony (i.e. produced an increase in AICc) until all remaining variables had a VIF < 5 (Quinn & Keough Reference Quinn and Keough2002; Zuur et al. Reference Zuur, Ieno and Smith2007) (Appendix 1, Table S2, see supplementary material at Journals.cambridge.org/ENC). The variables included in the best model within each factor were combined to produce a general model for each species (Appendix 1, Table S2, see supplementary material at Journals.cambridge.org/ENC). This model was further fine-tuned by removing the variables that explained the least (using a likelihood ratio test) one by one, until we obtained the most parsimonious model (with the lowest AICc, highest Akaike weight, highest explained deviance, with VIF < 5 and a lower number of predictors) (Appendix 1, Table S2, see supplementary material at Journals.cambridge.org/ENC).
A 10-fold cross-validation was applied to test the model accuracy. We evaluated the discrimination ability of the final and cross-validated models by estimating the sensitivity, specificity, correct classification rate and Cohen's kappa (Cohen Reference Cohen1960) (package PresenceAbsence; Freeman Reference Freeman2007; R Development Core Team 2012). The classification thresholds were established by maximizing the sum of sensitivity and specificity (0.07 for P. alchata and 0.11 for P. orientalis) (Liu et al. Reference Liu, Berry, Dawson and Pearson2005). We also calculated the area under the receiver characteristic curve (ROC, AUC), which is a threshold-independent measure (Fielding & Bell Reference Fielding and Bell1997).
Variation partitioning and hierarchical partitioning procedures
Although we tried to maintain multicollinearity below acceptable levels (VIF < 5), we found interactions between TC, LULCH and Sp factors that may result in an overlaid effect in space due to collinearity between them (Borcard et al. Reference Borcard, Legendre and Drapeau1992; Legendre Reference Legendre1993). Therefore, we used variation partitioning procedures to assess both the individual and overlapping contributions of the three factors (Borcard et al. Reference Borcard, Legendre and Drapeau1992; Legendre Reference Legendre1993). Variation partitioning procedures were applied to the final model outputs (the habitat suitability index [HSI]), to account for the variation explained independently by each factor (individual effects) or by two or three factors simultaneously (combined effects), using partial regressions (full description in Hortal et al. Reference Hortal, Rodríguez, Nieto Díaz and Lobo2008).
We performed a hierarchical partitioning analysis (package ‘hier.part’; Walsh & Mac Nally Reference Walsh and Mac Nally2008; R Development Core Team 2012) including only those variables retained in our general models that could be changed by management policies (LULCH factor). This allowed calculation, for all possible candidate regression models, of the independent and joint contributions of each variable to the total explanatory power of the model (Mac Nally Reference Mac Nally2002). The size of the individual effects of each variable (percentage of independent effects) was used as a criterion for ranking and deriving conservation priorities.
Habitat suitability maps and network of suitable areas
We used the most parsimonious models for each species to obtain predicted probability values of occurrence for each square. These probabilities can be considered as a HSI, with high HSI values indicating highly suitable squares. HSI values under the classification thresholds corresponded to unsuitable squares (USS; HSI < 0.07 for P. alchata and HSI < 0.11 for P. orientalis). Additionally, we divided the whole set of favourable squares for P. alchata and P. orientalis into three categories. The top 20% of squares with the highest HSI values represented highly suitable squares (HSS), the bottom 20% of the squares with the lowest HSI values were the least suitable squares (LSS), and the rest fell within the intermediate suitability category (ISS). We assessed the percentage of HSS, LSS, ISS and USS currently occupied by sandgrouse in Spain. Also, for each species, we identified highly suitable areas within each geographical region where there were at least two adjacent HSS occupied by sandgrouse, namely a population within a metapopulation in a biogeographical context (Driscoll Reference Driscoll2007). Continuous patches of HSS were considered core suitable areas, whereas patches consisting of < 5 HSS or isolated from other suitable areas (distance > maximum movement distances = c. 45 km; Casas et al. Reference Casas, García, Mougeot, Benítez-López, Martín, González, Urmeneta, Viñuela and Redondo2012) were considered marginally suitable areas. Unoccupied HSS were also pinpointed to identify areas where sandgrouse populations could potentially become established, or where sandgrouse recently became extinct due to factors not considered by our models or operating at a finer scale. In turn, occupied unsuitable squares were also highlighted since, within a metapopulation framework, they could indicate areas where sandgrouse populations could not be sustained in the long term without the arrival of new individuals; for simplicity we denote these areas as ‘sink’ areas, although no productivity data are available.
RESULTS
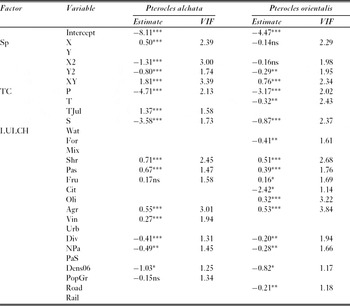
Models combining variables from different factors were more parsimonious than any of the models including variables belonging to a single factor (Appendix 1, Table S2, see supplementary material at Journals.cambridge.org/ENC). Three of the candidate models for P.alchata had similar weight of evidence, but given the low explanatory power of the variables Cit and Rail, we kept the simplest model to explain and predict sandgrouse distribution (Appendix 1, Table S2, see supplementary material at Journals.cambridge.org/ENC). According to the final models, during the breeding period both species are located in flatlands characterized by low annual rainfall, a high cover of arable lands, shrublands and pastures, low land-use diversity and low overall landscape heterogeneity (Table 2). Fruit groves were positively but less strongly related to the occurrence of both species. Mean temperature in July was positively related to the probability of occurrence of P. alchata but not that of P. orientalis. P. orientalis avoids areas with a high road density, and both species avoid highly populated areas, particularly those where human population has increased the most in the past five years in the case of P. alchata. The main differences between the models of each species regarding land-use variables were the positive effect of vineyards on P. alchata and the negative effect of forests on P. orientalis. Citrus fruit and olive groves also entered the model for P. orientalis, but their relative importance was almost negligible (see results of hierarchical partitioning of the variance). Several spatial variables entered the models of both species indicating that their distribution seems to be spatially structured at our study scale. Thus, the probability of occurrence of both sandgrouse species declines southwards and northwards from the centre of their distribution in Spain, but increases from the south-east towards the north-east (Table 2). P. alchata is also more likely to be present towards the east, but avoids areas closer to the coastline.
Final models obtained for the probability of occurrence of pin-tailed sandgrouse and black-bellied sandgrouse in peninsular Spain. See Table 1 for explanation of variables. *p = < 0.05, **p = < 0.01, ***p = < 0.001.

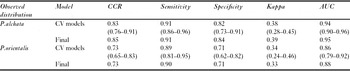
The combined models for P. alchata and P. orientalis had good and acceptable model fits, respectively (explained deviance = 48.1% for P. alchata and 31.2% for P. orientalis). The accuracy of the cross-validated models and of the final combined models was high for both species, indicating a good predictive capacity (Table 3).
Correct classification rate (CCR), sensitivity, specificity, Cohen's Kappa coefficients and area under curve (AUC) values obtained by comparing the observed distribution with predicted values (HSI) for 10-fold cross-validated (CV) models (mean values, with range in brackets) and final models.

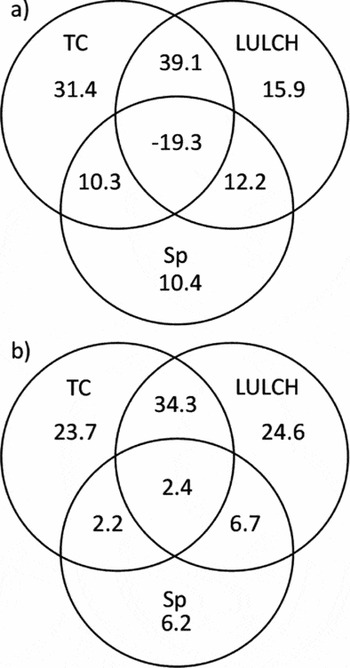
The joint effect of TC (topography and climate) and LUCLH (land use, landscape and human disturbance) variables (39.1%) and the individual effect of TC (31.4%) together accounted for 70% of the total explained variation in the distribution of P. alchata (Fig. 2 a). The individual effects of LULCH also accounted for a further 15.9% of the variation. In the case of P. orientalis, TC and LULCH factors jointly explained 34.3 % of the variation, and the individual effects of TC and LULCH factors were 23.7% and 24.6%, respectively (Fig. 2 b).
Variation partitioning of HSI into the independent effects of topographic and climatic factors (TC), land use, landscape and human factors (LULCH) and spatial factors (Sp), and their overlaps as percentages for (a) Pterocles alchata and (b) Pterocles orientalis. The percentages refer to the total explained deviance of each model.

The spatial factor was more important at explaining the variation in the distribution of P. alchata (33% total, 10.4% of individual effects, and 10.3% and 12.2% of joint effects with TC and LULCH, respectively) than that of P. orientalis (15% total, 6.2% individual effects, and 2.2% and 6.7% of joint effects with TC and LULCH, respectively) (Fig. 2 a, b).
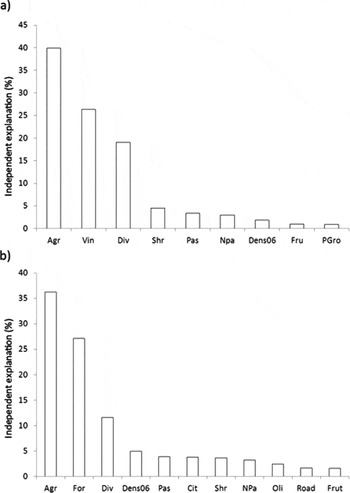
The hierarchical partitioning analysis indicated that the most important anthropogenic variables explaining sandgrouse distribution were arable lands for both species (explaining independently 40% of the variation for P. alchata and 36.3 % for P. orientalis), forest cover for P. orientalis (27.1%) and vineyards for P. alchata (26.4%) (Fig. 3). Less important, but still relevant for both species, were variables related to the heterogeneity of the landscape (land-use diversity or the number of patches of different land uses), land uses with (semi) natural vegetation (pastures and shrublands), human-related variables (human density, road density and population growth) and arboreal crops for P. orientalis (Fig. 3).
Conservation priorities for (a) Pterocles alchata and (b) Pterocles orientalis in peninsular Spain derived from hierarchical partitioning.

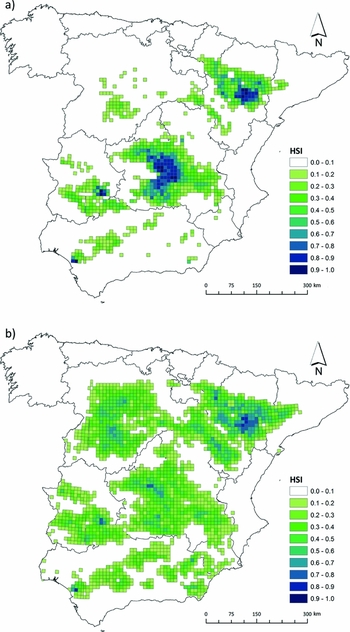
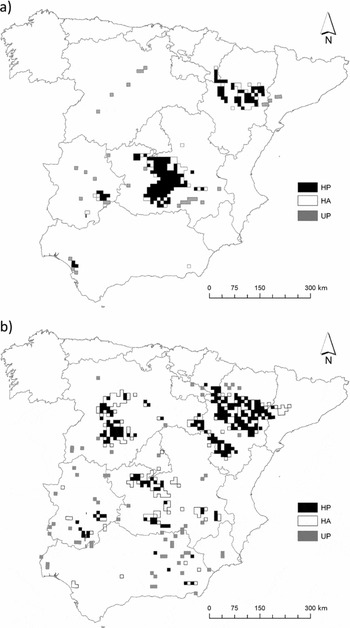
A larger number of suitable squares were identified for P. orientalis (n = 1980) than for P. alchata (n = 1122), of which 396 squares and 224 squares qualified as highly suitable, respectively (Fig. 4). Among these HSS, 55% were currently occupied by P. orientalis, whereas P. alchata occupied 71% (Fig. 5). We also identified 32 USS where P. alchata was present and 64 USS where P. orientalis was currently present.
Habitat suitability maps for sandgrouse species (a) Pterocles alchata and (b) Pterocles orientalis in Spain.

Network of core high suitability areas for (a) Pterocles alchata and (b) Pterocles orientalis, indicating where sandgrouse are present (HP) and where sandgrouse are absent (HA), as well as unsuitable areas where sandgrouse are present (UA).

Core suitable areas for P. alchata were identified in the Southern Plateau and the Ebro valley, with two marginally suitable areas in Western Andalusia and Extremadura (Fig. 5 a). For P. orientalis, the core suitable areas were located in the Ebro valley, the Iberian Páramos (plateaux located at high altitude and with low temperature) and the Northern Plateau, with several marginal areas located over the Southern Plateau and Extremadura (Fig. 5 b). Unoccupied highly suitable areas (areas where sandgrouse have disappeared and/or where they could establish) were mostly located at the boundaries of currently occupied core areas for both species, and at the edges of some marginal areas in the Southern Plateau, Extremadura and Western Andalusia for P. orientalis, and in Extremadura for P. alchata.
DISCUSSION
Factors determining Pterocles spp. distribution
While at a large geographical scale, climate and topography are usually the main factors limiting species' distributions (Whittaker et al. Reference Whittaker, Nogués-Bravo and Araújo2007), our models also identified habitat and anthropogenic factors shaping sandgrouse distribution. For P. alchata, the individual effect of topography and climate explained relatively more variation in the probability of occurrence than for P. orientalis, for which anthropogenic variables (LULCH) were relatively more important (Fig. 2). This could explain the more restricted distribution of P. alchata being more affected by climate. In turn, the relatively large effect of LULCH factors on P. orientalis may be, at least partially, explained by the wider range of habitats used (Herranz & Suárez Reference Herranz and Suárez1999).
Association of both sandgrouse species with flat areas with low annual precipitation concurs with previous studies (Cramp et al. Reference Cramp, Simmons, Brooks, Collar, Dunn, Gillmor, Hollom, Hudson, Nicholson and Ogilvie1985; De Juana Reference De Juana, Hoyo, Elliot and Sargatal1998), although P. orientalis seems to occupy more rugged areas than P. alchata (Appendix 1, Table S1, see supplementary material at Journals.cambridge.org/ENC; Herranz & Suárez Reference Herranz and Suárez1999). P. alchata was also more intimately linked to hot climate than P. orientalis (Table 2; Appendix 1, Table S1, see supplementary material at Journals.cambridge.org/ENC), suggesting that P. alchata is more tolerant of high temperatures than P. orientalis, and that the latter has a reduced tolerance of low temperatures. Actually, P. alchata is typical of meso- and termo-Mediterranean bioclimates (Hinsley et al. Reference Hinsley, Ferns, Thomas and Pinshow1993), whereas P. orientalis, although occurring sympatrically in the meso-Mediterranean region, also occupies the supra-Mediterranean bioclimate typical of páramos in Spain and cold Asian desserts (Cramp et al. Reference Cramp, Simmons, Brooks, Collar, Dunn, Gillmor, Hollom, Hudson, Nicholson and Ogilvie1985). The harsh winters typical of the Northern Plateau (and páramos) could be hampering P. alchata expansion to these areas. A plausible explanation for this geographic segregation driven by the temperature could be a higher cooling capacity of P. alchata compared to P. orientalis, which allows the former to extend into hotter regions than the latter (Hinsley et al. Reference Hinsley, Ferns, Thomas and Pinshow1993), whereas P. orientalis’ larger size probably promotes its spread into areas of lower temperature. This association with climate suggests that sandgrouse might be highly sensitive to variations in climate (Parry Reference Parry2007), which might provoke a displacement of their distributions, with some populations disappearing and others becoming established in currently unoccupied areas.
TC and LULCH factors jointly explained most of the variation in the distribution of both species, probably because, in Spain, flat arid to semi-arid areas are mostly occupied by arable and/or steppe-like (pastures/shrublands) landscapes (Martí & Moral Reference Martí and Moral2004), which are the habitats preferred by both species (Table 2). It is particularly relevant for conservation and management that, for both species, arable land was the most important variable determining their large-scale distribution (Fig. 3), a pattern also observed at local scale (Suárez et al. Reference Suárez, Martínez, Herranz and Yanes1997; Herranz & Suárez Reference Herranz and Suárez1999). Thus, both species are closely associated with habitats intensely managed by humans that may be exposed to rapid changes, mainly due to ongoing rural abandonment in marginal areas and to the implementation of the Common Agricultural Policy (CAP) in the most productive areas (Pain & Pienkowski Reference Pain and Pienkowski1997). The third most important variable explaining the distribution of both species was land-use diversity, which had a negative effect on both species’ occurrence (Fig. 3). This suggests that transformation of arable land to other land uses would result in net habitat loss and fragmentation.
Within arable lands, sandgrouse are mainly located on extensive agricultural areas, which, following Spain's economic growth and development, have undergone profound transformations in the last decades. The intensification of agriculture since the 1960s has led to a decline in fallows and legume crops within cereal agricultural systems, resulting in a net loss of important habitats used by both sandgrouse species for nesting and feeding (Herranz & Suárez Reference Herranz and Suárez1999; Martín et al. Reference Martín, Casas, Mougeot, García and Viñuela2010b ). Additionally, irrigated crops have expanded enormously, sometimes at the expense of extensive cereal (MAPA [Ministerio de Agricultura, Pesca y Alimentación] 1998), a trend that is changing the traditional agricultural landscape drastically and which has had a negative impact on the distribution of other steppe birds (Brotons et al. Reference Brotons, Mañosa and Estrada2004). Yet, the decline of farmland birds in Spain has not reached the dramatic levels observed in the rest of Europe, mainly because of the late arrival of modern agricultural practices and the relatively recent inclusion of Spain in the EU (Donald et al. Reference Donald, Green and Heath2001). The implementation of the CAP has changed this process, since Spain currently receives the second highest proportion of CAP aid payments, and most subsidies have been and are still linked to promotion of intensive farming systems, whereas systems with higher nature value (such as pseudo-steppes and traditional farming systems, and pastures) are omitted, including those within the Natura 2000 network (WWF [World Wildlife Fund] & SEO [Sociedad Española de Ornitología]/BirdLife 2010). At the dawn of the new CAP reform, political effort should be made to secure financial support for environmentally sustainable agriculture compatible with farmland birds (including sandgrouse), and to assure effective implementation of appropriate measures at the national level.
In Spain, P. alchata occurrence was also positively related to vineyard cover, in contrast to what has been found locally (Mañosa et al. Reference Mañosa, Estrada, Folch, Bonfinl, González-Prat, Orta, Fernández Gutiérrez and Sanz-Zuasti1996; Herranz & Suárez Reference Herranz and Suárez1999; Martín et al. Reference Martín, Casas, Mougeot, García and Viñuela2010b ). We can think of three non-exclusive explanations for this. First, factors operating at a local scale do not necessarily apply at larger scales (Ricklefs Reference Ricklefs1987). Second, our model does not explain all the deviance of the data, implying that there could be variables not considered in our model that influence P. alchata distribution (Borcard et al. Reference Borcard, Legendre and Drapeau1992), and the observed effect of vineyards could be mediated by other unexplained factors. And third, the spatial variables (Sp factor) explain part of the variation in P. alchata distribution. The south-east sector of Spain (Southern Plateau) is the main centre for P. alchata populations (Figs 1, 4 a, 5 a), but also of vast vineyards (650 000 ha), which could lead to the observed positive association with the latter.
Human disturbance variables were negatively related to sandgrouse occurrence, P. orientalis seemingly more sensitive to human density than P. alchata (Fig. 3). This is not surprising since both species are linked to deserts and isolated areas elsewhere within their global distribution, and urbanization and associated infrastructure development, among other land-use transformations, are important drivers of decline of sandgrouse (Santos & Suárez Reference Santos, Suárez, Bota, Morales, Mañosa and Camprodon2005; Cardoso et al. Reference Cardoso, Poeiras and Carrapato2007), other steppe bird populations (Lane et al. Reference Lane, Alonso and Martín2001; Osborne et al. Reference Osborne, Alonso and Bryant2001; Madroño et al. Reference Madroño, González and Atienza2004), and of biodiversity in general (Benítez-López et al. Reference Benítez-López, Alkemade and Verweij2010a ).
Network of suitable areas and metapopulation dynamics
One of the strengths of our models was their ability to identify areas with environmental conditions similar to those where the species are known to occur, but which are currently unoccupied. The identified network of core marginally suitable areas and unsuitable currently occupied areas suggests that metapopulation dynamics could be implicated in the distribution of both species. Hence, core suitable areas could be acting as a source of sandgrouse dispersing to unsuitable areas, where sandgrouse are nevertheless present despite suboptimal conditions (Fig. 5 a, b). However, some of the sink areas are located several hundreds of kilometres away from core areas, and recruitment of new individuals by dispersal movements is thus improbable since the magnitude of these movements is commonly limited to c. 45 km (Casas et al. Reference Casas, García, Mougeot, Benítez-López, Martín, González, Urmeneta, Viñuela and Redondo2012). One of the clearest examples is the retreat of P. alchata from the Northern Plateau, where it has become rare or has disappeared in the northernmost provinces, and currently occupies several unsuitable squares (Herranz & Suárez Reference Herranz and Suárez1999; Suárez et al. Reference Suárez, Hervás, Herranz and Del Moral2006). In the case of P. orientalis, the Northern Plateau is still a core suitable area, yet the species is becoming scarcer also in the northernmost provinces of this area (Suárez et al. Reference Suárez, Hervás, Herranz and Del Moral2006). A plausible explanation is that areas near the border of a species’ range are usually sink areas with mortality rates higher than breeding rates (Brown & Lomolino Reference Brown and Lomolino1998). This process could also be taking place in some of the marginal areas and unsuitable occupied areas (Western Andalusia for both species, and arid South-east and Eastern Andalusia for P. orientalis).
Unoccupied highly suitable areas were mostly located in the boundaries of core suitable areas (such as the Southern Plateau, Ebro Valley river and Iberian Páramos) or in between them, suggesting that they are the reflection of the ongoing decline and disappearance of both sandgrouse species in areas where they were widely distributed in the past (Estrada & Curcó Reference Estrada and Curcó1991; Manrique & De Juana Reference Manrique, De Juana, Goriup, Batten and Norton1991; Pleguezuelos Reference Pleguezuelos1992). Generally, species range contractions are strongly influenced by anthropogenic forces, such as habitat degradation, biocides and introduced species (Channell & Lomolino Reference Channell and Lomolino2000). Taking into account the association between sandgrouse and agriculture, the range contraction of both sandgrouse species in these areas seems to be related to habitat degradation and loss due to changes in agricultural management. For example, Western Andalusia is one of the agricultural areas in Spain where irrigation has increased most in the last decades (MAPA 2001). In the Northern Plateau, the irrigated area has also notably increased and minimum tillage has expanded substantially (MAGRAMA [Ministerio de Agricultura, Alimentación y Medio Ambiente] 2011). Moreover, recent common vole plagues have induced several vole control campaigns involving massive release of cereal grain treated with rodenticides, which affect several granivorous species in this area (Olea et al. Reference Olea, Sánchez-Barbudo, Viñuela, Barja, Mateo-Tomás, Piñeiro, Mateo and Purroy2009).
CONCLUSIONS
Since agricultural management is a key factor explaining current sandgrouse distribution in Spain, more detailed information about the relative importance of the multiple recent changes in agricultural management is urgently needed. Thus, these species should be studied in detail at smaller scales, for example comparing areas where contrasts between predicted and observed distributions are indicated by our models. CAP reform will play a major role if the ‘greening’ proposed by the European Commission is achieved, which would have implications for sandgrouse populations in Spain, and for other farmland and steppe birds. Potential future changes in sandgrouse distribution will probably be directed by the synergistic effects of both climate change and expected land-use transformations at the national level as the result of the new CAP, such as afforestation programmes in marginal low-productivity arable lands and expansion and intensification of permanent crops, or as a result of population growth, urbanization and infrastructure development. In this context, our models help to assess likely shifts in sandgrouse distribution. Conservation plans for sandgrouse should be elaborated from a regional perspective, taking into account the network of core suitable areas we identified when planning the establishment of new Special Protection Areas (SPAs). SPA coverage within the main core areas of these species is remarkably low (Traba et al. Reference Traba, García de la Morena, Morales and Suárez2007), particularly in the Southern Plateau (Suárez-Seoane et al. Reference Suárez-Seoane, Osborne and Alonso2002). Specific conservation measures should include the maintenance of preferred land uses for sandgrouse (arable lands, pastures and shrublands), and limitation of urban sprawl and road development into protected areas.
Once the specific causes of sandgrouse disappearance have been identified at a smaller scale, as proposed above, local conservation plans to improve the ecological conditions for existing sandgrouse populations or possible reintroduction programmes could be implemented in suitable areas where these species are disappearing or have become extinct. Ideally, core areas should be expanded and reconnected through previously unoccupied areas that are otherwise suitable, filling the gaps in the current network of core areas. Farmer involvement and complicity, promoted by an appropriately designed CAP and collaboration of conservation bodies, will be crucial.
ACKNOWLEDGEMENTS
This research was jointly funded by the Dirección General de Investigación (project CGL2008–04282/BOS) and HNV project (MARM). We thank B. Arroyo for useful comments on the manuscript and F. Sánchez for help with data analysis and compilation in ArcGIS 9.3. The English was revised by Sally Bach. This manuscript is dedicated to our beloved Francisco ‘Kiko’ Suárez, whose previous work on sandgrouse stimulated this research, but who did not live to see this paper completed. We hope to achieve the high standards he exhibited in his science.