
Introduction
As the most common sulfide in the Earth’s crust [Reference Vaughan1], pyrite (FeS2) occurs in a wide variety of geological settings, including sedimentary deposits, hydrothermal veins, and metamorphic rocks. Industrially, pyrite is the raw ore mineral for manufacturing sulfuric acid [Reference Lin and Quvarfort2] and recovering Au [Reference Hiskey and Pritzker3], and is a semiconducting, optical material itself [Reference Barnard and Russo4]. On the other hand, because pyrite exists in coal and oil/gas shale as an accessory phase, the associated fossil fuel extraction may lead to emission of SO2 or SO3 when pyrite is oxidized, thereby posing environmental concerns [Reference Hu, Dam-Johansen, Wedel and Hansen5].
Because of its importance to many geological and industrial processes, thermal decomposition of pyrite has been studied using a number of experimental techniques, especially thermogravimetric analysis (TGA) and X-ray diffraction (XRD) [Reference Hu, Dam-Johansen, Wedel and Hansen5, Reference Deng, Wen, Chen, Xian and Wu6, Reference Hurst, Levy and Warne7, Reference Lambert, Simkovich and Walker8, Reference Bhargava, Garg and Subasinghe9]. The results demonstrate that the phases formed from pyrite decomposition and its reaction kinetics are highly dependent on experimental conditions, particularly the gas atmosphere used (O2, N2, air, inert gas, vacuum, etc.). In oxidative environments, pyrite is easily oxidized to iron oxides, such as hematite (α-Fe2O3) and magnetite (Fe3O4). Under nonoxidizing conditions, pyrrhotite (Fe1−xS with varying x) becomes the major product. Most of the earlier studies used isothermal or non-isothermal TGA at different temperatures or heating rates, respectively, followed by ex situ characterization of the post-TGA samples by XRD and other techniques. These measurements yielded kinetic parameters of pyrite thermal decomposition, such as the activation energy, which are sensitive to gas species and their partial pressures.
The primary aim of this study was to examine structural transformation and evolution when pyrite undergoes decomposition or, more precisely, desulfurization upon heating under vacuum using in situ high-temperature neutron diffraction [Reference Xu, Zhao, Vogel, Daemen and Hickmott10, Reference Xu, Zhao, Zhang, Hickmott and Daemen11, Reference Xu, Zhao, Vogel, Hickmott, Daemen and Hartl12, Reference Xu, Costa, Stanek and Navrotsky13, Reference Xu, Zhao, Hickmott, Lane, Vogel, Zhang and Daemen14]. In particular, the composition and structure of the nonstoichiometric pyrrhotite (Fe1−xS) vary systematically with increasing temperature and/or time. In addition, previous studies show that the thermal decomposition of pyrite progresses with a clear boundary between the unreacted pyrite and the formed product layer of pyrrhotite, as revealed by scanning electron microscopy (SEM) [Reference Hong and Fegley15]. Because neutrons are highly penetrating (versus X-rays), the use of neutron diffraction allows for investigation of the structures of both pyrrhotite and its parent pyrite when the transformation is incomplete. Moreover, as neutrons, through their magnetic moment, can directly probe magnetic structures of materials, neutron diffraction is an ideal tool for studying magnetic transitions, e.g., those occurring in troilite (FeS) [Reference Andresen16, Reference Wang and Salveson17, Reference Marshall, Nelmes, Loveday, Klotz, Besson, Hamel and Parise18, Reference Baranov, Ibrahim, Selezneva, Kazantsev, Volegov and Shishkin19, Reference Li and Franzen20, Reference Powell, Vaqueiro, Knight, Chapon and Sanchez21, Reference Tenailleau, Etschmann, Wang, Pring, Grguric and Studer22, Reference de Villiers and Liles23, Reference King and Prewitt24, Reference Andresen and Torbo25]. Another goal of this work was to characterize the kinetics of pyrite desulfurization using DTA–TGA (differential thermal analysis-thermogravimetric analysis), which can be correlated with the structural information revealed by neutron diffraction.
In this study, in situ high-temperature neutron diffraction was conducted on pyrite using a pulsed neutron source at temperatures up to 1073 K under vacuum. On heating, pyrite remained stable up to 773 K, at which it started to decompose into pyrrhotite and S2 gas. On further heating, all the pyrite transformed to pyrrhotite at 873 K, and the nonstoichiometric pyrrhotite continued to undergo desulfurization, i.e., decrease in x in Fe1−xS, with increasing temperature until the stoichiometric troilite (FeS) was formed at 1073 K. On cooling, troilite underwent a magnetic transition to an orthorhombic phase between 473 and 573 K, accompanied by a volume reduction. Rietveld analyses of the neutron data allow determination of structural parameters of these phases as a function of temperature. The structural mechanisms underlying pyrite desulfurization and related processes are discussed. In addition, to determine the kinetics of pyrite desulfurization, we performed DTA–TGA measurements in the same temperature range of 298–1073 K with different heating rates of 5, 10, 20, and 40 K/min under an argon atmosphere. Arrhenius analyses of the data yielded an activation energy E a of 302.3 ± 28.6 kJ/mol (based on DTA data) or 302.5 ± 26.4 kJ/mol (based on TGA data) and a ln(A) of 35.3 ± 0.1.
Results and discussion
Rietveld analysis of neutron diffraction data
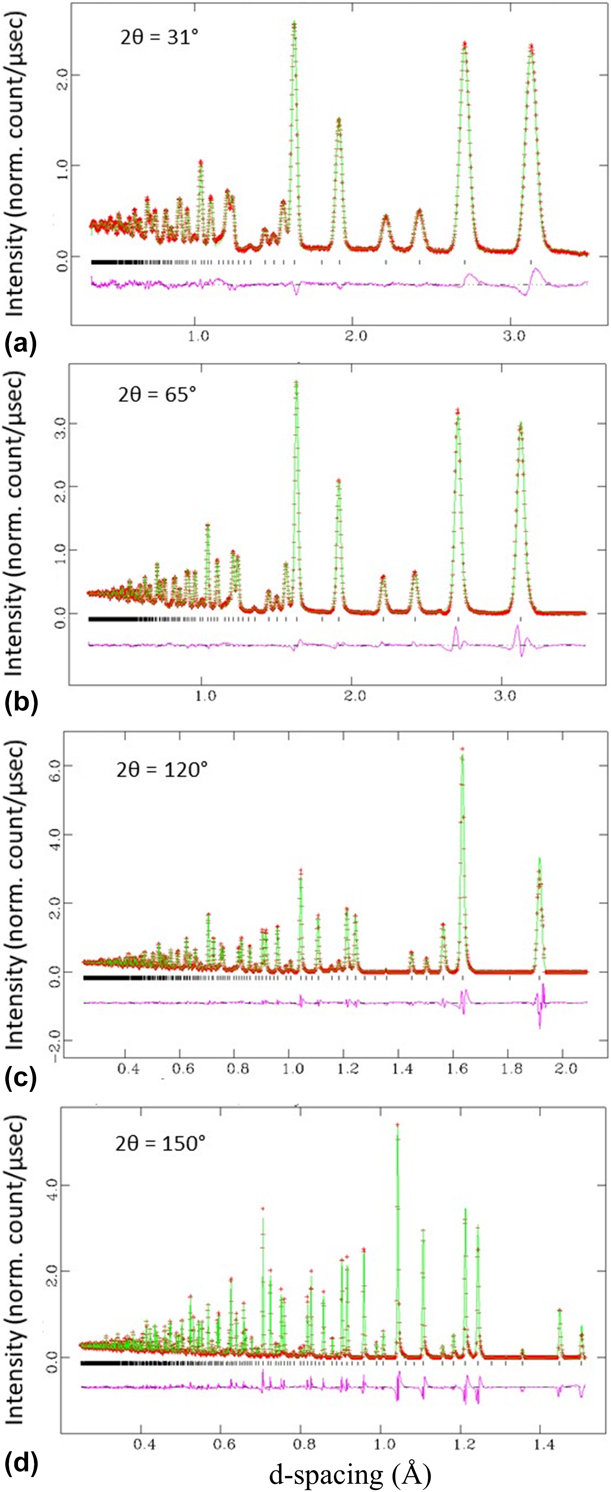
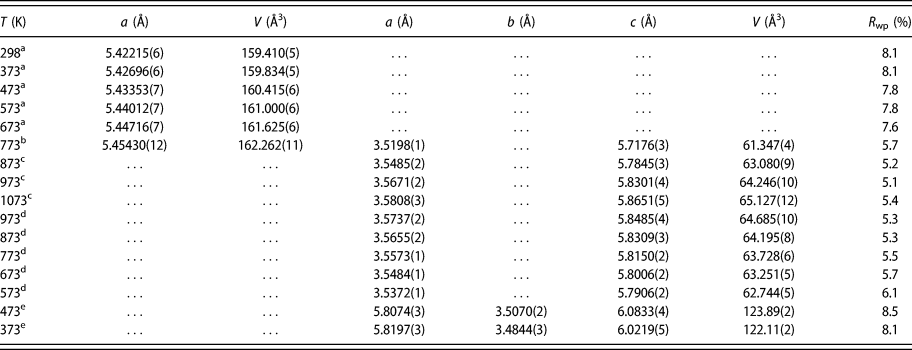
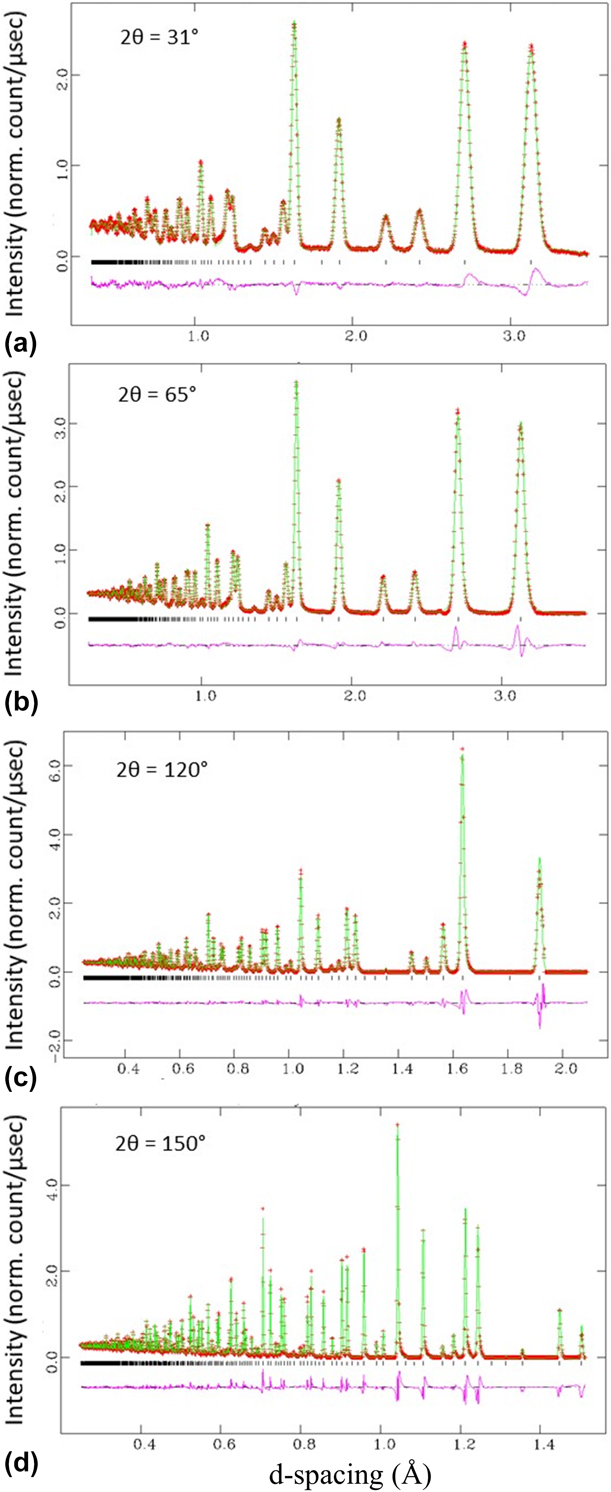
We analyzed the obtained high-temperature neutron diffraction data using the Rietveld method [Reference Rietveld26]. Structural parameters of pyrite (FeS2) and its decomposed pyrrhotite (Fe1−xS) and troilite (FeS) at different temperatures were derived. Figure 1 shows a representative set of fitted patterns (298 K), and Table I lists unit-cell parameters and refinement agreement indices of FeS2 and/or Fe1−xS on heating to 1073 K and then cooling to 373 K.
Fitted neutron diffraction patterns of FeS2 collected at (a) 2θ = 31°, (b) 2θ = 65°, (c) 2θ = 120°, and (d) 2θ = 150° at 298 K. Data are shown as red plus signs, and the solid green curve is the best fit to the data. Tick marks below the pattern show the positions of allowed reflections, and the lower curve represents the difference between the observed and calculated profiles.
Unit-cell parameters and refinement agreement indices of FeS2 and/or Fe1−xS.

a Heating: pyrite (FeS2, space group Pa  $\bar 3$).
b Heating: a mixture of pyrite and pyrrhotite with the refined molar ratio FeS2:Fe1−xS = 0.173:0.827.
c Heating: pyrrhotite (Fe1−xS, space group P63/mmc).
d Cooling: troilite (FeS, space group P63/mmc).
e Cooling: troilite (FeS, space group Pnma).
Thermal decomposition of pyrite under vacuum
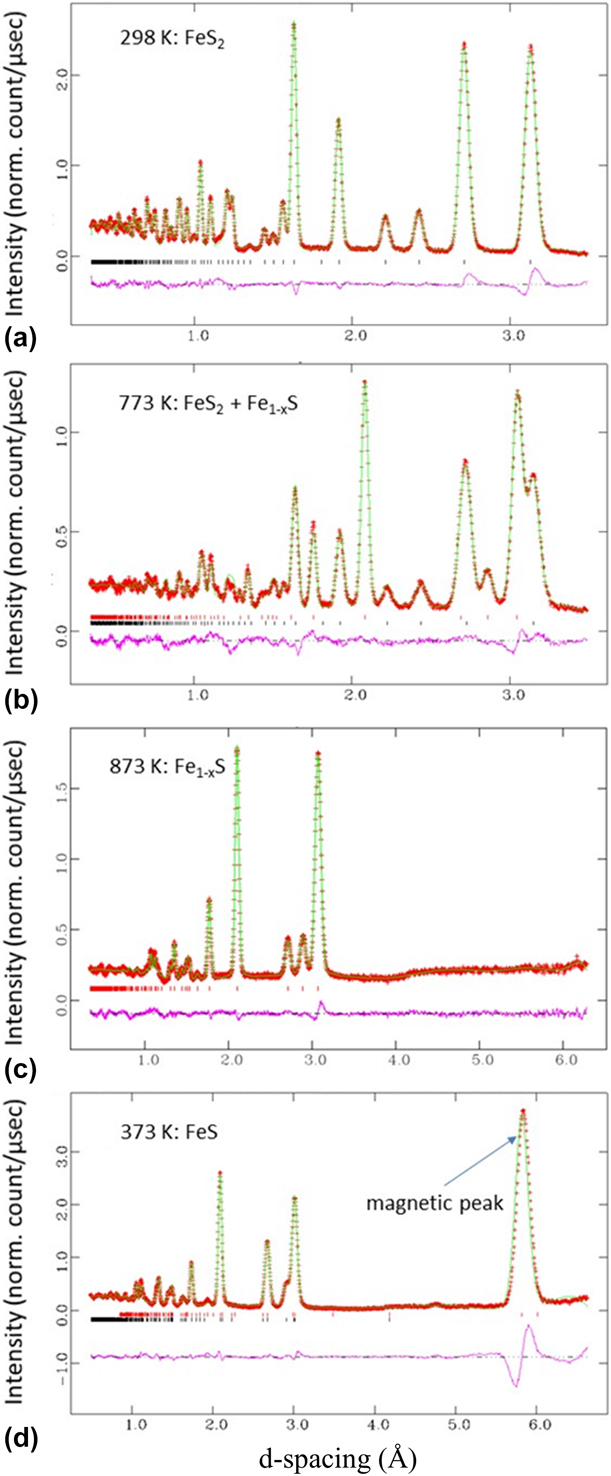
Our high-temperature neutron diffraction patterns indicate that FeS2 was stable from 298 to 673 K (Fig. 2(a)). However, the sample partially decomposed into pyrrhotite (Fe1−xS) and S2 (g) when the temperature reached 773 K [Fig. 2(b)], as shown by Eq. (1):
 $$\left( {1 - x} \right){\rm{Fe}}{{\rm{S}}_{2\left( {{\rm{solid}}} \right)}} = {\rm{F}}{{\rm{e}}_{1 - x}}{{\rm{S}}_{\left( {{\rm{solid}}} \right)}} + [{{\left( {1 - 2x} \right)} / {2]{{\rm{S}}_{2\left( {{\rm{gas}}} \right)}}\quad .}}$$
Selected neutron diffraction patterns (2θ = 31°) on heating pyrite to 1073 K and then cooled down to 373 K: (a) 298 K: pyrite, FeS2; (b) heating to 773 K: partial decomposition of pyrite into pyrrhotite, FeS2 + Fe1−xS; (c) heating to 873 K: complete decomposition of pyrite into pyrrhotite, Fe1−xS; and (d) cooling to 373 K: troilite, FeS (Pnma with a magnetic structure).
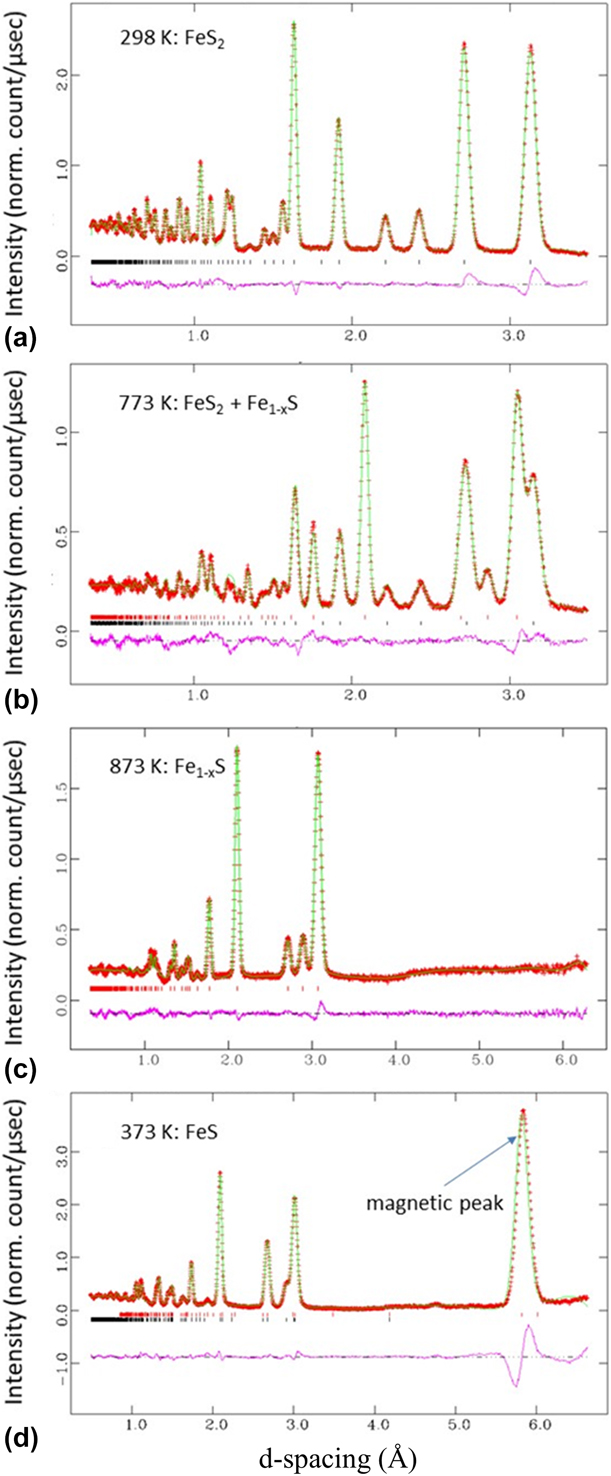
The refined molar ratio FeS2:Fe1−xS at 773 K is 0.173:0.827. On further heating to 873 K, all the pyrite transformed to pyrrhotite [Fig. 2(c)]. Thus, the onset temperature of the decomposition (T d) lies between 673 and 773 K. As shown in previous studies, the decomposition temperature may vary depending on the heating paths (heating rate and dwell time) used and the partial S2 pressure. Our lower T d compared with previously reported values (e.g., T d = 799.35 K [Reference Deng, Wen, Chen, Xian and Wu6]) may be due to the longer dwell time needed for neutron data collection and/or the lower partial pressure (the sample can was not fully sealed, and the sample was under vacuum). As shown later, this T d is also much lower than those (around 900 K) measured with DTA–TGA at different heating rates under Ar atmosphere, as there was no dwelling during the later measurements. In addition, as revealed by SEM [Reference Xu, Zhao, Vogel, Daemen and Hickmott10], pyrite decomposition involves formation of a core–shell structure consisting of pyrrhotite shell and unreacted pyrite core. Thus, the grain size of pyrite may play a role in the kinetics of its decomposition.
Thermal expansion of pyrite
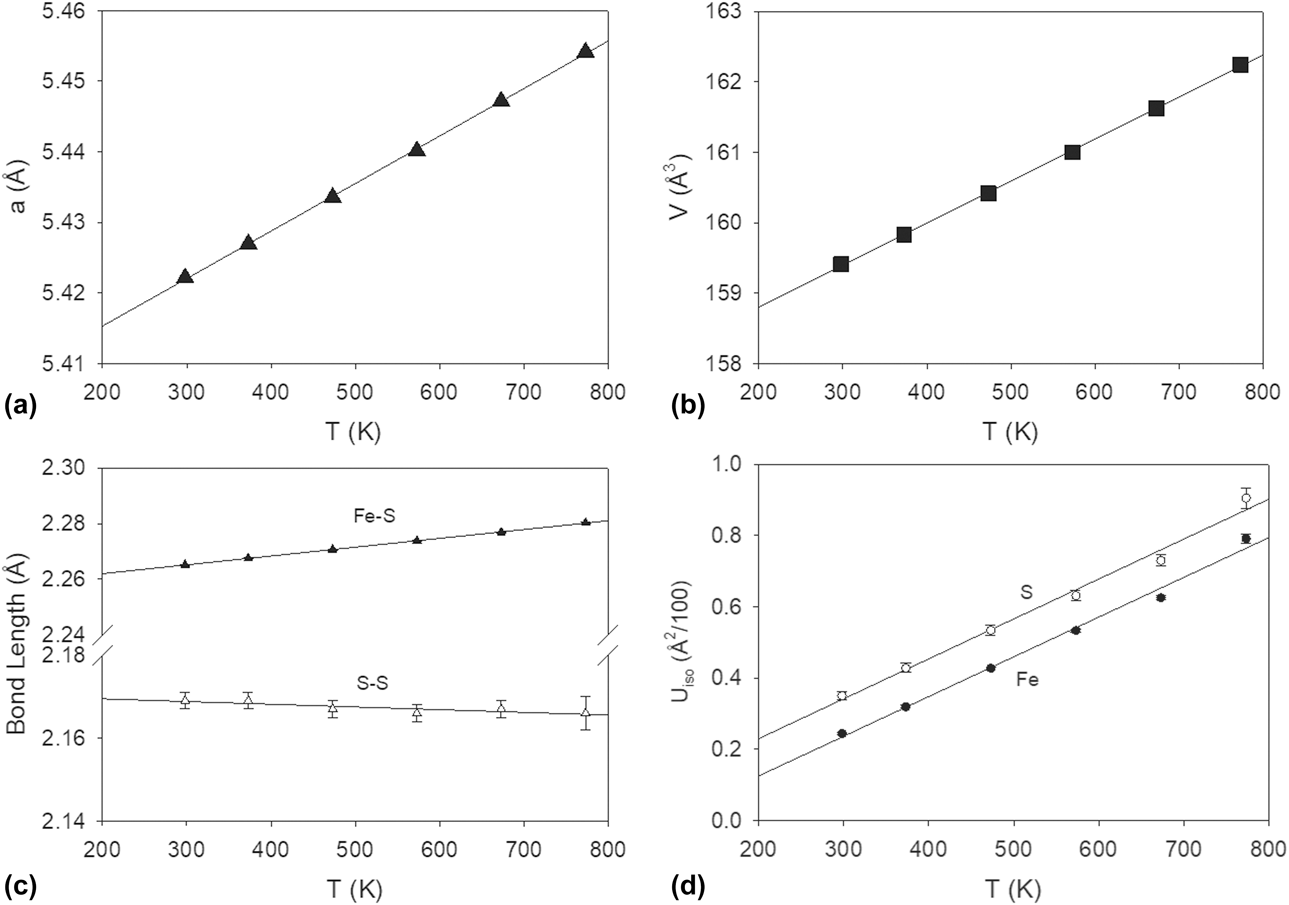
The obtained unit-cell parameter a and cell volume V of pyrite from 298 to 773 K are plotted in Figs. 3(a) and 3(b), respectively. On heating, cell parameter a increases, and thus cell volume V also increases, as revealed by previous XRD measurements [Reference Chrysta27]. To obtain the coefficients of thermal expansion (CTEs), we fitted these data to linear relations:
 $$a = \left[ {6.73\left( 6 \right) \times {{10}^{ - 5}}} \right]T + 5.4019\left( 3 \right)\;\left( {{R^2} = 0.9997} \right)\quad ,$$
 $$V = \left[ {5.97\left( 6 \right) \times {{10}^{ - 3}}} \right]T + 157.61\left( 3 \right)\;\left( {{R^2} = 0.9996} \right)\quad .$$
Variations of (a) cell parameters a, (b) cell volume V, (c) Fe–S and S–S bond lengths, and (d) isotropic thermal parameters (U iso) for Fe and S of pyrite as a function of temperature. The lines are the best fits to the data. For the data point without an error bar, its uncertainty is smaller than the size of the symbol.

The mean CTEs of FeS2 in the temperature range 298–773 K are αa = 6.73 × 10⁻⁵ K−1 and αV = 5.97 × 10⁻³ K−1.
The unit-cell dimensional variations with temperature can be interpreted in terms of the pyrite structure. Pyrite has a cubic structure with the space group Pa  $\bar 3$ [Fig. 4(a)]. In the structure, each pair of S atoms forms a dumbbell, and each low-spin divalent Fe is coordinated to six S atoms, forming a corner-sharing [FeS6] octahedral framework [Reference Vaughan1]. As shown in Fig. 3(c), with increasing temperature, whereas the S–S bond length remains approximately unchanged (or even slightly decreases), the Fe–S bond length increases steadily, which is due to the different bonding characters of S–S and Fe–S. Thus, the thermal expansion of pyrite is largely due to the Fe–S bond lengthening or [FeS6] octahedral expansion.
Crystal structures of (a) pyrite (FeS2, space group Pa  $\bar 3$) and (b) pyrrhotite (Fe1−xS, high-temperature polymorph with the NiAs-type structure, space group P63/mmc). Brown balls represent Fe atoms, and yellow balls represent S atoms. Dashed lines define the unit cell.

Figure 3(d) shows variation of isotropic displacement factors (U iso) of Fe and S with temperature. At a given temperature, U iso(Fe) < U iso(S). With increasing temperature, the U iso values for both Fe and S become larger. This is consistent with the general trend that the lighter the atom and the higher the temperature, the larger the magnitude of atomic vibration.
Evolution of pyrrhotite
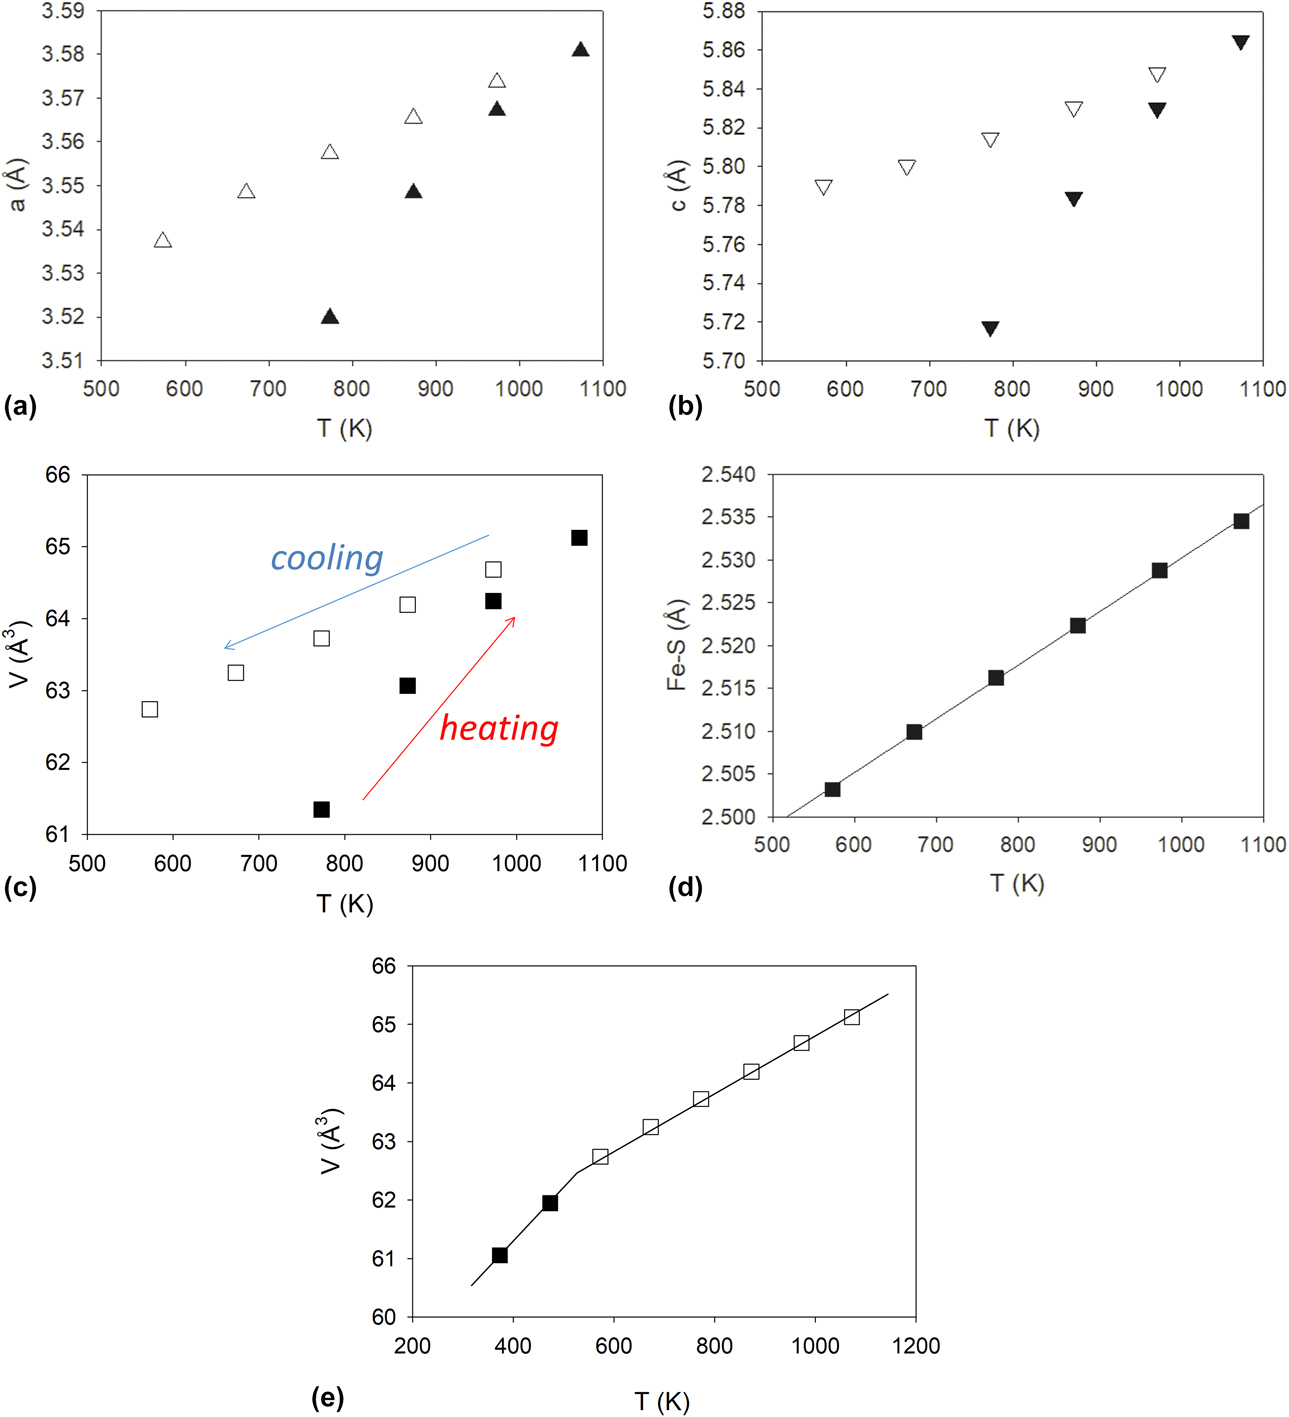
Even after the pyrite completely converted to pyrrhotite (Fe1−xS) at 873 K, the desulfurization process continued. Figures 5a, 5b and 5c plot variation of cell parameters a, c, and cell volume V, respectively, of pyrrhotite (the NiAs-type structure, space group P63/mmc) as a function of temperature. With increasing temperature from 773 to 1073 K, a, c, and V all increase. Upon cooling from 1073 K, they decrease. However, the rates of lattice contraction on cooling are much smaller than those of lattice expansion on heating. This behavior can be interpreted by continuous desulfurization of pyrrhotite (i.e., x in Fe1−xS decreases, although the x values were not determined due to the limited resolution of neutron diffraction data) on heating until the stoichiometric troilite (FeS) was formed at 1073 K. Because of the removal of S from the Fe1−xS structure (equivalent to addition of Fe or decrease in x), desulfurization of pyrrhotite leads to expansion of its unit cell. Furthermore, increasing temperature results in conventional thermal expansion of pyrrhotite. The summation of these two effects causes larger rates of lattice expansion on heating. By contrast, during the subsequent cooling, because the composition of FeS remains constant (no desulfurization), the rates of lattice contraction are much lower. In other words, if there were no desulfurization on heating, the rates of expansion in a, c, and V would be the same as those of contraction in a, c, and V, respectively.
Variation of cell parameters (a) a, (b) c, (c) cell volume V, and (d) Fe–S bond length of pyrrhotite as a function of temperature. (e) Variation of cell volume V of troilite as a function of temperature. The uncertainty of each data point is smaller than the size of the symbol. The slope change is due to the hexagonal–orthorhombic transition.
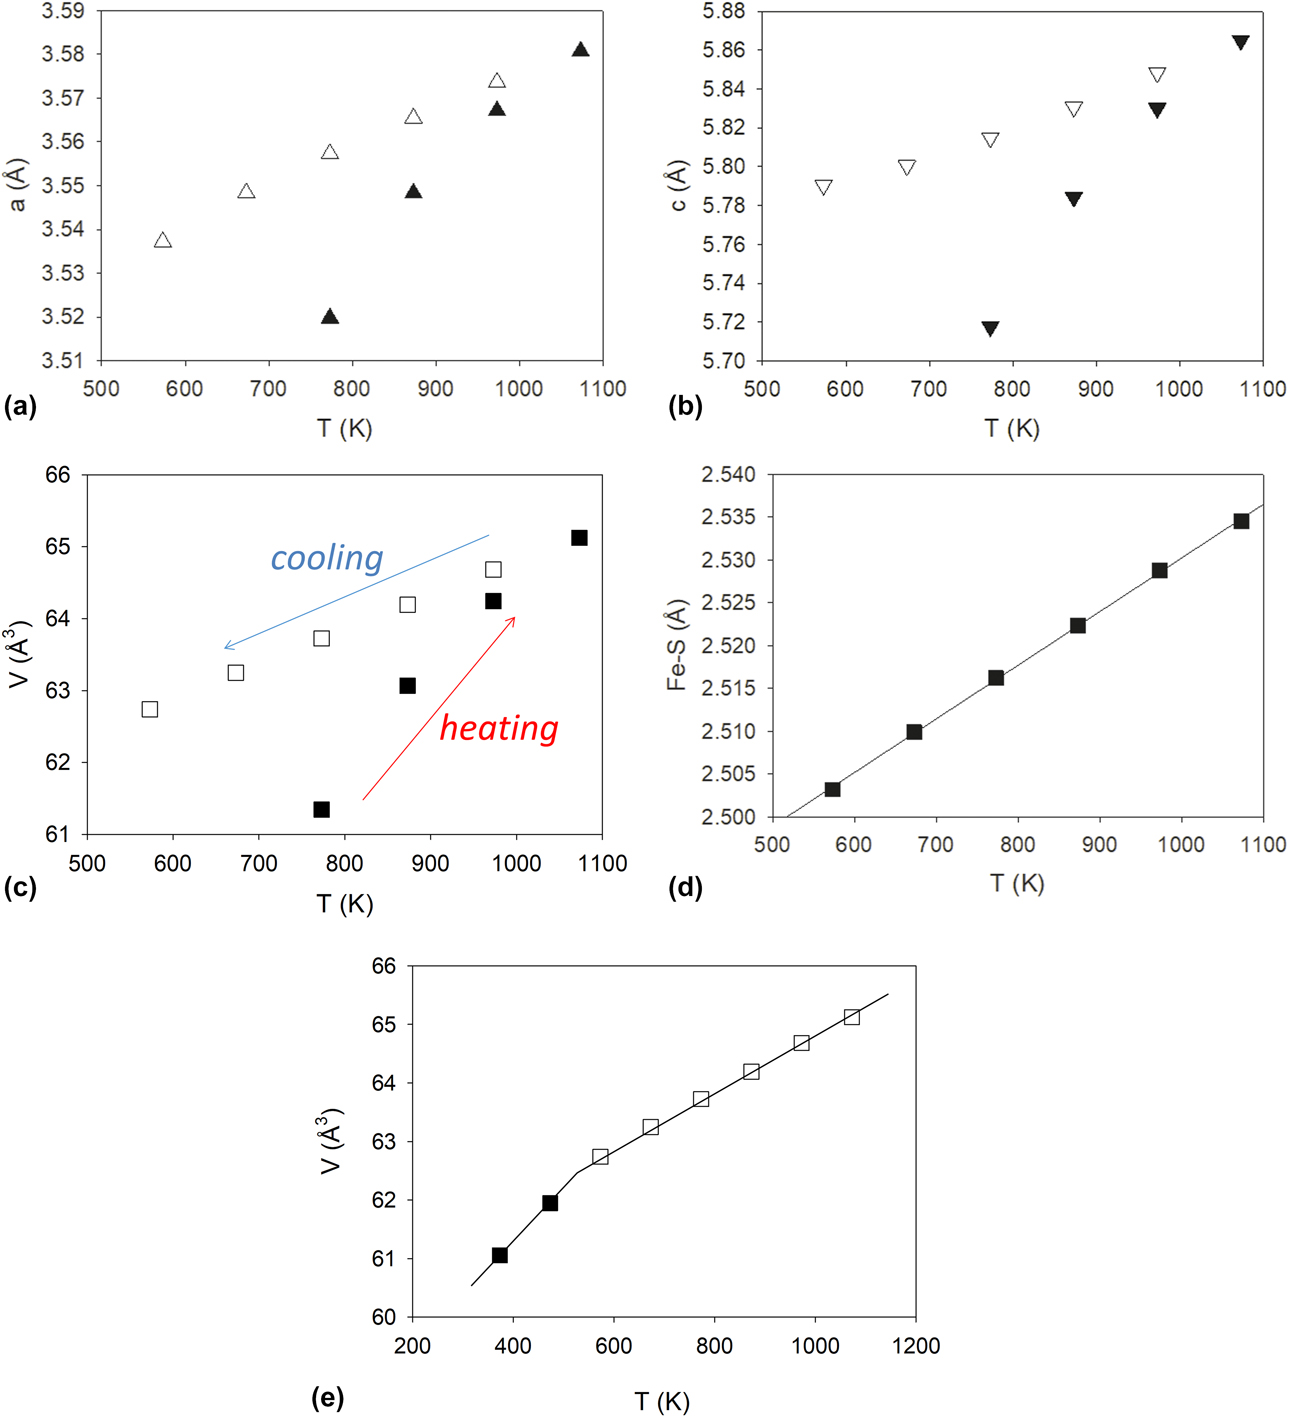
To obtain the CTEs of hexagonal troilite FeS, we fitted its cell data collected on cooling from 1073 to 573 K (below which a phase transition occurs, see below) to linear relations:
 $$\hskip-8pta = \left[ {8.6\left( 3 \right) \times {{10}^{ - 5}}} \right]T + 3.490\left( 3 \right)\;\left( {{R^2} = 0.9947} \right)\quad ,$$
 $$\hskip-2ptc = \left[ {1.52\left( 6 \right) \times {{10}^{ - 4}}} \right]T + 5.700\left( 5 \right)\;\left( {{R^2} = 0.9928} \right)\quad ,$$
 $$V = \left[ {4.767\left( 4 \right) \times {{10}^{ - 3}}} \right]T + 60.03\left( 4 \right)\;\left( {{R^2} = 0.9997} \right)\quad .$$
The mean CTEs of FeS in the temperature range 573–1073 K are αa = 8.60 × 10⁻⁵ K−1, αc = 15.2 × 10⁻⁵ K−1, and αV = 4.77 × 10⁻³ K−1. Because the CTE along the c-axis is almost two times that along the a-axis, the thermal expansion of FeS is anisotropic (consistent with previous XRD measurements [Reference Selivanov, Vershinin and Gulyaeva28]), which may be explained in terms of the layer-like nature of its structure [Fig. 4(b)]. On the other hand, similar to pyrite, the thermal expansion of FeS is largely due to the Fe–S bond lengthening or [FeS6] octahedral expansion [Fig. 5(d)] (although the rate of increase in Fe–S in FeS2 with increasing temperature is smaller, presumably due to the occurrence of S2 dumbbells in the pyrite structure).
Magnetic transition in troilite
Upon cooling troilite (FeS) from 573 to 473 K, a strong neutron diffraction peak around 5.8 Å appeared, and this peak persisted on further cooling to 373 K [Fig. 2(d)]. This phenomenon can be attributed to a magnetic transition to the orthorhombic phase (space group Pnma) with a magnetic moment of Fe along the b-axis [Reference Marshall, Nelmes, Loveday, Klotz, Besson, Hamel and Parise18]. Note that this structure is MnP type and has been observed at high pressure [Reference Marshall, Nelmes, Loveday, Klotz, Besson, Hamel and Parise18, Reference King and Prewitt24, Reference Andresen and Torbo25]. This transformation is also manifested by an increase in the slope of variations in cell volume with decreasing temperature [Fig. 5(e)]. More specifically, in addition to the magnetic ordering, the structure becomes denser and decreases its symmetry from hexagonal (P63/mmc) to orthorhombic (Pnma).
Kinetics of pyrite desulfurization
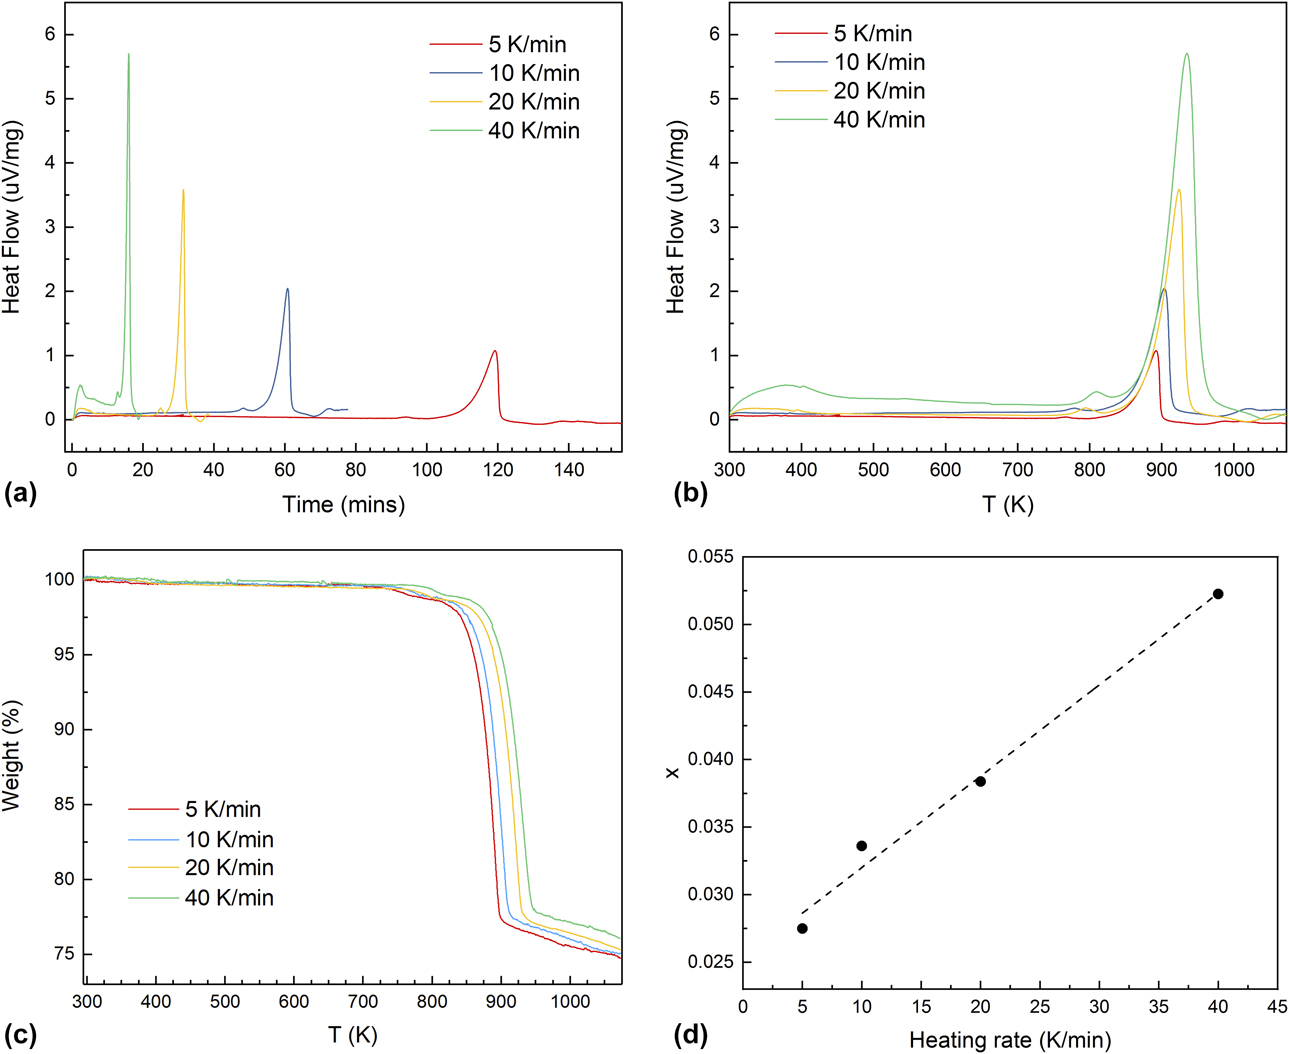
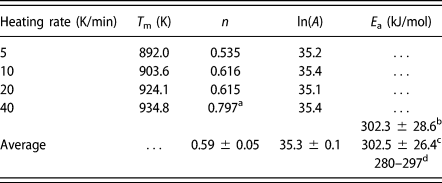
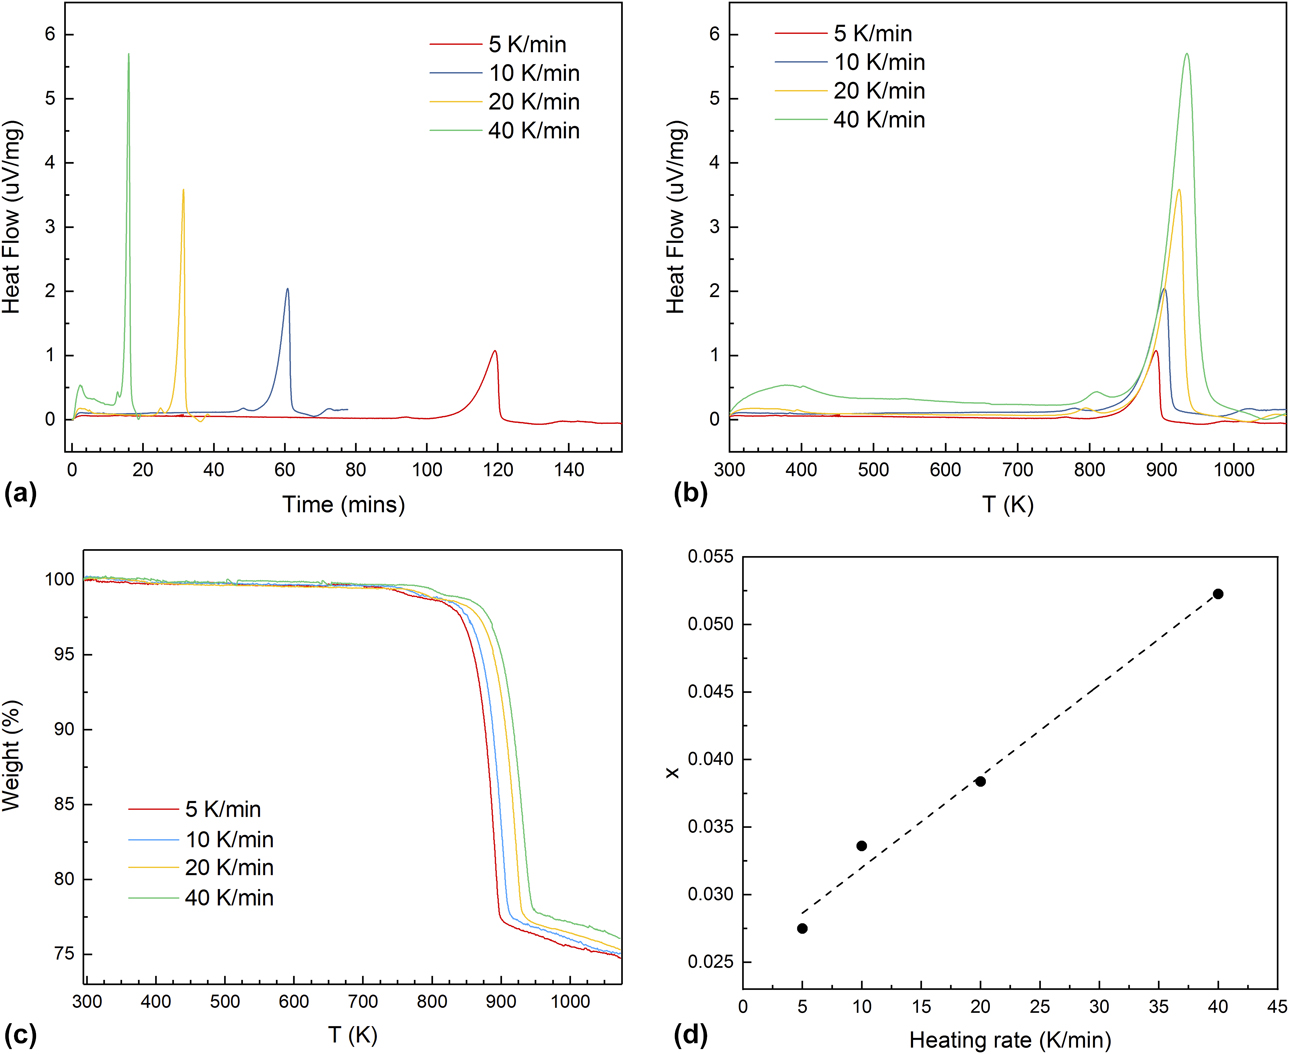
To characterize the kinetics of pyrite desulfurization, we conducted a series of DTA–TGA experiments from room temperature up to 1073 K with heating rates, ϕ, of 5, 10, 20, and 40 K/min under an argon atmosphere [Figs. 6(a)–6(c)]. Note that compared with the neutron diffraction experiments described above, the heating rates for the DTA–TGA kinetic measurements were higher, there was no dwelling at a given temperature, and argon atmosphere (instead of vacuum) was used. Thus, the results from these two sets of experiments cannot be compared in a point-by-point fashion. The thermal decomposition, described by Eq. (1), produces one dominant endothermic peak and the corresponding weight loss. The slower weight loss after reaction (1) is complete [Fig. 6(c)] is due to the continuous desulfurization of pyrrhotite, as revealed by neutron diffraction. With increasing the heating rate, the heat flow-time peak becomes sharper [Fig. 6(a)], the decomposition peak temperature systematically increases [Fig. 6(b)], and so does the weight loss temperature [Fig. 6(c)]. The heating rate–dependent weight loss leads to variation in the x value of the final decomposed pyrrhotite Fe1−xS at 1073 K based on Eq. (1). As shown in Fig. 6(d), x exhibits an approximately linear relation with the heating rate. Because there were no dwellings during the DTA–TGA measurements (i.e., the total duration for each measurement was much shorter), the final decomposed Fe1−xS did not reach the stoichiometric FeS, as in the neutron experiments. In addition, the DTA (heat flow - temperature) peak becomes larger with an increase in the heating rate [Fig. 6(b)]. To characterize the heat flow profile of each heating segment, we denote T m as the temperature of the sample at the peak of the heat flow, which also increases as the heating rate increases. The order of reaction (n), which characterizes how the reaction rate relates to the concentration of the reactant (pyrite here), can be determined from the asymmetry of the heat flow peak [Reference Wendlandt29, Reference Kissinger30], which is described by a shape index S defined as the ratio of absolute values of slopes of the tangents to the DTA peak curves at the inflection points. The reaction order can then be derived as  $n = \sqrt {{S / {0.63}}}$ [Reference Kissinger30], and the calculated n values are listed in Table II with an average value of 0.59 ± 0.05. The activation energy E a can be derived from the equation referenced by Kissinger [Reference Kissinger30]:
 $${{{\rm{d}}\left( {{{\ln \;\phi } / {T_{\rm{m}}^2}}} \right)} \over {{\rm{d}}\left( {{1 / {{T_{\rm{m}}}}}} \right)}} = - {{{E_{\rm{a}}}} \over R}\quad .$$
DTA (a and b) and TGA (c) curves of FeS2 from room temperature to 1073 K with heating rates of 5, 10, 20, and 40 K/min under an argon atmosphere. (d) Variation of x in Fe1−xS as a function of the heating rate.
Kinetic parameters of pyrite desulfurization derived from DTA–TGA data up to 1073 K under Ar atmosphere.
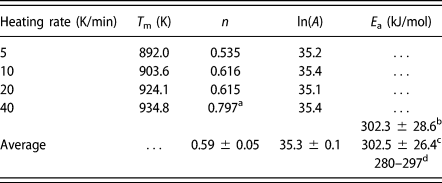
a Not used in the n value averaging.
b From the DTA data.
c From the TGA data.
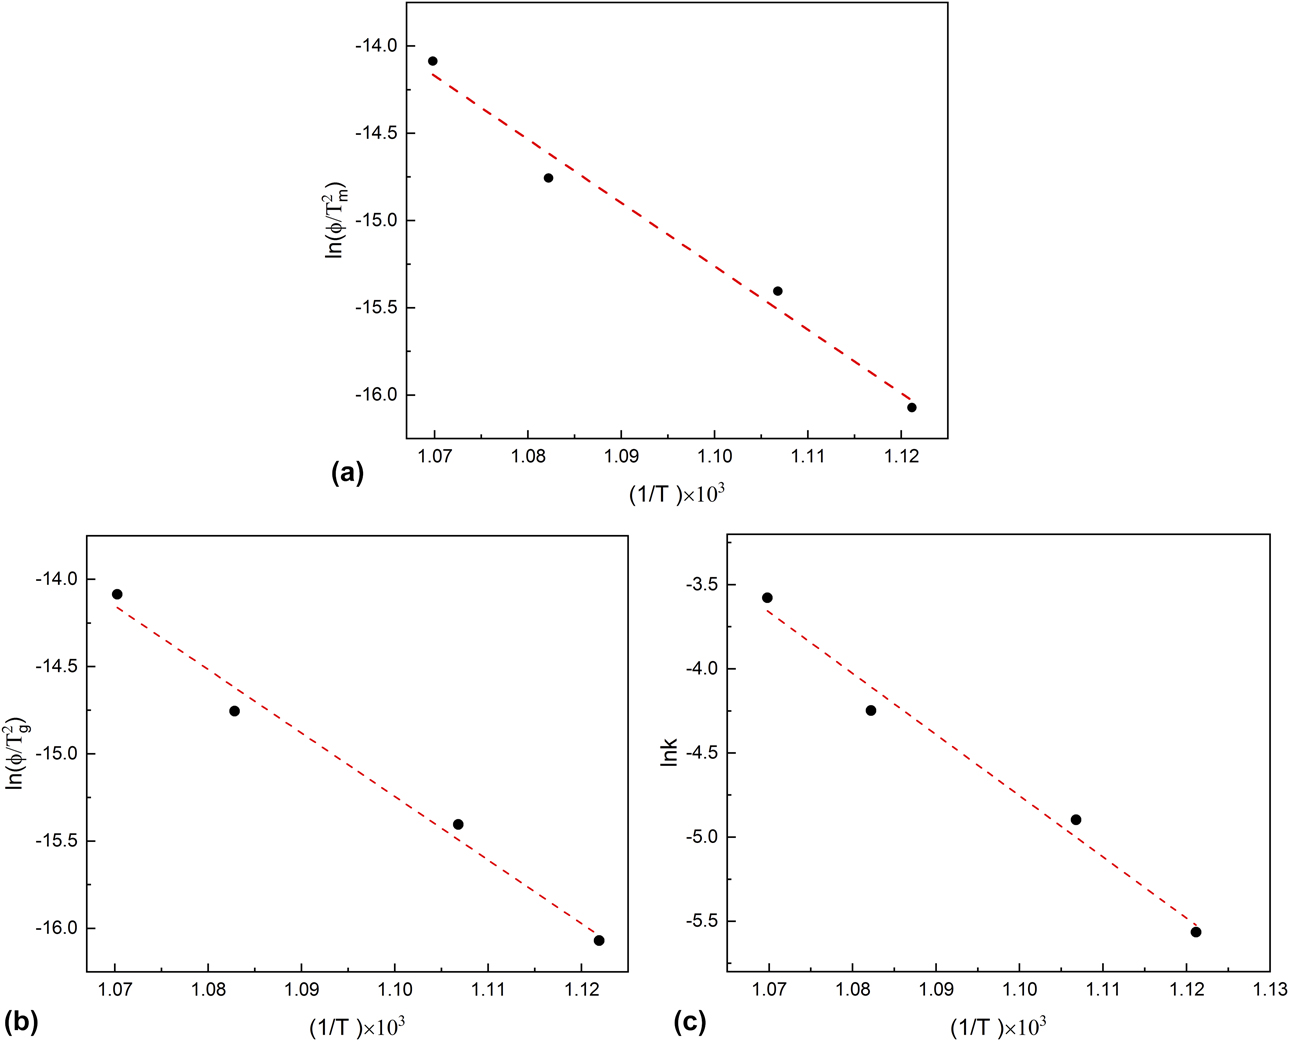
The activation energy of pyrite desulfurization is thus obtained from the slope value of the linear fitting Eq. (2) using DTA data [Fig. 7(a)] to be 302.3 ± 28.6 kJ/mol, or TGA data [Fig. 7(b)] to be 302.5 ± 26.4 kJ/mol. Having known the values of E a, n, T m, and ϕ, the frequency factor A, i.e., the pre-exponential factor after integration of Eq. (2), which represents the frequency of collisions between reactants, can be determined via Eq. (3), and its natural logarithm can be calculated for each DTA–TGA experiment shown in Table II with an average value of ln(A) = 35.3 ± 0.1,
 $${{{E_{\rm{a}}}\phi } \over {RT_{\rm{m}}^2}} = A\left[ {1 + \left( {1 - n} \right){{2R{T_{\rm{m}}}} \over {{E_{\rm{a}}}}}} \right] \cdot {{\rm{e}}^{{{ - {E_{\rm{a}}}} / {R{T_{\rm{m}}}}}}}\quad .$$
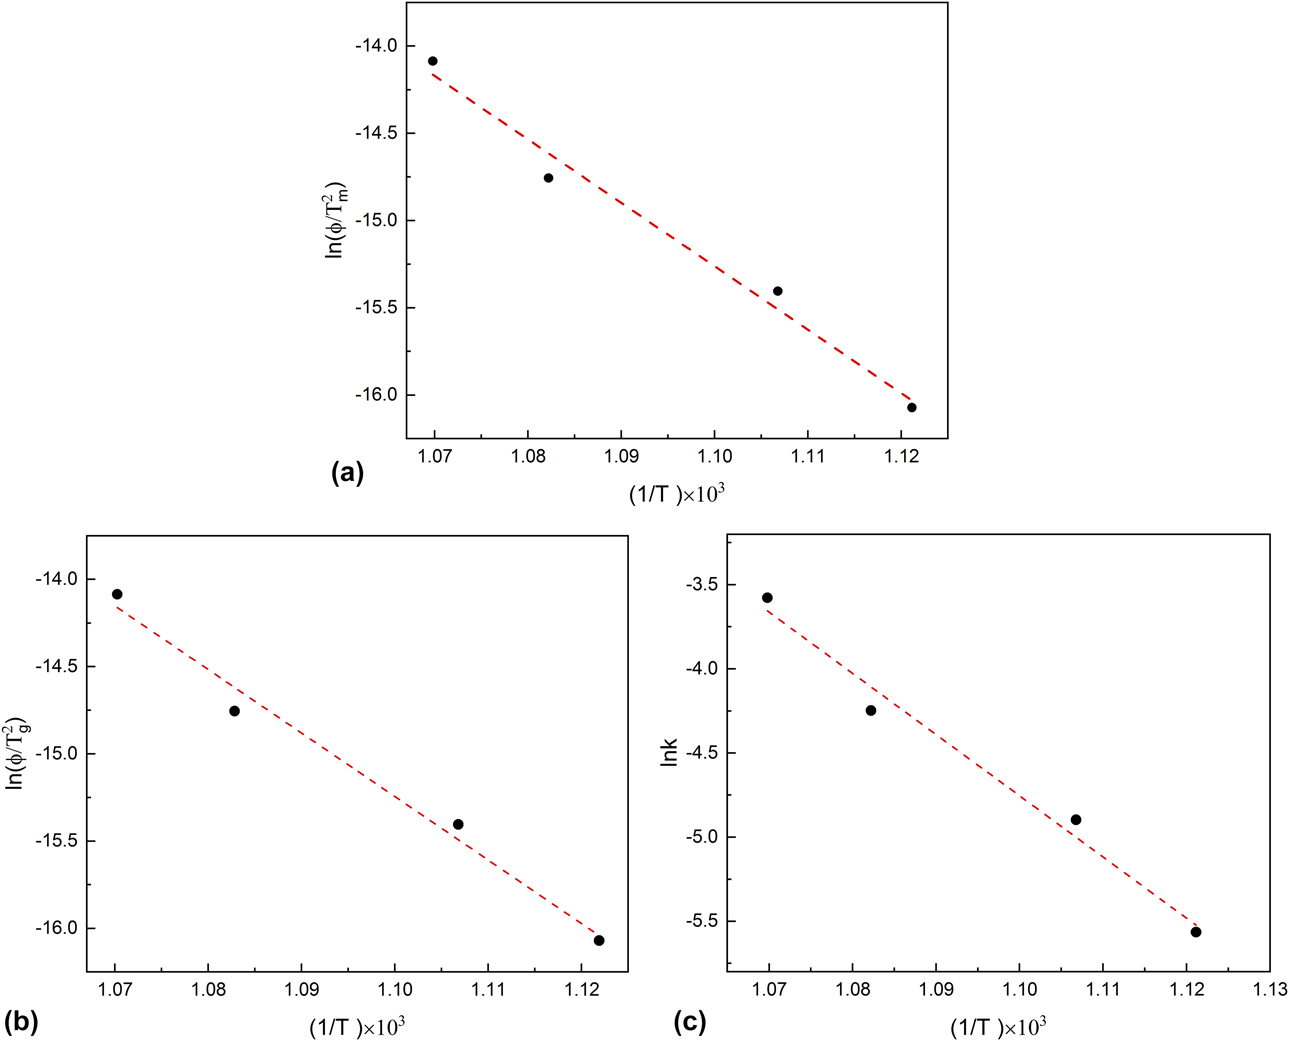
The Arrhenius plot for the pyrite decomposition reaction can also be made [Fig. 7(c)] based on Eq. (4), where ln(k) has a linear relationship against 1/T:
 $$k = A{{\rm{e}}^{{{ - {E_{\rm{a}}}} / {RT}}}}\quad .$$
The obtained kinetic parameters are in good agreement with those from previous studies [Reference Lambert, Simkovich and Walker8, Reference Hong and Fegley15, Reference Coats and Bright31, Reference Charpentier and Masset32] (Table II).
Conclusions
Using time-of-flight neutron diffraction coupled with Rietveld analysis, we have investigated thermal desulfurization of FeS2 under vacuum in the temperature range 298–1073 K. On heating, pyrite remained stable up to 773 K, at which it started to decompose into Fe1−xS and S2 gas. Rietveld analysis of the neutron data from 298 to 773 K allowed determination of the thermal expansion coefficient of pyrite, which largely results from the expansion of Fe–S bond. With further increase in temperature to 1073 K, all the pyrite transformed to Fe1−xS at 873 K. Unit-cell parameters of Fe1−xS increase on heating and decrease on cooling. However, the rates in cell expansion are larger than those in contraction. This hysteresis behavior can be attributed to continuous desulfurization of Fe1−xS with increasing temperature until the stoichiometric troilite FeS was formed at 1073 K. On cooling, troilite underwent a magnetic transition to an orthorhombic structure with a magnetic moment of Fe along the b-axis between 473 and 573 K. In addition, using DTA–TGA, we characterized the kinetics of pyrite decomposition under an argon atmosphere. Arrhenius analyses yielded an activation energy E a of 302.3 ± 28.6 kJ/mol (based on DTA data) or 302.5 ± 26.4 kJ/mol (based on TGA data) and a ln(A) of 35.3 ± 0.1. This study represents an example of combining in situ structural characterization with kinetic/thermodynamic measurements to determine the structure–stability relationships of materials [Reference Li, Zhang, Tan, Gerdes, Luo, Xu, Hollingsworth, Klinke, Chen and Wang33, Reference Phillips, Xu, Heaney and Navrotsky34, Reference Zhu, Du, Yu, Zhang, Xu, Vogel, Germann, Francisco, Izumi, Momma, Kawamura, Jin and Zhao35, Reference Zhang, Celestian, Parise, Xu and Heaney36, Reference Xu, Navrotsky, Nyman and Nenoff37].
Methods and approaches
Neutron diffraction
Time-of-flight neutron diffraction experiments were performed at the Nanoscale-Ordered Materials Diffractometer (NOMAD) beamline of the Spallation Neutron Source, Oak Ridge National Laboratory [Reference Neuefeind, Feygenson, Carruth, Hoffmann and Chipley38]. NOMAD is a high-flux, medium-resolution diffractometer that uses a large bandwidth of neutron energies and extensive detector coverage, affording a broad range of scattering angles (Q-range) and peak resolutions (δQ/Q) for structural determinations of crystalline, nanocrystalline, and amorphous materials. A pyrite powder sample (Sigma-Aldrich, St. Louis, MO, ∼325 mesh, 99.8% trace metals basis) was put into a silica-glass ampoule, which was in turn placed in a vanadium can of 0.95 cm diameter. (The use of the silica-glass ampoule was to avoid corrosive reaction of the vanadium can with the evolved S2 gas at high temperatures.) The can was then mounted in an ILL-type high-temperature furnace with vanadium heating elements and heatshields for contamination-free diffraction data collection. Data were collected under vacuum (<10−6 torr) on heating from 298 to 1073 K and then cooled down to 373 K with an interval of 100 K. For each temperature point, six detector banks with nominal diffraction angles of 7°, 15°, 31°, 65°, 120°, and 150° were simultaneously used. The heating rate during the 100-K intervals was ∼5 K/min, and the dwell time at each targeted temperature was ∼1 h for data collection. One-hour background measurements were made for an empty vanadium can and empty instrument and were subtracted from the raw data.
Rietveld analysis
The obtained neutron data were analyzed using the Rietveld method with the General Structure Analysis System (GSAS) program of Larson and Von Dreele [Reference Larson and Von Dreele39]. The starting structural parameters for FeS2 at 298 K were taken from the study of Bayliss [Reference Bayliss40]. The starting parameters for Fe1−xS (including hexagonal FeS, the NiAs-type structure, space group P63/mmc) at 773 K were taken from the study of Alsén [Reference Alsén41]. The starting parameters for orthorhombic FeS at 473 K were taken from the study of Marshall et al. [Reference Marshall, Nelmes, Loveday, Klotz, Besson, Hamel and Parise18]. We used the refined structural parameters at a given temperature as the starting parameters for the next temperature point and continued this procedure systematically with increasing or decreasing temperature. For the run at 773 K, because a portion of the pyrite sample decomposed into pyrrhotite (Fe1−xS) and S2 gas, we included pyrrhotite as a secondary phase in our Rietveld analysis. For each temperature point, four datasets from the detectors at 2θ = 31°, 65°, 120°, and 150° were simultaneously analyzed (the 7° and 15° datasets were not used because of their relatively low resolutions). The refinements proceeded as follows: after the scale factor and four background terms (Shifted Chebyshev function) for each histogram had converged, lattice parameters and phase fraction (for the run at 773 K) were added and optimized. Fourteen or eighteen additional background terms were then added for each histogram, and the peak profiles were fitted to a TOF profile function [Reference Von Dreele, Jorgensen and Windsor42]. On convergence of the preceding parameters, atomic coordinates and atomic displacement parameters for Fe and S were refined.
Thermal analysis
High-temperature DTA–TGA measurements were conducted using a Netzsch simultaneous thermal analyzer (STA) 449 system. About 5–15 mg of the sample powders were packed in a graphite crucible. The loaded crucible, along with an empty graphite crucible, was then placed into the calorimeter and heated to 1073 K at a preset heating rate (5–40 K/min) under a flowing Ar atmosphere (90 mL/min). For baseline correction, an earlier scan using the empty graphite crucible was run under the same conditions. Temperature was calibrated against the melting points of several metal standards (e.g., In and Al). Sensitivity calibration was done using sapphire as the standard. Data collection and processing were performed using the Netzsch software (Netzsch Group, Selb, Germany) associated with the instrument. Detailed procedures have been described previously [Reference Guo, Ushakov, Labs, Curtius, Bosbach and Navrotsky43, Reference Guo, Wu, Xu, Burns and Navrotsky44, Reference Guo and Xu45].
Acknowledgments
We thank the three anonymous reviewers for their helpful comments. This work was supported by the US Department of Energy (DOE) Energy Efficiency & Renewable Energy (EERE) program. This research used resources at the Spallation Neutron Source, a DOE Office of Science User Facility operated by the Oak Ridge National Laboratory. Los Alamos National Laboratory, an affirmative action/equal opportunity employer, is managed by Triad National Security, LLC, for the National Nuclear Security Administration of the U.S. Department of Energy under contract 89233218CNA000001.