Introduction
Schizophrenia is a complex brain disorder with putative dysconnectivity between multiple brain regions (Friston & Frith, Reference Friston and Frith1995). Although genetic factors have been proven to play an important role in the pathogenesis of schizophrenia, little success has so far been made in gene mapping. Most studies have used the current psychiatric diagnostic classification system to define an individual's phenotype. Invariably, this contributes to clinical heterogeneity that introduces ‘noise’ in the analysis. To counteract this, the endophenotype approach has been proposed and it is thought that cognitive deficits and neuroimaging as endophenotypes could facilitate genetic studies of schizophrenia (Gottesman & Gould, Reference Gottesman and Gould2003). However, Flint & Munafo (Reference Flint and Munafo2007) found in a meta-analysis that the effect sizes of genetic variations were not necessarily larger for the endophenotypes than the phenotype itself. Accordingly, ‘extended endophenotypes’ have been proposed via pathophysiological and genetic studies of schizophrenia to improve the utility of the traditional endophenotype strategy, since they combine several endophenotypes, e.g. brain structure and cognitive function (Prasad & Keshavan, Reference Prasad and Keshavan2008).
Consequently, if diffusion tensor images are used to assess white matter (WM) structural integrity and connectivity in vivo, quantitative measures are yielded such as fractional anisotropy (FA), which reflects the integrity of WM tracts. One theory suggests that the pathophysiological mechanism of schizophrenia may lie in abnormal interactions or dysconnectivity between distributed networks of brain regions (Friston & Frith, Reference Friston and Frith1995). FA reduction has been found in many parts of the principal WM bundles in schizophrenia, with diverse results across studies (Lee Reference Lee, Yoshida, Kubicki, Bouix, Westin, Kindlmann, Niznikiewicz, Cohen, McCarley and Shenton2009; Phillips et al. Reference Phillips, Nuechterlein, Clark, Hamilton, Asarnow, Hageman, Toga and Narr2009). Studies including post-mortem investigations (Harrison & Weinberger, Reference Harrison and Weinberger2005), structural brain imaging research mainly pertaining to diffusion tensor images (DTI) (Lee et al. Reference Lee, Yoshida, Kubicki, Bouix, Westin, Kindlmann, Niznikiewicz, Cohen, McCarley and Shenton2009; Phillips et al. Reference Phillips, Nuechterlein, Clark, Hamilton, Asarnow, Hageman, Toga and Narr2009), and functional brain imaging have supported the presence of WM tract integrity abnormalities in subjects with schizophrenia (Kim et al. Reference Kim, Mathalon, Ford, Mannell, Turner, Brown, Belger, Gollub, Lauriello, Wible, O'Leary, Lim, Toga, Potkin, Birn and Calhoun2009). Structural brain deficits have been found in the frontal, temporal and parietal cortical regions, whereas functional imaging studies suggest impairment in fronto-temporal and fronto-parietal integration (Shenton et al. Reference Shenton, Dickey, Frumin and McCarley2001; Kyriakopoulos et al. Reference Kyriakopoulos, Vyas, Barker, Chitnis and Frangou2008).
The relationships between clinical manifestations, neurocognition and brain structure have been previously investigated and have been inconsistent. FA values have variously been reported to negatively correlate with positive, negative and general symptoms (Michael et al. Reference Michael, Calhoun, Pearlson, Baum and Caprihan2008). On the contrary, other studies found that increased FA values correlated with auditory hallucinations (Hubl et al. Reference Hubl, Koenig, Strik, Federspiel, Kreis, Boesch, Maier, Schroth, Lovblad and Dierks2004; Shergill et al. Reference Shergill, Kanaan, Chitnis, O'Daly, Jones, Frangou, Williams, Howard, Barker, Murray and McGuire2007). On the other hand, previous studies found that grey matter (GM) and WM deficits were related to cognitive abnormalities in schizophrenia (Ho et al. Reference Ho, Milev, O'Leary, Librant, Andreasen and Wassink2006). In addition, the correlations between neurocognition, clinical manifestations, and outcome of subjects with schizophrenia have been widely reported (Harvey et al. Reference Harvey, Green, Bowie and Loebel2006; Ventura et al. Reference Ventura, Hellemann, Thames, Koellner and Nuechterlein2009). However, the inter-relationship between clinical manifestations, neurocognition and WM microstructure has not yet been systematically explored in first-episode schizophrenia.
Hence, the purpose of this study was to explore the pattern of WM abnormalities, cognitive performance and clinical manifestations in subjects with schizophrenia. First, we examined the microstructural changes in first-episode subjects with schizophrenia; second, we investigated whether WM deficits correlated with the cognitive performance of subjects with schizophrenia; and finally, we determined whether cognitive performance was related to clinical symptoms. It was hypothesized that subjects with schizophrenia have anatomical dysconnectivity compared with normal controls, and that the latter may be localized to brain regions mediating information processing as well as symptoms in schizophrenia.
Method
Subjects and clinical assessments
A total of 122 subjects with schizophrenia were recruited for the research projects of first-episode schizophrenia from the Mental Health Center, West China Hospital of Sichuan University during 3 years. The patients were assessed by one of the trained psychiatrists (W.D. or M.L.) shortly after their first presenting to the mental health service. The psychiatric history of each patient was reviewed in order to exclude patients with a history of any other major psychiatric disorders including psychotic, affective and schizo-affective disorders, head trauma, current substance abuse, neurological disorders and mental retardation. A total of 122 healthy controls were recruited from the same geographical districts as the cases. Healthy controls were excluded if any of their first-degree relatives suffered from any mental illness. All subjects were interviewed using the Structured Clinical Interview for DSM Disorders; SCID-P for patients and SCID-NP for controls/non-patients. Diagnosis was made according to DSM-IV criteria. Those patients who were initially diagnosed as having schizophreniform disorder were followed up for at least 6 months in order to confirm the diagnosis of schizophrenia. Patients also underwent further clinical symptom assessment based on the Positive and Negative Syndrome Scale (PANSS; Kay et al. Reference Kay, Fiszbein and Opler1987). Of 122 patients, 106 were anti-psychotic-naive at the time of magnetic resonance imaging (MRI) scanning and clinical assessment, and the remaining 16 had taken anti-psychotics such as Risperidone or Olanzapine at a low dose (25–75 mg daily dose equivalents of chlorpromazine) for <3 days before MRI scanning. As subjects came from a consecutive cohort in a continuing research with different phases, intelligence quotient (IQ) scores were only available for patients entering the research in a later phase in which IQ tests were required.
A total of 40 healthy controls and 65 subjects with schizophrenia were assessed by the short version of the seven-subtest (information, arithmetic, digital symbol, digital span test, block design, picture completion, and similarities) Chinese Revised Version of the Wechsler Adult Intelligence Scale (WAIS-RC; Wechsler, Reference Wechsler1999). The weighted formulas for calculating the sum of squares of mean deviation (SS Sum) of the verbal IQ (VIQ) and performance IQ (PIQ) from scaled scores on the seven-subtest version are as follows (Schopp et al. Reference Schopp, Callahan, Johnstone and Schwake1998):
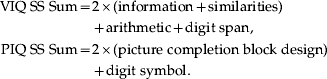 $$\eqalign{ {\rm VIQ}\;{\rm SS}\;{\rm Sum} \equals \tab 2 \times \lpar {\rm information} \plus {\rm similarities}\rpar \cr \tab\plus {\rm arithmetic} \plus {\rm digit}\;{\rm span}\comma \cr {\rm PIQ}\;{\rm SS}\;{\rm Sum} \equals \tab 2 \times \lpar {\rm picture}\;{\rm completion}\;{\rm block}\;{\rm design}\rpar \cr \tab\plus {\rm digit}\;{\rm symbol}. \cr} $$
The estimated sums of scaled scores derived from these formulae are then converted to IQ scores using the standard procedure and age-corrected conversion tables in the WAIS-RC manual (Wechsler, Reference Wechsler1999).
All subjects were right-handed as assessed by the Annett Handedness Scale (Annett, Reference Annett1970), were Han Chinese, and provided written informed consent. This study was approved by the Institutional Review Board of West China Hospital, Sichuan University.
MRI scans
All subjects underwent MRI scanning in the Department of Radiology at West China Hospital using a Signa 3.0-T scanner (GE Medical Systems, USA) with an eight-channel phased-array head coil. In the MRI unit, the usual practice to ensure MRI image quality assurance is based on an in-house protocol in which we use phantoms to measure signal:noise ratio and image uniformity on a daily basis, noting the voltage of the transmit radiofrequency amplifier (Firbank et al. Reference Firbank, Harrison, Williams and Coulthard2000). High-resolution DTI data were acquired by employing a single-shot spin echo-planar imaging sequence [repetition time (TR) = 10 000 ms, echo time (TE) = 70.8 ms, 3-mm axial slices with no gap, matrix = 256 × 256, field of view (FOV) = 24 cm2, acquisition time = 5 min 40 s]. The DTI sequence used in this protocol included 15 diffusion gradient directions [b = 1000 s/mm2; number of excitations (NEX) = 2] and one volume without diffusion weighting (b = 0; NEX = 2) for 42 slices throughout the whole brain. Anatomical three-dimensional spoiled gradient-echo (3D-SPGR) T1 data were also acquired for registration purposes (TR = 8.5 ms, TE = 3.4 ms, 1-mm axial slices, matrix = 512 × 512, FOV = 24 cm2, inversion time = 400 ms, NEX = 1). An experienced neuroradiologist reviewed all scans to exclude obvious gross abnormalities.
Image processing
Images were processed and analysed using SPM5 software (http://www.fil.ion.ucl.ac.uk/spm/software/spm5/). FA maps were generated from each participant's DTI scan using the freely available DTIstudio software (http://cmrm.med.jhmi.edu/). Prior to FA calculation, the DTI scans were realigned using the built-in function in DTIstudio so that each DTI image (b = 0 s/mm2) was corrected for motion. In all, three subjects with schizophrenia and two healthy controls were excluded from this study due to head and body motion (>3 mm). All 3D-SPGR images were corrected for inhomogeneity, normalized, and segmented using an integrated generative model (unified segmentation) with default parameters (Ashburner & Friston, Reference Ashburner and Friston2005). The DTI dataset was registered with the anatomical T1 by mutual-information co-registration between the b = 0 image and the T1 image. The normalization parameter of the T1 image was used to normalize the FA map to standard space. The normalized FA maps were resliced to 2 mm × 2 mm × 2 mm and smoothed with a 6-mm full-width at half-maximum isotropic Gaussian kernel. An explicit mask for statistical analysis was created by averaging the WM mask of all subjects.
Statistical analyses
Pearson's χ2 test, Student's t test and analysis of variance were used to compare the data distribution and differences of categorical and continuous data, respectively. Cluster-level analyses were performed using a full factorial model of two-sample t tests between patients and controls, and covariates included age and gender. Statistical inferences were made with a voxel-level threshold of p < 0.05; after family-wise error (FWE) correction for multiple comparisons, and an extent threshold of p < 0.05 (uncorrected), a minimum cluster size of 50 voxels was used (Jia et al. Reference Jia, Huang, Wu, Zhang, Lui, Zhang, Amatya, Kuang, Chan, Kemp, Mechelli and Gong2010). For successive analysis, the results in the group mapping analysis were saved to files and imported into the SPM MarsBar toolbox and the mean value of FA of each region was extracted and calculated for each subject.
To allow for investigation of the covariate of interest, multiple regression analyses were performed on subscales of PANSS and the results from the FA value of WM to factor out the effects attributable to the nuisance variables (age and gender). The results from these analyses were then saved as standard residual scores. Residuals of the variables in these regressions were then substituted for the raw values in successive bivariate analyses using SPSS for Windows, version 13.0 (SPSS Inc., USA). On the other hand, the direct regression/correlation analysis was used between FA values and PIQ and VIQ using voxel-based analysis on SPM5.
Results
Demographic characteristics and clinical information
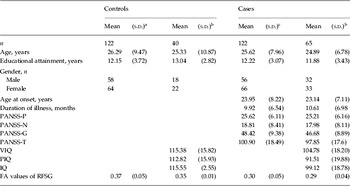
The demographic characteristics of the subjects are shown in Table 1. There were significant differences in mean age between the 122 controls and 122 subjects with schizophrenia (t 242 = 3.805, p < 0.029), but there were no significant differences in gender distribution (Pearson's χ2 = 0.395, p < 0.530) or mean educational attendance (t 242 = − 0.169, p < 0.866). There were no significant differences in mean age (t 102 = 0.003, p < 0.998), gender distribution (Pearson's χ2 = 0.425, p < 0.550) or mean educational attendance (t 102 = − 1.90, p < 0.06) between 40 controls and 65 subjects with schizophrenia who completed IQ testing. There were significant differences in PIQ and VIQ scores between the 40 controls and 65 subjects with schizophrenia (t 103 = 3.039, p < 0.003; t 103 = 5.739, p < 0.001, respectively). However, there were no significant differences in age, gender, years of education, age of onset and subscores of PANSS between those who did IQ tests and those who did not in patients and controls, respectively.
Demographic and clinical characteristics of healthy control subjects and subjects with schizophrenia

s.d., Standard deviation; PANSS, Positive and Negative Syndrome Scale; PANSS-P, PANSS subscales for positive symptoms; PANSS-N, PANSS subscales for negative symptoms; PANSS-G, PANSS subscales for general psychopathological symptoms; PANSS-T, total PANSS score; VIQ, verbal intelligence quotient; PIQ, performance intelligence quotient; IQ, intelligence quotient; FA, fractional anisotropy; RFSG, right cerebral frontal lobar sub-gyral.
a All control subjects.
b Subset of subjects who completed IQ testing.
c All cases.
Comparison of FA values of DTI between patients and controls
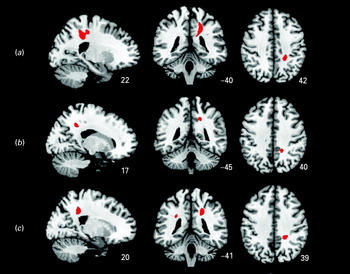
As shown in Fig. 1a, compared with the 122 controls, FA values of the right frontal WM were lower in the 122 subjects with schizophrenia (p < 0.05, FWE correction). The right cluster [Montreal Neurological Institute (MNI) coordinates of the centroid: x = 22, y = −40, z = 42] appeared to extend into the parietal and frontal lobe WM including the precuneus/posterior cingulate gyrus. The voxel- and cluster-level maps were very similar in the regions showing lower FA in patients. In the voxel-level map, the FA values of the right cerebral frontal lobar sub-gyral (RFSG) (MNI: x = 22, y = −40, z = 42 and x = 18, y = −28, z = 49) were found to be significantly different. Neither the cluster- nor the voxel-level map showed any regions with increased FA in patients compared with controls. The significant differences were based on stringent FWE correction.
Axial slices showing regions of interest in diffusion tensor imaging study. (a) Comparison of white matter (WM) deficits of whole brain between 65 cases and 40 controls. (b) Correlation analysis between verbal intelligence quotient and WM deficits of whole brain in 65 patients. (c) Correlation analysis between performance intelligence quotient and WM deficits of whole brain in 65 patients.

Correlational analysis among the FA value, clinical symptoms, PIQ and VIQ
Anatomical connectivity and cognitive measures
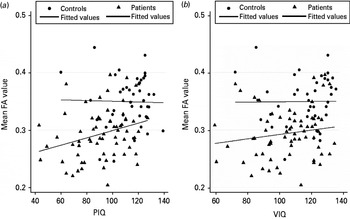
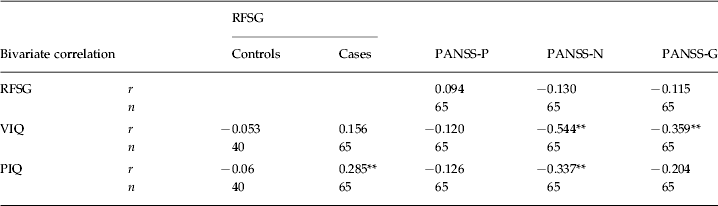
In the 65 subjects with schizophrenia who had IQ assessment, the residual score of the mean FA value in the RFSG showed a significant positive correlation with PIQ but not with VIQ. We also analysed the relationship between PIQ or VIQ and the residual score of the mean FA value in the RFSG in 40 controls and found no significant correlation (Fig. 2, Table 2).
Correlations between fractional anisotropy (FA) values and performance intelligence quotient (PIQ) (a) and verbal intelligence quotient (VIQ) (b). Scatterplots show the correlation of the mean FA values over the cluster located at the right cerebral frontal lobar sub-gyral with PIQ and VIQ within subgroups of the normal control (n = 40) and patient (n = 65) groups.

Correlation analysis between fractional anisotropy values in the RFSG, clinical manifestations, VIQ and PIQ scores
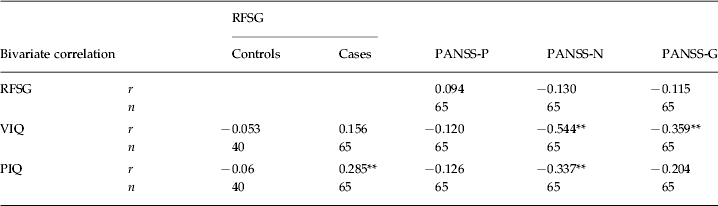
RFSG, Right cerebral frontal lobar sub-gyral; VIQ, verbal intelligence quotient; PIQ, performance intelligence quotient; PANSS, Positive and Negative Syndrome Scale; PANSS-P, PANSS subscales for positive symptoms; PANSS-N, PANSS subscales for negative symptoms; PANSS-G, PANSS subscales for general psychopathological symptoms; r, Pearson's correlation coefficient.
Significant correlations (Bonferroni-corrected): ** p < 0.01.
Furthermore, voxel-based analyses were conducted on data from PIQ and VIQ in the 40 normal controls and 65 subjects with schizophrenia, respectively, taking age and gender as so-called nuisance variables. In the 40 controls, no significant correlation was found between PIQ or VIQ and FA value. In the 65 patients, positive correlations between WM abnormalities and VIQ were found in the right cerebral parietal lobe at the precuneus (RCPP) (MNI: x = 17, y = −45, z = 40) (voxel-level, p < 0.001, uncorrected) (Fig. 1b); positive correlations between WM abnormalities and PIQ were also found in the right cerebral limbic lobe at the precuneus (MNI: x = 20, y = −41, z = 39) and left cerebral temporal lobe sub-gyral (MNI: x = −29, y = −41, z = 30) (voxel-level, p < 0.001, uncorrected) (Fig. 1 c). There was no negative correlation shown in any voxel.
Anatomical connectivity and clinical syndromes
In the 122 subjects with schizophrenia, no significant differences were found between the residual score of the mean FA value in the RFSG and positive syndromes (PANSS_P), negative syndromes (PANSS_N) and general psychopathology syndromes (PANSS_G). In addition, we performed the same analysis in 65 subjects with schizophrenia who had IQ assessment; the residual score of the mean FA value in the RFSG also did not show significant correlation with PANSS_P or PANSS_G.
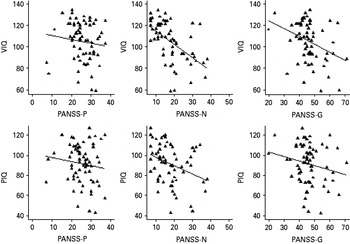
Clinical manifestations and cognitive measures
In the 65 subjects with schizophrenia, VIQ showed a significant negative correlation with PANSS_N and PANSS_G, respectively, but not with PANSS_P; PIQ showed a significant negative correlation with PANSS_N, but not with PANSS_G or PANSS_P (Fig. 3, Table 2).
Correlations between verbal intelligence quotient (VIQ) and performance intelligence quotient (PIQ) and Positive and Negative Syndrome Scale (PANSS) scores in a subgroup of the patient group (n = 65). PANSS-P, PANSS subscales for positive symptoms; PANSS-N, PANSS subscales for negative symptoms; PANSS-G, PANSS subscales for general psychopathological symptoms.

On the other hand, partial correlation analysis was used on raw scores of mean FA values in the RFSG and subscales of PANSS (not using standard residual scores) in 122 (all patients) and 65 subjects with schizophrenia (patients who completed IQ measurements), respectively, and age and gender were included as nuisance variables. No significant correlations were found between the mean FA value in the RFSG and PANSS scores. In addition, when course of illness was also included as a nuisance factor, no significant correlation between mean FA value in the RFSG and PANSS score was found. Moreover, voxel-based regression/correlation analyses between FA and subscores of PANSS were conducted on data from 122 subjects with schizophrenia, respectively, taking age and gender as so-called nuisance variables. There were no significant correlations to be found.
Discussion
Our study supported earlier findings that first-episode subjects with schizophrenia showed cognitive impairments and WM microstructural deficits in the frontal and parietal lobes extending to the precuneus/posterior cingulate gyrus (Cheung et al. Reference Cheung, Cheung, McAlonan, Deng, Wong, Yip, Tai, Khong, Sham and Chua2008; Greicius et al. Reference Greicius, Supekar, Menon and Dougherty2009; Camchong et al. Reference Camchong, Macdonald, Bell, Mueller and Lim2011). We also found that WM deficits in schizophrenia correlated with PIQ scores, whereas for the controls there was no such relationship (Nestor et al. Reference Nestor, Kubicki, Nakamura, Niznikiewicz, McCarley and Shenton2010), encompassing some but not all WM tracts reported in the literature. In addition, we found that the lower PIQ or VIQ scores of first-episode subjects with schizophrenia related to more severe negative syndromes. However, the WM deficits were not themselves directly correlated with the severity of symptoms.
Several interesting conclusions can be drawn from this study. First, the findings showed that WM tracts and cognitive impairments exist in subjects with schizophrenia at the very early stage of illness, which implies that such deficits may represent proxy measures for the primary manifestation of schizophrenia. Integrative impairments in WM fibre tracts have been associated with schizophrenia, supported by growing but inconsistent evidence (Kubicki et al. Reference Kubicki, McCarley, Westin, Park, Maier, Kikinis, Jolesz and Shenton2007). A lower FA value has broadly been accepted; however, definite regions have not been confirmed. Widespread abnormalities in fronto-parieto-occipital connectivity are promising candidates for the pathophysiological mechanism of schizophrenia (Greicius et al. Reference Greicius, Supekar, Menon and Dougherty2009; Camchong et al. Reference Camchong, Macdonald, Bell, Mueller and Lim2011) and the extension to the precuenus/posterior cingulate gyrus implicates a critical region that is core to the default-mode network since it is believed to subserve internal mentation as well as episodic memory (Cavanna & Trimble, Reference Cavanna and Trimble2006).
Second, our findings supported the hypothesis that WM integration was correlated with cognitive deficits of schizophrenia. Although schizophrenia has been widely known as a neurodevelopmental disease, there is no evidence for astrogliosis at post-mortem (Falkai et al. Reference Falkai, Honer, David, Bogerts, Majtenyi and Bayer1999). Alternative interpretations of reduced FA values are also possible. Some studies have shown that structural WM abnormalities in schizophrenia were associated with cognitive dysfunctions such as social cognition (Fujiwara et al. Reference Fujiwara, Namiki, Hirao, Miyata, Shimizu, Fukuyama, Sawamoto, Hayashi and Murai2007), attention and working memory (Prasad & Keshavan, Reference Prasad and Keshavan2008) and orienting attention (Nestor et al. Reference Nestor, Kubicki, Spencer, Niznikiewicz, McCarley and Shenton2007).
Third, WM deficits are not always directly correlated with the clinical manifestations of schizophrenia. Some studies reported that microstructural abnormalities were correlated with clinical performance of schizophrenia. Shin et al. (Reference Shin, Kwon, Ha, Park, Kim, Hong, Moon, Lee, Kim, Kim and Chung2006) found that the increased apparent diffusion coefficient value in the right insular was correlated with more severe negative symptoms from PANSS. Micheal et al. (Reference Michael, Calhoun, Pearlson, Baum and Caprihan2008) found that the FA values of five segments of the corpus callosum were negatively correlated with three PANSS subscales. Skelly et al. (Reference Skelly, Calhoun, Meda, Kim, Mathalon and Pearlson2008) found that negative symptoms were negatively correlated with a small area near the right insula; however, the tracts used were different from those of Shin et al. (Reference Shin, Kwon, Ha, Park, Kim, Hong, Moon, Lee, Kim, Kim and Chung2006) . By contrast, other studies found that positive symptoms were positively correlated with FA in the left uncinate fasciculus, right striatum and left superior longitudinal fasciculus (Rotarska-Jagiela et al. Reference Rotarska-Jagiela, Oertel-Knoechel, DeMartino, van de Ven, Formisano, Roebroeck, Rami, Schoenmeyer, Haenschel, Hendler, Maurer, Vogeley and Linden2009). However, two studies did not find any correlation between WM tract abnormalities and clinical performance (Foong et al. Reference Foong, Maier, Clark, Barker, Miller and Ron2000; Minami et al. Reference Minami, Nobuhara, Okugawa, Takase, Yoshida, Sawada, Ha-Kawa, Ikeda and Kinoshita2003). The apparent discrepancy between studies showing positive or negative correlation between FA and positive symptoms appears counterintuitive, but one reason for this is that FA is related to the duration of anti-psychotic treatment. Thus, the relationship between FA and positive symptoms in the early phase of illness may be positive in direction, but the relationship may reverse in direction for chronic patients (Cheung et al. Reference Cheung, Chiu, Law, Cheung, Hui, Chan, Sham, Deng, Tai, Khong, McAlonan, Chua and Chen2010). In any case, various other reasons may account for this divergence in findings: for instance, previous studies had relatively small patient sample sizes; furthermore, heterogeneities in clinical performances increased the likelihood of spurious findings and sampling bias, especially in smaller samples; in addition, confounding factors, including illness chronicity, medication, age, race, and so on, may affect WM tract integrity.
Fourth, cognitive deficits suggested by IQ, especially PIQ, showed close correlations with clinical manifestations and WM changes. We explained this finding on the basis of the meaning of ‘extended endophenotypes’ in that, on the pathway from gene to clinical manifestations, the microstructural abnormalities are closer to the gene end, and cognitive deficits are closer to clinical performance. However, cognitive dysfunction, as an endophenotype of the disease, may be closer to the structural abnormalities end compared with clinical measurements. Furthermore, microstructural abnormalities might be more heavily weighted in cognitive dysfunction than in clinical manifestations. Both situations could lead to the possibility that the correlation of WM abnormalities with cognitive dysfunction may be more easily identified than clinical manifestations. On the other hand, cognitive dysfunction may lie midway between WM deficits and clinical manifestations, which could lead to cognitive deficits being correlated with both WM abnormalities and clinical manifestations. A previous study by Gray et al. (Reference Gray, Chabris and Braver2003) suggested that functional changes of lateral prefrontal and parietal regions could mediate the relationship between PIQ and so-called ‘fluid intelligence’, whereby the latter classically refers to the set of abilities involved in coping with novel environments and especially in abstract reasoning. Since PIQ tends to be regarded as tapping into the reasoning and problem-solving abilities of individuals, it is unsurprising that it could serve as a proxy for higher-level mentation. Indeed, previous studies suggested that GM volume is also significantly associated with higher-level abstract cognitive skills sets (Gong et al. Reference Gong, Sluming, Mayes, Keller, Barrick, Cezayirli and Roberts2005; Bishop et al. Reference Bishop, Fossella, Croucher and Duncan2008) and this can be greatly disrupted by frontal lobe disease. Taking the above into account, our study suggests that the WM deficits in the fronto-parietal lobes extending to the precuneus/polsterior cingulate gyrus were correlated with PIQ which is compatible with previous functional and structural GM studies (Gong et al. Reference Gong, Sluming, Mayes, Keller, Barrick, Cezayirli and Roberts2005; Bishop et al. Reference Bishop, Fossella, Croucher and Duncan2008).
There are several unique advantages in the present study. Patients with first-episode schizophrenia were recruited. At the time they entered the study, all patients were either antipsychotic-naive or on low-dose antipsychotics. Therefore, the potential confounding effects, as described above, were relatively well controlled. Furthermore, we used voxel-based analysis to compare WM deficits of the 122 patients and 122 controls, which may have helped us to avoid selective bias caused by using a region of interest (ROI) technique. Finally, this study had relatively large sample sizes, which have enough power to bring out significant differences under stringent FWE correction.
Limitations of the study
There are also some limitations in this study. First, IQ measurements were missing from some of the subjects, which could have affected the results of correlations between mean FA values and clinical symptoms. Fortunately, there were no significant differences in clinical profiles between patients with schizophrenia who did IQ tests and those who did not. Second, the current findings from the present cross-sectional study should be tested in a longitudinal design. Third, in the present study, we used an ROI strategy in correlation analysis, and only explored the WM region of reduced mean FA value under stringent FWE correction. The reason for the dimensions of symptoms not correlating with the measurements of WM in this study may be due to the fact that clinical performances may be involved in regions such as the temporal lobe or corpus callosum (Liu et al. Reference Liu, Liang, Zhou, He, Hao, Song, Yu, Liu, Liu and Jiang2008), rather than the WM of the parietal-frontal lobe. Nevertheless, the regression/correlation analysis using voxel-based analysis in 40 controls and 65 patients identified very similar WM deficits as the above ROI analysis, suggesting that though the analysis strategy of this study was reasonable, it was not perfect.
Conclusions
We demonstrated that WM deficits in individuals with schizophrenia appear to be related to the cognitive deficits of schizophrenia. In addition, cognitive deficits also have a close relationship with clinical manifestations, especially with the negative syndromes. Further studies in an independent cohort are required in order to verify whether the presence of structural brain changes associated with cognitive deficits could serve as extended endophenotypes of schizophrenia and could be used in future genetic studies.
Acknowledgements
The authors thank the subjects who participated in this study. This work was supported by the National Nature Science Foundation of China (no. 30530300 and 30125014 to T.L.; no. 30971056 to W.Q.), the National Basic Research Program of China (973 Program, grant no. 2007CB512301 to T.L.), the National High Technology Research and Development Program of China (863 Program, grant no. 2009AA022702 to T.L.), an NARSAD Independent Investigator Award (to T.L.), the Wellcome Trust (International Collaborative Award to T.L. and D.A.C.) and the China Postdoctoral Science Foundation (grant nos. 20090461337 and 201003699 to T.L.).
Declaration of Interest
None.