INTRODUCTION
Vegetation response to climate change is highly sensitive in arid regions (Zhao et al., Reference Zhao, Yu, Chen, Zhang and Yang2009; Li et al., Reference Li, Xu, Zheng, Lu, Luo, Li, Li and Seppa2015a), and changes in paleovegetation are used for paleoclimate and paleoenvironmental reconstructions (Zhang et al., Reference Zhang, Ma, Wünnemann and Pachur2000; Zhao et al., Reference Zhao, Yu, Chen, Ito and Zhao2007, Reference Zhao, Yu, Chen and Li2008). The use of changes in paleovegetation to reconstruct paleoclimate changes has been a focus of recent studies (Zhao and Yu, Reference Zhao and Yu2012; Mischke et al., Reference Mischke, Lai, Long and Tian2015). In previous studies, fossil pollen has become one of the most widely used and available paleovegetation proxies (Wright, Reference Wright1967; Prentice, Reference Prentice1985; Sugita, Reference Sugita1994; Herzschuh et al., Reference Herzschuh, Tarasov, Wünnemann and Hartmann2004) and has frequently been used in vegetation and climate reconstructions as it tends to reflect changes at a regional scale (Zhao et al., Reference Zhao, An, Mao, Zhao, Tang, Zhou, Li, Dong, Duan and Chen2015; Li et al., Reference Li, Ilvonen, Xu, Ni, Jin, Holmstrom and Zheng2016a; Zhang et al., Reference Zhang, Wang, Sun and Shen2016). These studies provide paleovegetation results relating to the changes in Quaternary climates and landscapes in arid regions. However, in deserts the preservation of pollen is poorer than that in other regions (Zheng et al., Reference Zheng, Wei, Huang, Xu, Lu, Tarasov and Luo2014), making it difficult to reconstruct changes in paleovegetation using fossil pollen. Therefore, there remains a need for an efficient method that can be used to reconstruct changes in the paleovegetation of desert hinterlands.
The Alashan Desert, which comprises the Badain Jaran Desert, the Tengger Desert, the Ulan Buh Desert, and other deserts, is situated in an arid region of northwestern China. It is located in the climatic transition zone of the Asian summer monsoon and westerly belt (Wang et al., Reference Wang, Clemens, Beaufort, Braconnot, Ganssen, Jian, Kershaw and Sarnthein2005; Yang et al., Reference Yang, Scuderi, Paillou, Liu, Li and Ren2011). Therefore, it is an ideal region for studying changes in climate and vegetation at different time scales (Zhang et al., Reference Zhang, Ma, Wünnemann and Pachur2000; Mischke et al., Reference Mischke, Demske and Schudack2003; Wang et al., Reference Wang, Li, Cheng, Li and Huang2011; Li et al., Reference Li, Wang, Li, Ning, Cheng and Zhao2015c). Holocene paleovegetation and paleoclimate changes have been reported from studies of lake sediments in this area (Chen et al., Reference Chen, Yu, Yang, Ito, Wang, Madsen and Huang2008), and high-resolution reconstruction results of Holocene climatic fluctuations are primarily based on the study of lacustrine sediments in the terminal lakes of dryland rivers (Hartmann and Wünnemann, Reference Hartmann and Wünnemann2009; Long et al., Reference Long, Lai, Wang and Li2010; Mischke et al., Reference Mischke, Lai, Long and Tian2015; Li et al., Reference Li, Wang, Cheng and Li2016d). However, the changes recognized in lacustrine records along the desert margins may not, as previously assumed, be directly linked to local or regional climate events (Yang and Scuderi, Reference Yang and Scuderi2010). Changes in lake systems can be caused by variation in surface runoff directly linked to the melting of mountain glaciers rather than to local climatic variation. Moreover, dryland rivers change course frequently, resulting in hydrologic variation in terminal lakes and, consequently, moisture availability in the lake basins (Jin et al., Reference Jin, Li, Li, Duan, Wen, Wei, Yang, Fan and Chen2015). Furthermore, most of the terminal lakes of dryland rivers are located at the margin of deserts, and therefore, pollen records from the lake sediments may not reflect paleovegetation in the desert hinterland. Thus, the reliability and representativeness of Holocene vegetation changes that have been reconstructed using lake sediments for this area are still uncertain.
Calcareous root tubes (CRTs), which are also called rhizoliths or calcified roots, are plant products that are formed by encrustation of plant roots by secondary carbonates (Klappa, Reference Klappa1980; Gocke et al., Reference Gocke, Pustovoytov, Kühn, Wiesenberg, Löscher and Kuzyakov2011a; Zamanian et al., Reference Zamanian, Pustovoytov and Kuzyakov2016). They almost invariably occur in calcareous soils and the underlying soil parent material in regions with a pronounced seasonal moisture deficit (Alonso-Zarza, Reference Alonso-Zarza2003; Gocke et al., Reference Gocke, Gulyás, Hambach, Jovanović, Kovács, Marković and Wiesenberg2014a). Moreover, they form faster than other forms of secondary carbonate that are more distant from roots (Gocke et al., Reference Gocke, Pustovoytov and Kuzyakov2011b), indicating a high potential for CRTs to be used in reconstructing paleovegetation (Wang and Greenberg, Reference Wang and Greenberg2007; Gocke et al., Reference Gocke, Hambach, Eckmeier, Schwark, Zöller, Fuchs, Löscher and Wiesenberg2014b; Zamanian et al., Reference Zamanian, Pustovoytov and Kuzyakov2016). In previous investigations, CRTs were found to be distributed across the Alashan Desert, most of which were dated to the Holocene (Yang, Reference Yang2000; Li et al., Reference Li, Wang, Cheng, Ning, Zhao and Li2015b, Reference Li, Wang, Li, Ning, Cheng and Zhao2015c). However, it is still unclear whether proxies from CRT records can be used effectively to reconstruct the paleovegetation in this area.
Lipid biomarkers, particularly n-alkanes, have frequently been used in paleoenvironmental studies for source apportionment of organic matter (OM) in terrestrial archives and for deducing climatic evolution and vegetation conditions during geologic history (Schwark et al., Reference Schwark, Zink and Lechterbeck2002; Pancost and Boot, Reference Pancost and Boot2004). These authors demonstrate that n-alkanes are reliable alternative indicators in paleoenvironment research, as the paleoenvironmental reconstruction results of n-alkanes can be matched with those of pollen spectra or magnetic susceptibility in the loess stratigraphy (Schwark et al., Reference Schwark, Zink and Lechterbeck2002; Pancost and Boot, Reference Pancost and Boot2004). However, it has rarely been reported whether CRTs, particularly in deserts, can be used as carriers of n-alkanes for paleovegetation reconstruction. Because CRTs are encrustations of plant roots formed by secondary carbonates, and such encrustation leads to protection against degradation of the organic remains of former root tissue, the n-alkanes within CRTs can provide evidence of the type of former vegetation.
In this study, we took 34 Holocene CRT samples collected from the hinterland of the Alashan Desert and used lipid molecular proxies from CRT records to reconstruct changes in vegetation and climate on a millennial time scale during the Holocene. The n-alkane data are presented as a corroboration or enhancement of the pollen record, in order to reevaluate the reliability and representativeness of Holocene vegetation changes that have been reconstructed from the lake sediments of this area.
STUDY AREA
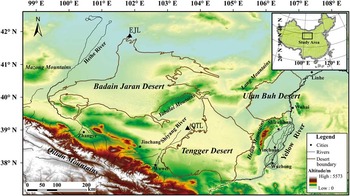
The Alashan Desert is located between the Chinese border and the Hexi Corridor, with an average elevation of 1250 m (Fig. 1). Vegetation cover in the Alashan Desert is between 15% and 30% (Li et al., Reference Li, Tan, He, Wang and Li2009a). The Alashan Desert includes three named areas, each with modestly distinctive characteristics.
(color online) Location of the study area. EJL, Eastern Juyan Lake; QTL, Qingtu Lake.

The Badain Jaran Desert lies in the western portion of the Alashan Desert, with an area of 52,000 km2 (Zhu et al., Reference Zhu, Wang, Chen, Dong and Zhang2010). The average annual precipitation is approximately 40–120 mm and gradually decreases from the southeast to northwest, whereas the average annual evaporation rate is more than 1000 mm/yr (Yang et al., Reference Yang, Ma, Dong, Zhu, Xu, Ma and Liu2010; Li et al., Reference Li, Pan, He and Zhang2016c). The vegetation is dominated by shrubs and subshrubs, including Haloxylon, Nitraria, Tamarix, and Reaumuria species (Wang et al., Reference Wang, Dong, Lu, Li, Luo, Cui, Zhang, Liu, Jiao and Yang2015).
The Tengger Desert lies in the southeastern portion of the Alashan Desert, with an area of 42,700 km2. The regional average annual precipitation is 125–160 mm, whereas the average annual potential evaporation is approximately 2600 mm (Li et al., Reference Li, Wang, Li, Ning, Cheng and Zhao2015c). The vegetation is composed of shrubs and subshrubs, such as halophytes, Tamarix, and Artemisia. The vegetation cover is 15%–20% (Gao et al., Reference Gao, Zhang, Liu and Jia2009).
The Ulan Buh Desert, with an area of 11,000 km2, lies in the eastern portion of the Alashan Desert. The regional average annual precipitation is 107.8 mm, whereas the average annual potential evaporation is approximately 2956.9 mm (Fan et al., Reference Fan, Chen, Fan, Zhao and Yang2010). The vegetation is dominated by shrubs and subshrubs such as Artemisia ordosica and Ammopiptanthus and Nitraria species (He, Reference He2006).
MATERIALS AND METHODS
Samples collected
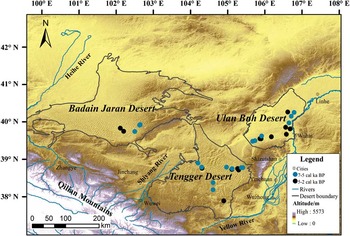
CRTs are distributed widely across the Alashan Desert. CRTs from 34 locations in the Alashan Desert have been presented by Li et al. (Reference Li, Wang, Cheng, Ning, Zhao and Li2015b, Reference Li, Wang, Li, Ning, Cheng and Zhao2015c) (Fig. 2). These 34 samples of CRTs were sampled for n-alkane analyses and for 14C dating.
Locations of the calcareous root tubes (CRTs) sampled from the Alashan Desert. The blue circles indicate CRTs that were dated to 7−5 cal ka BP, whereas the black circles indicate those that were dated to 5−2 cal ka BP. The dating results are from Li et al. (Reference Li, Wang, Cheng, Ning, Zhao and Li2015b, Reference Li, Wang, Li, Ning, Cheng and Zhao2015c). (For interpretation of the references to color in this figure legend, the reader is referred to the web version of this article.)

The results of 14C dating of secondary carbonate, however, can be affected by various factors. It is still difficult to improve the reliability of the dating results at the centennial scale because of the presence of other confounding factors such as the incorporation of older and younger C (Li et al., Reference Li, Wang, Li, Ning, Cheng and Zhao2015c). Li et al. (Reference Li, Wang, Cheng, Ning, Zhao and Li2015b) found that CRTs in the deserts of the Alashan Plateau could be used as 14C dating targets and that the 14C dates for CRTs were reliable within the millennial scale for Holocene ages. This is consistent with the results previously reported by Kuzyakov et al. (Reference Kuzyakov, Shevtzova and Pustovoytov2006), Pustovoytov et al. (Reference Pustovoytov, Schmidt and Parzinger2007), and Gocke et al. (Reference Gocke, Pustovoytov and Kuzyakov2011b). Therefore, the numbers of 14C ages in each millennium can be counted, as the possible recrystallization in CRTs would not affect the reliability of 14C dating results at a millennial scale for Holocene ages.
The 14C dating results of the 34 Holocene CRT samples (Li et al., Reference Li, Wang, Li, Ning, Cheng and Zhao2015c) demonstrated that four samples from the Badain Jaran Desert were dated to 7–5 cal ka BP, and two samples were dated to 5–2 cal ka BP; nine samples from the Tengger Desert were dated to 7–5 cal ka BP, and six samples were dated to 5–2 cal ka BP; and six samples from the Ulan Buh Desert were dated to 7–5 cal ka BP, and seven samples were dated to 5–2 cal ka BP.
Lipid extraction and instrumental analysis
The dried CRTs were ground and passed through an 80 μm mesh. Two grams of the samples was ultrasonically extracted using a solvent mixture of dichloromethane/methanol (93:7 v/v). Each sample was extracted three times with fresh solvent for 20 min, and left to stand for >2 h each time. Finally, the extracts were combined and concentrated in a rotary evaporator under reduced pressure and transferred to a small vial. For evaporation of the remaining solvent, a nitrogen stream was used, and the dried total extractable lipids were weighed and redissolved in n-hexane. The saturated hydrocarbon extracts were separated by silica gel column chromatography (60 mesh) and sequential elution with n-hexane. The saturated hydrocarbons were directly analyzed using gas chromatography–mass spectrometry (GC-MS).
The analysis was carried out using a 450-GC gas chromatograph equipped with an HP-5MS fused silica capillary column (30 m×0.32 mm×0.25 μm). The operating conditions used temperature ramping from 80°C to 290°C at 10°C/min and held at 290°C for 30 min, with helium as the carrier gas. The compounds were identified by comparison of their retention times and mass spectra with those of reference compounds. Quantitation was based on GC-MS response and achieved by comparison of peak areas with those of known quantities of standards added to the samples after extraction.
Calculations
The L/H ratio (Eq. 1) has been used to indicate the input of microorganisms relative to land plants (Li et al., Reference Li, Yang, Wang, Hu, Cui, Huang and Jiang2016b):
 $$\eqalignno{ & {\rm L}/{\rm H} \, {\equals}\,{{{\rm C}_{{15}} {\plus}{\rm C}_{{16}} {\plus}{\rm C}_{{17}} {\plus}{\rm C}_{{18}} {\plus}{\rm C}_{{19}} {\plus}{\rm C}_{{20}} {\plus}{\rm C}_{{21}} } \over {{\rm C}_{{22}} {\plus}{\rm C}_{{23}} {\plus}{\rm C}_{{24}} {\plus}{\rm C}_{{25}} {\plus}{\rm C}_{{26}} {\plus}{\rm C}_{{27}} {\plus}{\rm C}_{{28}} {\plus}{\rm C}_{{29}} {\plus}{\rm C}_{{30}} {\plus}{\rm C}_{{31}} {\plus}{\rm C}_{{32}} {\plus}{\rm C}_{{33}} }},\cr $$
where C x is the concentration of the n-alkane (C) with x carbons.
The carbon preference index (CPI) is a parameter that reflects the relative abundance of odd and even homologues in OM. The CPI is calculated as follows:
 $${\rm CPI}\,{\equals}\,\left[ \matrix{ \left( {\mathop{\sum}{n\, {\minus}\, {\rm C}_{{25\, {\minus}\, 33{\rm odd}}} \,/\,\mathop{\sum}{n\, {\minus}\, C_{{24\, {\minus}\, 32{\rm even}}} } } } \right)\!{\plus} \hfill \cr \left( {\mathop{\sum}{n\, {\minus}\, {\rm C}_{{25\, {\minus}\, 33{\rm odd}}} \,/\,\mathop{\sum}{n\, {\minus}\, C_{{26\, {\minus}\, 34{\rm even}}} } } } \right) \hfill \cr} \right]\,/\,2.$$
RESULTS
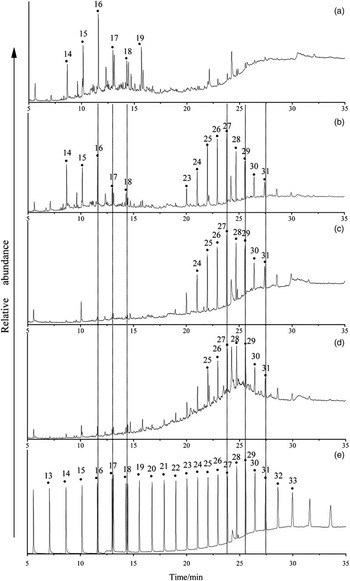
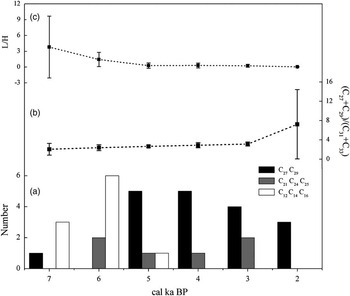
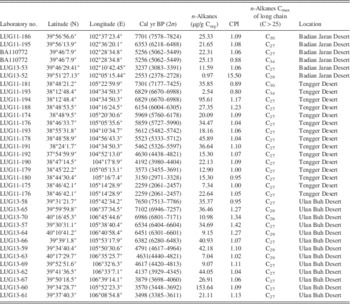
The GC-MS results show that n-alkanes in the extracts of CRTs range from C12 to C33 (Fig. 3). There are 19 samples that occurred from 7 to 5 cal ka BP, with 2 of these maximizing at C12, 1 at C14, 8 at C16, 1 at C21, 1 at C25, and 6 at C27 (Fig. 4a). Fifteen other samples occurred between 5 and 2 cal ka BP, with 3 of these maximized at C21, C24, and C25, respectively, 10 at C27, and 2 at C29 (Fig. 4a). Furthermore, when focusing on the long-chain n-alkanes (C>25), the distribution patterns that showed higher plants as the main source of OM are dominated by C27 (25 samples) or C29 (five samples); however, we found no samples maximizing at C31 or C33 (Table 1). Four of the samples maximizing at C26, C30, or C34 indicated a strong degradation effect owing to their Cmax at C16.
Gas chromatograms of n-alkanes in four typical calcareous root tube samples and the n-alkane standard mixture. (a) n-Alkane Cmax at C16; sample collected from the Ulan Buh Desert and dated at 6534 cal yr BP. (b) n-Alkane Cmax at C27 and C16; sample collected from the Ulan Buh Desert and dated at 3570 cal yr BP. (c) n-Alkane Cmax at C27; sample collected from the Tengger Desert and dated at 5462 cal yr BP. (d) n-Alkane Cmax at C29, sample collected from the Ulan Buh Desert and dated at 4791 cal yr BP. (e) Reference material. Numbers above peaks are carbon numbers.

Lipid molecular proxies from calcareous root tubes (CRTs) for each millennium in the Alashan Desert. (a) n-Alkane Cmax in CRTs. (b) Changes in (C27 + C29)/(C31 + C33) ratios. The horizontal line represents the standard deviation. (c) Changes in the L/H ratio. The horizontal line represents the standard deviation.

Lipid molecular proxies from calcareous root tubes in the Alashan Desert (14C results are from Li et al. [Reference Li, Wang, Li, Ning, Cheng and Zhao2015c]). CPI, carbon preference index.

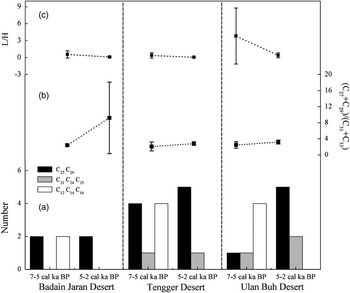
Most CRT samples contained higher amounts of C27 and C29 than C31 and C33, and consequently, the ratios of (C27 + C29)/(C31+C33) were higher and the averages for each millennium were greater than 2 (Fig. 4b). The average of (C27+ C29)/(C31+C33) rose gradually from 7 to 2 cal ka BP and reached 7.2 at 2 cal ka BP (Fig. 4b). In terms of the three different deserts (Fig. 5b), the averages of the (C27+C29)/(C31+C33) ratios were 2.43, 2.37, and 2.48 during the period 7–5 cal ka BP for the Badain Jaran Desert, Tengger Desert, and Ulan Buh Desert, respectively. In comparison, the values for these three deserts were 9.23, 2.83, and 3.21 during the period 5–2 cal ka BP (Fig. 5b).
Lipid molecular proxies from calcareous root tubes (CRTs) for each millennium in the Badain Jaran Desert, the Tengger Desert, and the Ulan Buh Desert, respectively. (a) n-Alkane Cmax in CRTs. (b) Changes in the (C27 + C29)/(C31 + C33) ratio. The horizontal line represents the standard deviation. (c) Changes in the L/H ratio. The horizontal line represents the standard deviation.

The average values of L/H decreased from 7 to 2 cal ka BP, and the ratios were higher during the period 7–5 cal ka BP than that during the period 5–2 cal ka BP (Fig. 4c). In terms of the three different deserts (Fig. 5c), the average of L/H ratios were 0.56, 0.38, and 3.8 during the period 7–5 cal ka BP for the Badain Jaran Desert, Tengger Desert, and Ulan Buh Desert, respectively. In comparison, the values for these three deserts were 0.11, 0.07, and 0.41 during the period 5–2 cal ka BP (Fig. 5c).
The CPI values of the CRTs mostly ranged from 0.80 to 1.42, although one sample reached 15.5 (Table 1), which could be attributable to the influence of contemporary OM. Thus, the values varied slightly but generally remained at a low level (i.e., close to 1).
DISCUSSION
Interpretations of the n-alkane proxies
In this study, we use the n-alkane Cmax to represent the most abundant homologues in the CRTs. In terrestrial plant waxes, alkane homologues with 25–33 carbon atoms are abundant and show single maxima at C27, C29, C31, or C33. In most trees and shrubs, the n-alkanes C27 or C29 dominate, whereas the n-alkanes C31 or C33 dominate in most herbs (Zech et al., Reference Zech, Rass, Buggle, Löscher and Zöller2012). In contrast to these compounds, microbial biomass or degradation products always generate short-chain homologues (C15–C21) and show single maxima at C15, C17, or C19 (Wakeham, Reference Wakeham1990; Ficken et al., Reference Ficken, Li, Swain and Eglinton2000). However, Bush and Mcinerney (Reference Bush and Mcinerney2013) suggested that the relationships between n-alkane Cmax and vegetation types were not always straightforward at the global scale. In the arid and semiarid regions of northern China, previous studies have suggested that certain n-alkane chain lengths predominate in, and therefore can be representative of, particular plant groups (Liu and Huang, Reference Liu and Huang2005; Zhong et al., Reference Zhong, Xue and Chen2009; Liu and Liu, Reference Liu and Liu2015). In the Loess Plateau, beside the Alashan Desert, modern herbaceous and woody plants, including Caragana, Artemisia scoparia, Haloxylon ammodendron, and Salsola collina are dominant species, which also could be found in the Alashan Desert. The n-alkane distributions demonstrate that all of the woody vegetation (shrubs) maximizes at C27 and most of the herbaceous vegetation maximizes at C31 or C33 (Liu and Huang, Reference Liu and Huang2005; Zhong et al., Reference Zhong, Xue and Chen2009; Liu and Liu, Reference Liu and Liu2015). Moreover, n-alkanes from modern topsoil with herbaceous vegetation maximize at C31 in the western Loess Plateau (Wang et al., Reference Wang, Liu, Yi and Xie2003; Zhong et al., Reference Zhong, Xue and Chen2009), whereas n-alkanes from modern topsoil with woody vegetation (shrubs) maximize at C27 or C29 in the arid region of northwestern China (Bai et al., Reference Bai, Fang, Wang, Kenig, Chen and Wang2006a, Reference Bai, Fang, Wang, Kenig, Miao and Wang2006b). Therefore, we interpreted the n-alkane Cmax as a proxy of vegetation in the Alashan Desert, with the n-alkanes C27 or C29 indicating woody vegetation and the n-alkanes C31 or C33 indicating herbaceous vegetation.
Moreover, the ratio of (C27 + C29)/(C31 + C33) has frequently been used to distinguish between OM derived mainly from woody vegetation (high values) and herbaceous vegetation (low values) (Bai et al., Reference Bai, Fang, Nie, Wang and Wu2009). The ratio will be affected by a degradation effect—all long-chain n-alkanes (C>25) will be preferentially degraded by microorganisms that are nonselective for C27, C29, C31, and C33 (Hoffmann and Rehm, Reference Hoffmann and Rehm1977; Bai et al., Reference Bai, Fang, Wang, Kenig, Miao and Wang2006b). Therefore, the ratio of (C27+C29)/(C31+C33) can be used to distinguish woody vegetation from herbaceous vegetation. Higher ratios of (C27+C29)/(C31+C33) in CRTs indicate an increase in woody vegetation, whereas lower ratios indicate an increase in herbaceous vegetation.
CRTs are products of terricolous plants and are formed by encrustation of plant roots by secondary carbonates (Klappa, Reference Klappa1980; Gocke et al., Reference Gocke, Pustovoytov, Kühn, Wiesenberg, Löscher and Kuzyakov2011a; Zamanian et al., Reference Zamanian, Pustovoytov and Kuzyakov2016). In general, for extracellularly calcified roots (rhizocretions), the calcite precipitates are formed as a result of evapotranspiration, and the calcification process is mediated by the activities of root-associated microorganisms in the rhizosphere during relatively dry periods with net moisture deficits. Warmer and wetter climates would be likely to promote greater microbial activity and hence greater microbial production of short-chain n-alkanes (Li et al., Reference Li, Yang, Wang, Hu, Cui, Huang and Jiang2016b; Xue et al., Reference Xue, Dang, Tang, Yang, Xiao, Meyers and Huang2016). Therefore, we interpret the L/H ratio as a proxy for paleoclimate. A high L/H ratio reflects a warm and humid climate, and vice versa.
Gocke et al. (Reference Gocke, Kuzyakov and Wiesenberg2013) found that low CPI values can be related to root biomass. Although roots contain higher portions of even long-chain n-alkanes (Wiesenberg et al., Reference Wiesenberg, Gocke and Kuzyakov2010), root residues cannot be completely separated from the associated microorganisms, which have a high abundance of short-chain n-alkanes, leading to low CPI values (Gocke et al., Reference Gocke, Kuzyakov and Wiesenberg2013). Accordingly, when the CPI values of CRTs are close to 1, this suggests that the source may be the roots of higher plants associated with rhizospheric microbes.
Source apportionment of n-alkanes in CRTs
In previous research, the vegetation under which CRTs were formed was attributed to either woody vegetation or herbaceous vegetation (Rodrı́guez-Aranda and Calvo, Reference Rodrı́guez-Aranda and Calvo1998; Wright and Tucker, Reference Wright and Tucker1988; Alonso-Zarza et al., Reference Alonso-Zarza, Genise, Cabrera, Mangas, Martín-Pérez, Valdeolmillos and Dorado-Valiño2008; Liutkus, Reference Liutkus2009; Gocke et al., Reference Gocke, Kuzyakov and Wiesenberg2010). Rodrı́guez-Aranda and Calvo (Reference Rodrı́guez-Aranda and Calvo1998) suggested that CRTs are associated with the colonization of shrubs based on their dimensions and geometries. Moreover, Alonso-Zarza et al. (Reference Alonso-Zarza, Genise, Cabrera, Mangas, Martín-Pérez, Valdeolmillos and Dorado-Valiño2008) considered that the Cyperaceae presently living on eolian deposits could be producers of CRTs. Liutkus (Reference Liutkus2009) suggested that the CRTs are likely to form around salt grass plants, as halophytic grasses are hardy and can withstand inundation. Therefore, CRTs could be formed by both woody vegetation and herbaceous vegetation under certain environmental conditions.
For most of the CRTs collected in the Alashan Desert, the n-alkanes maximized at C27, C16, or C29 (Fig. 4a), suggesting the sources of n-alkanes in CRTs were higher plants (maximizing at C27 or C29) and microorganisms (short-chain n-alkanes). In addition, Wiesenberg et al. (Reference Wiesenberg, Gocke and Kuzyakov2010) considered that low CPI values (0.8–1.4 in this study) could be related to roots that contain higher proportions of even long-chain n-alkanes, which indicated that the source of n-alkanes in CRTs should be mostly the roots of higher plants. Therefore, the sources of the n-alkanes in CRTs are interpreted to be the roots of higher plants and microorganisms.
Moreover, the n-alkanes of higher plants with 25–33 carbon atoms have single maxima at C27, C29, C31, or C33. (Zech et al., Reference Zech, Rass, Buggle, Löscher and Zöller2012), whereas microbial biomass or degradation products always generate short-chain homologues (C13–C21) and show single maxima at low carbon numbers (Wakeham, Reference Wakeham1990; Ficken et al., Reference Ficken, Li, Swain and Eglinton2000). Although the sources of n-alkanes in CRTs were a mixture of higher plants, microorganisms, and degradation products, the n-alkane Cmax values among these were entirely different. Consequently, the domination of the n-alkane Cmax by C27, C29, C31, or C33 within CRTs could provide evidence of the former vegetation in the Alashan Desert. Therefore, n-alkane proxies from CRTs could indicate woody vegetation or herbaceous vegetation in this region.
Paleovegetation implications
In the present study, the long-chain n-alkane (C >25) results revealed 30 samples (~89%) maximizing at C27 or C29, but no sample maximizing at C31 (Table 1), suggesting that woody vegetation predominated in the Alashan Desert of northwest China during the Holocene. The increasing ratio of (C27 + C29)/(C31 + C33) suggested that woody vegetation occurred in the Holocene and that the biomass of woody vegetation increased during the period 7–2 cal ka BP (Fig. 4b). Moreover, higher ratios of (C27+C29)/(C31+C33) occurred during the period 5–2 cal ka BP in all three deserts examined (Fig. 5b), indicating that the largest biomass of woody vegetation occurred during the period 5–2 cal ka BP.
To clarify whether lipid molecular proxies from CRT records could indicate types of paleovegetation in the Alashan Desert, we compared our results with other proxy records for the deserts of the Alashan Plateau. Li et al. (Reference Li, Wu, Guo, Yu, Ge, Wu, Zhao and Sun2014) compiled 35 previously published pollen records to determine that the vegetation in deserts located in the west Helan Mountains was desert vegetation, including shrub and subshrub vegetation, during the Holocene. In this study, vegetation reconstruction results from lipid molecular proxies suggested that woody vegetation, particularly shrubs, occurred in the Holocene and that there was no exception in mid-Holocene, which is consistent with Li et al. (Reference Li, Wu, Guo, Yu, Ge, Wu, Zhao and Sun2014).
In contrast, pollen records suggest that herbaceous vegetation was the main vegetation during the mid-Holocene (Herzschuh et al., Reference Herzschuh, Tarasov, Wünnemann and Hartmann2004; Zhao et al., Reference Zhao, Yu, Chen and Li2008; Li et al., Reference Li, Wang, Cheng, Long and Zhao2009b). In Eastern Juyan Lake (Fig. 1), located in the northwest of the Badain Jaran Desert, Herzschuh et al. (Reference Herzschuh, Tarasov, Wünnemann and Hartmann2004) found that fossil pollen of Chenopodiaceae, Nitraria, Calligonum, and Reaumuria was abundant through the entire record around the study site (10.7–1.7 cal ka BP). Pollen spectra showed that the highest values of Chenopodiaceae and other drought-resistant plants occurred during the period 10.7–5.4 cal ka BP, and a relative increase in the abundance of Artemisia pollen was characteristic between 5.4 and 3.9 cal ka BP (Herzschuh et al., Reference Herzschuh, Tarasov, Wünnemann and Hartmann2004). Chenopodiaceae pollen levels began to increase during the period 3.9–1.7 cal ka BP (Herzschuh et al., Reference Herzschuh, Tarasov, Wünnemann and Hartmann2004). In Qingtu Lake (Fig. 1), located on the margin of the Tengger Desert, Zhao et al. (Reference Zhao, Yu, Chen and Li2008) and Li et al. (Reference Li, Wang, Cheng, Long and Zhao2009b) found that fossil pollen of Chenopodiaceae, Artemisia, and Ephedra predominated before 7.2 cal ka BP. The vegetation was still dominated by Chenopodiaceae and Artemisia during the period 7.2–4.3 cal ka BP, whereas Artemisia levels increased and reached a maximum value during the period 4.3–3.5 cal ka BP, and the highest value for Nitraria occurred at 3.0 cal ka BP. Thus, the Holocene vegetation reconstruction results in this study are inconsistent with previous pollen records. This inconsistency might be attributable to one or more of three factors.
The first factor is that Eastern Juyan Lake and Qingtu Lake are not located in the hinterland but on the margin of the desert. Therefore, the fossil pollen data from the lake sediments just reflected the signal of the local vegetation on the margin of the desert and not the entire desert vegetation. In contrast, the CRTs collected from the hinterland of the Alashan Desert, and the lipid molecular proxies from CRTs records, could reflect the vegetation signal in the desert.
Second, paleoenvironmental reconstructions undertaken using pollen spectra from fluvial sediments in arid regions are strongly influenced by pollen transport (Zhu et al., Reference Zhu, Xie, Cheng, Chen and Zhang2003). Some dominant pollen types have strong wind transport abilities (Xu et al., Reference Xu, Cao, Tian, Zhang, Li, Li, Li, Liu and Liang2014), and the pollen within the profiles of lakes was transported by running water or wind (Zhu et al., Reference Zhu, Xie, Cheng, Chen and Zhang2003; Herzschuh et al., Reference Herzschuh, Tarasov, Wünnemann and Hartmann2004; Zhao et al., Reference Zhao, Yu, Chen and Li2008; Li et al., Reference Li, Wang, Cheng, Long and Zhao2009b). Singh et al. (Reference Singh, Chopra and Singh1973) suggested that the long-distance transport of pollen from one region to another does not affect the overall picture of the pollen rain to any significant degree. However, fluvial flow has a stronger capacity than wind to transport large quantities of pollen over long distances in this region (Zhu et al., Reference Zhu, Xie, Cheng, Chen and Zhang2003). The Shiyang River passes through multiple vegetation zones over a short distance and transports large amount of upland pollen to the lowlands, where either the local vegetation coverage or total pollen productivity is so low that local pollen assemblages are overwhelmed by allochthonous pollen from uplands (Zhu et al., Reference Zhu, Xie, Cheng, Chen and Zhang2003). Consequently, a considerable proportion of allochthonous pollen within the profiles of lake sediments might come from mountain vegetation, and hence it would be impossible to obtain reliable results for local vegetation.
Third, there is variability among pollen production and transport related to vegetation structure (Bradshaw, Reference Bradshaw1981; Prentice, Reference Prentice1985). The pollen of shrubby species is generally underrepresented compared with the actual vegetation coverage. Herbs are more sensitive to sandstorms and water stress compared with shrubs and will produce more pollen grains or disperse pollen more widely to increase their likelihood of reproduction in the adverse desert environment (Li et al., Reference Li, Xu, Zhao, Yang, Xiao, Chen and Lü2005). Herzschuh et al. (Reference Herzschuh, Kürschner and Ma2003) suggested that Artemisia and Chenopodiaceae are overrepresented, whereas Nitraria, Calligonum, and Reaumuria have low representation for their coverage in the community. On the basis of these considerations, fossil pollen from the lake sediments in this area might not accurately reflect the vegetation and could not be used to directly represent the desert. Consequently, the use of n-alkanes from CRTs can enhance the pollen record for reconstructing vegetation in this area, particularly in the hinterland of the Alashan Desert.
Environmental significance
Previous studies have revealed that the climate of the Alashan Desert, which is currently located in the marginal region of the Asian summer monsoon, was arid in the early Holocene, most humid in the mid-Holocene, and arid again in the late Holocene (Long et al., Reference Long, Lai, Wang and Li2010; Wang et al., Reference Wang, Li, Cheng, Li and Huang2011; Yang et al., Reference Yang, Scuderi, Paillou, Liu, Li and Ren2011; Li et al., Reference Li, Wang, Li, Ning, Cheng and Zhao2015c). In the present study, changes in the L/H ratio indicated that a warm and humid climate occurred during the period 7–5 cal ka BP, whereas an arid and cool climate occurred during the period 5–2 cal ka BP (Figs. 4c and 5c). Moreover, the seasonality of effective humidity during 7–2 cal ka BP is distinct from other intervals without CRT presence, suggesting an arid climate before 7 cal ka BP (Li et al., Reference Li, Wang, Li, Ning, Cheng and Zhao2015c). In this study, the results of lipid molecular proxies from CRT records indicate that vegetation in the hinterland of the Alashan Desert was dominated by woody vegetation, particularly shrubs, during the humid mid-Holocene, and woody vegetation increased from 7 to 2 cal ka BP. Shrub vegetation in the desert is more tolerant and better adapted to drought stress than is herbaceous vegetation (Chang et al., Reference Chang, Zhao and Li2000). Furthermore, changes in the (C27+C29)/(C31+C33) ratio indicated that the biomass of shrub vegetation increased during the period 7–2 cal ka BP (Fig. 4b). Thus, shrubby vegetation increased and the effective moisture decreased during the period 7–2 cal ka BP in this region.
CONCLUSIONS
n-Alkanes in CRTs are a mixture of those from the roots of higher plants and microorganisms. The characteristic n-alkanes derived from higher plants can facilitate effective discrimination between woody vegetation and herbaceous vegetation. In this study, the n-alkanes Cmax of long-chain n-alkanes (C>25) in CRTs maximized at C27, demonstrating that the vegetation in the Alashan Desert was characterized by woody vegetation during the Holocene. Moreover, the increasing woody vegetation and the reduced microbial intensity from 7 to 2 cal ka BP indicate that effective moisture decreased during this period.
Fossil pollen from the lake sediments in this area may not accurately reflect the paleovegetation in the hinterland of the desert. The n-alkane data thus represent an enhancement over use of the pollen record alone for reconstructing vegetation in this area, particularly in the Alashan Desert.
ACKNOWLEDGMENTS
We thank the editor and two anonymous reviewers for their constructive comments, which led to significant improvement of this manuscript. This work was supported by the National Natural Science Foundation of China (grants 41530745 and 41301217).