1. Introduction
Mafic–ultramafic magmas sourced from the mantle form in various tectonic settings and provide important clues to plate tectonic processes and crustal evolution (Polat, Appel & Fryer, Reference Polat, Appel and Fryer2011; Ernst & Jowitt, Reference Ernst, Jowitt, Colpron, Bissig, Rusk and Thompson2013; Jowitt & Ernst, Reference Jowitt and Ernst2013). Among these, layered sequences with podiform chromite deposits associated with ophiolites in convergent tectonic zones are considered to represent residual oceanic lithosphere and provide evidence for the subduction of oceanic lithosphere (Naldrett & von Gruenewaldt, Reference Naldrett and von Gruenewaldt1989; Dilek & Furnes, Reference Dilek and Furnes2011; Furnes, de Wit & Dilek, Reference Furnes, de Wit and Dilek2014). Another group of concentrically zoned Alaskan-type mafic–ultramafic intrusions are considered to form in arc settings and represent uplifted fragments of the deep levels of island arcs with variable contributions from the subducted slab in arc to back-arc settings (Irvine, Reference Irvine1974; Helmy & El Mahallawi, Reference Helmy and El Mahallawi2003; Batanova et al. Reference Batanova, Pertsev, Kamenetsky, Ariskin, Mochalov and Sobolev2005; Pearce & Stern, Reference Pearce, Stern, Christie, Fisher, Lee and Givens2006; Eyuboglu et al. Reference Eyuboglu, Dilek, Bozkurt, Bektas, Rojay and Sen2010; Helmy et al. Reference Helmy, Abd El-Rahman, Yoshikawa, Shibata, Arai, Tamura and Kagami2014, Reference Helmy, Yoshikawa, Shibata, Arai and Kagami2015; Deng et al. Reference Deng, Yuan, Zhou, Xu, Zhang and Guo2015b). Layered mafic–ultramafic intrusions have been central to investigations on magma processes including differentiation, crystal cumulation and sorting, and the formation of magmatic ore deposits (Cawthorn, Reference Cawthorn1996; Howarth & Prevec, Reference Howarth and Prevec2013). They are commonly exposed in cratons mostly within post-collisional settings, or as small bodies within orogenic belts correlated to post-orogenic extensional settings (Su et al. Reference Su, Qin, Sun, Tang, Sakyi, Chu, Liu and Xiao2012; Seo et al. Reference Seo, Oh, Choi and Rajesh2013; Teng & Santosh, Reference Teng and Santosh2015). The mechanism of formation of Fe–Ti oxide/Cu–Ni layers/bodies in these mafic–ultramafic intrusions and related magma chamber processes are debated. The identification of the nature, petrogenesis and tectonic setting of the intrusions are critical to understand the regional geodynamics.
The thick lithospheric keels beneath Archaean crustal rocks are considered to remain stable for a long time owing to their neutral or positive buoyancy, high viscosity, mechanical strength, activation energy and linear or non-linear rheology (Shapiro, Hager & Jordan, Reference Shapiro, Hager and Jordan1999; Nyblade, Reference Nyblade2001; King, Reference King2005). Examples include those of the South African Craton (Boyd & Gurney, Reference Boyd and Gurney1986) and the Western Australian Craton (Anderson, Tanimoto & Zhang, Reference Anderson, Tanimoto and Zhang1992). However, the North China Craton (NCC) is an exception with its eastern part having lost a significant part of the cratonic root through extensive destruction and replacement by a thinner and fertile lithospheric mantle during Mesozoic time with contemporaneous giant magmatic events and associated metallogeny (Li et al. Reference Li, Santosh, Zhang, Shen, Dong, Wang and Zhang2013, Reference Li, Santosh, Zhang, Luo, Zhang, Li, Song and Zhang2014b; Li & Santosh, Reference Li and Santosh2014; Yang et al. Reference Yang, Santosh, Shen and Li2014; Yang & Santosh, Reference Yang and Santosh2015). Mantle-derived ultramafic–mafic rocks provide windows to understand the mechanism of lithospheric thinning (Xu et al. Reference Xu, Huang, Ma, Wang, Lizuka, Xu, Wang and Wu2004b; Yang et al. Reference Yang, Xu, Pei, Yang and Wang2012). However, owing to sparse exposures of contemporaneous mantle-derived mafic rocks in the northern part of the eastern NCC (Beijing area), little is known about the nature of the lithospheric thinning in Mesozoic time in this region. The Early Cretaceous Shangzhuang Fe–Ti-oxide-bearing layered mafic intrusion exposed in the northern part of the NCC, though small in size, displays clear characteristics of layered intrusions within orogenic belts.
In this contribution, we present results from our detailed field investigations, petrography, zircon U–Pb geochronology and Lu–Hf isotopes, and geochemistry of the different rocks from this layered intrusion to evaluate the parent magma composition and crystallization process and their implications on the mantle source origin and petrogenesis. Based on the results, we further assess the geodynamic processes in the lithospheric mantle beneath the northern NCC.
2. Geological setting
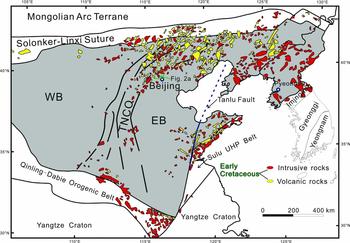
The NCC is generally divided into the Eastern and Western blocks, which were amalgamated along the 300 km wide Trans-North China Orogen (TNCO) during late Palaeoproterozoic time at c. 1.85 Ga (Fig. 1) (Zhao et al. Reference Zhao, Sun, Wilde and Li2005; Santosh, Reference Santosh2010; Zhao & Zhai, Reference Zhao and Zhai2013; Santosh et al. Reference Santosh, Yang, Teng and Tang2015, Reference Santosh, Teng, He, Tang and Yang2016), marking the final cratonization event. However, recent models illustrate the role of microcontinent amalgamation along multiple zones of ocean closure in Archaean time, which built the fundamental cratonic framework of the NCC (e.g. Zhai & Santosh, Reference Zhai and Santosh2011; Li et al. Reference Li, Santosh, Cen, Teng and He2016; Tang et al. Reference Tang, Santosh, Tsunogae and Teng2016; Yang et al. Reference Yang, Santosh, Collins and Teng2016; Yang & Santosh, Reference Yang and Santosh2017). Following the Palaeoproterozoic assembly, multi-stage intraplate rifting occurred within the NCC until Neoproterozoic time, and subsequent Palaeozoic orogenesis at the margins of the craton, as represented by the Early Palaeozoic Qilian–Qinling fold belt and the Late Palaeozoic northeastern China fold belt and Mesozoic extensional tectonics accompanied by lithospheric thinning and decratonization (Zhai & Santosh, Reference Zhai and Santosh2011 and references therein). The Mesozoic Yanshan belt is considered to be an intraplate orogenic belt, which is bounded by the Solonker–Linxi suture to the north, marking the final closure of the Mongolian ocean through continent–arc collision between the NCC and Mongolian arc terranes in Late Permian time (Davis et al. Reference Davis, Zheng, Wang, Darby, Zhang, Gehrels, Hendrix and Davis2001; Xiao et al. Reference Xiao, Windley, Hao and Zhai2003; Teng, Yang & Santosh, Reference Teng, Yang and Santosh2015).
Sketch geological map of the North China Craton (NCC) illustrating the East Block (EC), West Block (WB) and intervening Trans-North China Orogen (TNCO). Early Cretaceous intrusive and volcanic rocks within the NCC are also shown (modified after Zhang et al. Reference Zhang, Zhao, Davis, Ye and Wu2014). The green rectangular region shows the location of the Xuejiashiliang Complex in Figure 2a.

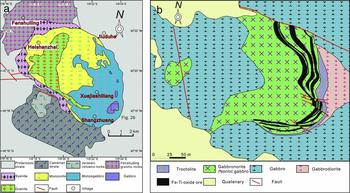
The Early Cretaceous Xuejiashiliang Complex is located in the central part of the Yanshan intraplate orogenic belt (Wang & Zhang, Reference Wang and Zhang2001). It is exposed over an area of ~ 30 km2 and shows a NW–SE strike. Five intrusive phases comprising gabbro, monzogabbro, monzonite, syenite and granite have been distinguished in this complex (Fig. 2a). The monzogabbros, located in the southeastern part of the complex, carry podiform gabbro bodies. The crescent-shaped outcrop of the syenite occurs along the northern and southwestern margins of the complex, with no direct contact relationship with the monzogabbro. The outcrop of monzonite occurs in the northwestern part of the complex and exhibits an embayed boundary against the monzogabbro. The youngest granite body intruded all the three phases except for the gabbro, which occurs within the monzogabbro (Su et al. Reference Su, Niu, Deng, Liu, Zhao and Zhao2007).
(a) Generalized geological map of Xuejiashiliang Complex (modified after Su et al. Reference Su, Niu, Deng, Liu, Zhao and Zhao2007) and (b) detailed map of Shangzhuang intrusion (modified after Liu et al. Reference Liu, Zhou, Yan, Zhao, Su and Wang2015). The red rectangular region in (a) shows the location of the Shangzhuang intrusion in (b).

3. Characteristics of the Shangzhuang intrusion
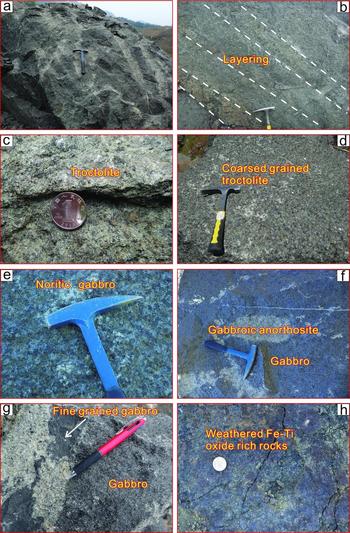
The Shangzhuang mafic intrusion is the largest podiform intrusion among the several gabbroic bodies that were emplaced within the monzogabbro. The outcrop of the intrusion is traced over an area of ~0.6 km2 and strikes generally NE, and is cut by NW–SE-trending diorite dykes, and is partially overlain by Quaternary sediment (Fig. 2b). Within the intrusion, heterogeneous lithologies including troctolite, noritic gabbro/gabbronorite, gabbro and gabbrodiorite have been mapped (Liu et al. Reference Liu, Zhou, Yan, Zhao, Su and Wang2015). All the representative rock types of the intrusion are exposed in quarries, which are open cast mines for Fe–Ti oxide ores (Fig. 3a). Detailed field investigations carried out in this study led to the identification of more lithologies. Broadly, magmatic layering and cumulate textures are well preserved even at the small scale (Fig. 3b). Troctolites in the lower part are greenish grey, and medium to coarse grained (Fig. 3c, d). Noritic gabbros are exposed at higher stratigraphic levels than the troctolite (Fig. 3e). The gabbro suite can be divided into gabbro, gabbroic anorthosite and gabbrodiorite based on field features and the relative mineral proportions. In some cases, the gabbroic anorthosites also occur as enclaves or patches within massive gabbro (Fig. 3f). The gabbros show a sharp contact with the country rocks and the marginal phase is characterized by fine-grained gabbro (Fig. 3g). Oxide ores occur as cyclic layers or lenses within the noritic gabbro and troctolite layers; some of the Fe–Ti oxide-rich domains have been highly weathered (Fig. 3h).
Representative field photographs of the different lithologies within the Shangzhuang mafic layered intrusion. (a) Massive nature and magmatic texture of the intrusion. (b) Silicate and oxide ore-rich interlayers. (c) Medium-grained greenish grey troctolite. (d) Coarse-grained troctolite showing megacrystic texture. Length of hammer for scale is 28 cm; diameter of coin is 1.8 cm. (e) Medium-grained noritic gabbro. (f) Gabbroic anorthosite enclaves within massive gabbro. (g) Gabbro showing sharp contact with country rock and chilled fine-grained gabbro. (h) Highly weathered Fe–Ti oxide-rich rock. Length of hammer for scale is 28 cm; length of pen is 15 cm; diameter of coin is 1.8 cm.

4. Analytical methods
4.a. Petrography
Polished thin-sections for petrography were prepared at the School of Earth and Space Sciences, Peking University. Petrographic studies were carried out at the Institute of Earths Sciences, China University of Geosciences, Beijing and mineral chemistry was analysed using an electron microprobe analyser (JEOL JXA8530F) at the Chemical Analysis Division of the Research Facility Centre for Science and Technology, University of Tsukuba, Japan.
4.b. U–Pb and Lu–Hf analyses
Zircon separation was performed at the Yu'neng Geological and Mineral Separation Survey Centre, Langfang City, Hebei Province, China. The zircon grains were selected by hand picking under a binocular microscope after gravimetric and magnetic separation techniques from crushed rock powder. The grains were mounted onto epoxy resin discs and then polished to expose the internal textures. Before U–Pb dating, zircon grains were imaged under transmitted, reflected light and cathodoluminescence (CL) to check the internal textures in order to choose the most suitable sites for U–Pb analysis. Zircon U–Pb dating and element analyses were carried out on a laser ablation inductively coupled plasma mass spectrometer (LA-ICP-MS) housed at the National Key Laboratory of Continental Dynamics of Northwest University, following the analytical procedures described by Yuan et al. (Reference Yuan, Gao, Liu, Li, Gunther and Wu2004). In the LA-ICP-MS method, the laser spot diameter and frequency were 30 μm and 10 Hz, respectively. Zircon 91500 was employed as a standard and the standard silicate glass NIST was used to optimize the instrument. Raw data were processed using the GLITTER program to calculate isotopic ratios and ages of 207Pb–206Pb, 206Pb–238U and 207Pb–235U, respectively (online Supplementary Material Table S1, available at http://journals.cambridge.org/geo). Data were corrected for common lead, according to the method of Anderson (Reference Anderson2002), and the ages were calculated by ISOPLOT 4.15 software (Yuan et al. Reference Yuan, Gao, Liu, Li, Gunther and Wu2004).
In situ zircon Hf isotopic analyses were conducted on the same spots as those where U–Pb dating was performed, or in adjacent domains with the same or similar textures, using a Neptune multicollector inductively coupled plasma mass spectrometer (MC-ICP-MS) equipped with a 193 nm Geolas Q Plus ArF exciplex laser ablation system at the Tianjin Institute of Geology and Mineral Resources, with spot sizes of 50 μm. Zircon GJ-1 was used as an external standard for in situ zircon Hf isotopic analyses.
4.c. Whole-rock geochemical analyses
The least altered and homogeneous portions of 15 whole-rock samples were crushed and powdered to 200 mesh for geochemical analysis after petrographic observation. Major and trace-element (including rare earth elements, REEs) analyses were conducted at the National Research Centre for Geoanalysis, Beijing. The major elements were determined by X-ray fluorescence (XRF), with analytical uncertainties ranging from 1 to 3%. Loss on ignition was obtained using about 1 g of sample powder heated at 980°C for 30 min. The trace elements were determined as solutes by Agilent 7500ce inductively coupled plasma mass spectrometry (ICP-MS). About 50 mg of powder was dissolved for about seven days at c. 100°C using HF–HNO3 (10:1) mixtures in screw-top Teflon beakers, followed by evaporation to dryness. The material was dissolved in 7N HNO3 and taken to incipient dryness again, and then was re-dissolved in 2% HNO3 to a sample/solution weight ratio of 1:1000. The analytical errors vary from 5 to 10% depending on the concentration of any given element. An internal standard was used for monitoring drift during analyses; further details are given by Gao et al. (Reference Gao, Rudnick, Xu, Yuan, Liu, Walker, Puchtel, Liu, Huang, Wang and Yang2008).
5. Results
5.a. Petrography
5.a.1. Troctolite
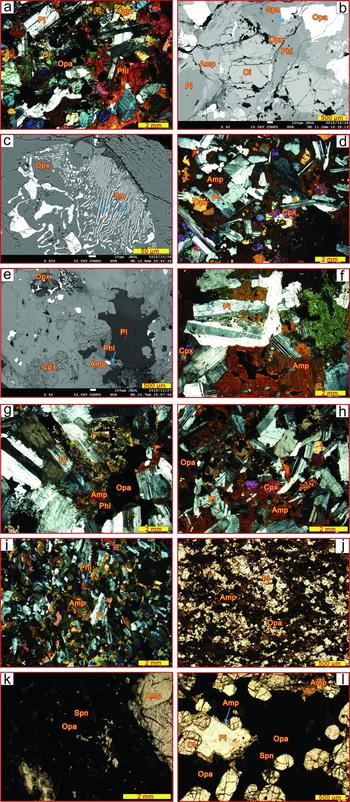
The troctolites are mainly composed of olivine (~20 vol.%) and plagioclase (~50 vol.%) with minor amounts of amphibole (~10 vol.%), phlogopite (~7 vol.%), spinel (~3 vol.%), magnetite and ilmenite (totally ~5 vol.%) (Fig. 4a). The olivine and plagioclase exhibit a cumulate texture with relatively euhedral to subhedral morphologies, whereas orthopyroxene, amphibole and phlogopite are present as interstitial minerals with anhedral to subhedral morphologies and occupy the space between the olivine and plagioclase crystals (Fig. 4b). Orthopyroxene forms rims around olivine grains or elongated tabular plagioclase crystals, and is considered to have resulted from reaction between olivine and residual liquids, as described by Grove & Baker (Reference Grove and Baker1984). Needle-shaped ilmenite exsolution lamellae are present in magnetite grains, and also occur in interstitial orthopyroxene crystals (Fig. 4c).
(a–f) Representative photomicrographs under crossed nicols (a, d, f, g-1063 i and kl), parallel nicols (j) and back-scattered electron image (b, c and e) showing the petrographic characteristics of the Shangzhuang rocks. (a) Major mineral assemblage of Ol + Pl + Opx + Amp + Phl in troctolite. (b) Cumulate olivine and plagioclase with interstitial amphibole and phlogopite. (c) Orthopyroxene with ilmenite lamellae. (d) Mineral assemblage of Pl + Opx + Cpx + Amp + Phl + Mgt in noritic gabbro exhibiting gabbroic texture. (e) Back-scattered electron image of rock showing ilmenite carrying orthopyroxene. (f) Gabbroic anorthosite with mega plagioclase crystals and altered amphiboles. (g) Gabbroic anorthosite showing mafic mineral alteration around opaque minerals. (h) Panoramic photo showing gabbroic texture for gabbro. (i) Gabbrodiorite with amphibole and plagioclase and minor phlogopite and clinopyroxene. (j) Fine-grained gabbro with amphibole, plagioclase and Fe–Ti oxides. (k) Panoramic photo showing the occurrence and texture of Fe–Ti oxide ores. (l) Olivine enclosed in plagioclase in the disseminated oxide ore and amphibole occurs as corona around the contact between plagioclase and Fe–Ti oxides. Mineral abbreviations: Pl – plagioclase; Phl – phlogopite; Opx – orthopyroxene; Cpx – clinopyroxene; Ol – olivine; Amp – amphibole; Ilm – ilmenite; Spn – spinel; Opa – opaque minerals (magnetite + ilmenite).

5.a.2. Noritic gabbro
The noritic gabbro dominantly consists of clino- pyroxene (~15 vol.%), plagioclase (~45 vol.%), amphibole (~20 vol.%) and orthopyroxene (~10 vol.%), showing a gabbroic texture, together with phlogopite, magnetite and ilmenite as minor or accessory minerals (Fig. 4d, e). Amphiboles also occur as megacrysts with enclosed plagioclase, clinopyroxene, orthopyroxene and phlogopite. Orthopyroxene with ilmenite lamellae is also observed under back-scattered electron imaging (Fig. 4e).
5.a.3. Gabbroic anorthosite
The gabbroic anorthosites are composed of plagioclase (~65 vol.%), clinopyroxene (~10 vol.%) and amphibole (~20 vol.%) with minor phlogopite and opaque minerals (including magnetite, ilmenite and spinel). The plagioclase laths are large (mostly 2 mm × 6 mm) and are randomly distributed with interstitial clinopyroxene and amphibole, phlogopite and opaque minerals (magnetite and ilmenite). The mafic minerals have been chloritized, whereas the plagioclase exhibits slight sericitization (Fig. 4f, g).
5.a.4. Gabbro/gabbrodiorite
The gabbro displays a typical gabbroic texture with euhedral plagioclase crystals (~50 vol.%), clinop- yroxene (~25 vol.%) and amphibole (~15 vol.%) as the major minerals together with opaque minerals, including magnetite and ilmenite as accessories. Clinopyroxenes are subhedral to anhedral and occur as interstitial grains between plagioclase laths. Amphiboles occur as both interstitial crystals and large anhedral crystals enclosed within clinopyroxene, plagioclase and Fe–Ti ores. Plagioclase is also observed as subhedral tabular laths randomly distributed with other minerals (Fig. 4h). When compared to gabbro, the gabbrodiorite is fine grained with dominant components of plagioclase (~55 vol.%), amphibole (~15 vol.%) and phlogopite (~15 vol.%) and subordinate clinopyroxene (~10 vol.%) and opaque minerals (Fig. 4i).
5.a.5. Fine-grained gabbro
The fine-grained gabbro is mainly composed of fine- to medium-grained amphibole and plagioclase, with interstitial opaque Fe–Ti oxides (magnetite and ilmenite). The amphiboles display dark green to light greenish grey pleochroism. The plagioclase laths are randomly distributed with a wide size range (Fig. 4j).
5.a.6. Fe–Ti oxide ores
The oxide ore is dominantly composed of magnetite and ilmenite (>60 vol.%), with spinel crystals randomly distributed within the metallic minerals (Fig. 4k). Olivine grains, plagioclase laths and phlogopite occur as isolated grains or aggregates floating within the matrix of opaque minerals. Thin rims of amphiboles are present along the boundary of the opaque mineral and plagioclase laths. Phlogopite is present as a late-stage, intercumulus mineral between the Fe–Ti oxides. The contacts between olivine/plagioclase and oxides are not sharp (Fig. 4l). The typical spinel texture can be explained as having formed by exsolution from Al-bearing opaque minerals such as magnetite or ilmenite (Ishii, Tsunogae & Santosh, Reference Ishii, Tsunogae and Santosh2006).
5.b. Zircon morphology and U–Pb geochronology
Six representative samples were chosen for zircon geochronology using the LA-ICP-MS method. The analytical data are listed in online Supplementary Material Table S1, available at http://journals.cambridge.org/geo, and representative CL images are shown in Figures 5 and 6. The age data are plotted in concordia diagrams in Figures 7 and 8 together with their computed weighted mean 206Pb–238U ages.
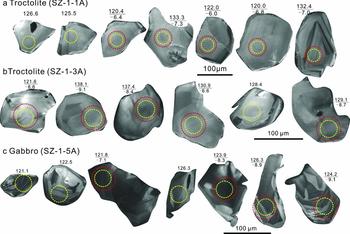
Representative cathodoluminescence (CL) images of zircons from troctolites (SZ-1-1A and SZ-1-3A) and gabbro (SZ-1-5A). The analytical spots for U–Pb (small yellow dotted circles) and Lu–Hf (large red dotted circles), and age and initial ε Hf(t) values (in Ma) are also shown.

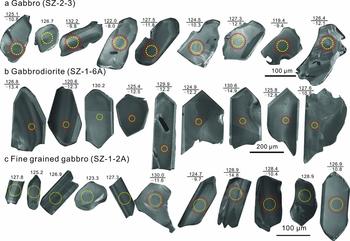
Representative cathodoluminescence (CL) images of zircons from gabbro (SZ-2-3), gabbrodiorite (SZ-1-6A) and fine-grained gabbro (SZ-1-2A). The analytical spots for U–Pb (small yellow dotted circles) and Lu–Hf (large red dotted circles), and age and initial ε Hf(t) values (in Ma) are also shown.

Zircon U–Pb concordia plots for sample SZ-1-1A (a) and sample SZ-1-3A (b) with inserted weighted mean 206Pb–238U age plot.

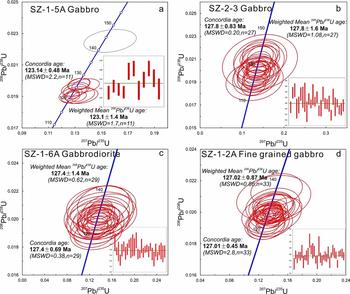
Zircon U–Pb concordia plots with inserted weighted mean 206Pb–238U age plot for sample SZ-1-5A (a), SZ-2-3 (b), SZ-1-6A (c) and SZ-1-2A (d).

5.b.1. Troctolite [SZ-1-1A]
Zircon grains separated from this rock are colourless to light brown, transparent to translucent, and euhedral to subhedral prismatic and elliptical in morphology. The grains show a size range of 50–150 μm × 20–100 μm with aspect ratios of about 2.5:1 to 1:1. Most zircon grains display patchy or sector zoning, whereas a few grains exhibit a homogeneous internal texture (Fig. 5a). A total of 12 U–Pb analyses were conducted on 12 grains. Their Th contents show a range of 17.37–504.32 ppm and U contents show a range of 38.74–366.02 ppm, with Th/U ratios of 0.36–1.78 (online Supplementary Material Table S1, available at http://journals.cambridge.org/geo). On the concordia diagram (Fig. 7a), all these results fall along or near to the concordia line with high concordance (>90%) and yield a well-defined concordia age of 125.6±0.75 Ma (MSWD = 0.17, n = 12), identical to their weighted 206Pb–238U age of 125.6±2.2 Ma (MSWD = 1.7, n = 12). Based on the Th/U ratios and the magmatic textures, this age can be interpreted to represent the timing of crystallization of this rock.
5.b.2. Troctolite [SZ-1-3A]
The zircon grains from this sample mostly show short prismatic to stumpy morphologies, with only a few grains exhibiting an elliptical shape with rounded terminations. They are colourless to light brown, with a size range of 30–110 μm × 20–60 μm and aspect ratios ranging from 3:1 to 1:1. In CL images, the grains display a banded or patchy internal texture, with a few grains showing minor dark inherited cores and newly formed rims (Fig. 5b). A total of 15 U–Pb analyses were made on 15 grains. Except for three zircons (spots #5, #7, #12) from inherited domains exhibiting old ages, the other zircons exhibit Th, U and Th/U values that are in the range of 39.76–2759.09 ppm, 36.29–1074.93 ppm and 1.05–5.12, respectively (online Supplementary Material Table S1, available at http://journals.cambridge.org/geo) and are plotted along or near to the concordia line with a concordance higher than 90%. The data yield a 206Pb–238U weighted mean age of 124.3±2.5 Ma (MSWD of 3.0), which is almost identical to the concordia age of 124.3±1.7 Ma (MSWD = 3.0, n = 12) (Fig. 7b). Both the patchy and sector zoning and Th/U values indicate a magmatic origin for these zircon grains. Thus, the age of c. 124.3 Ma can be interpreted as the timing of the formation of this rock.
5.b.3. Gabbro [SZ-1-5A]
Zircon grains separated from this sample are transparent to translucent, colourless to light brown, euhedral to subhedral prismatic and sub-elliptical in morphology. They vary from 20 to 150 μm in length and 15 to 80 μm in width, with aspect ratios ranging from 3.5:1 to 1.25:1. Most of them display banded or linear zoning, whereas some grains exhibit a patchy or relatively homogeneous internal texture (Fig. 5c). A total of 12 spots on the magmatic domains were analysed from 12 zircon grains. Their Th contents show a range of 188–2536.91 ppm and U contents show a range of 342.93–1974.79 ppm, with Th/U ratios of 0.48–1.70 (online Supplementary Material Table S1, available at http://journals.cambridge.org/geo). On the U–Pb concordia diagram (Fig. 8a), all of the results fall along or near the concordia line with a concordance higher than 94%. Except for one grain (spot #4) that exhibits an older inherited age (c. 144 Ma), the other 11 analyses yield a weighted 206Pb–238U mean age of 123.1±1.4 Ma (MSWD = 1.7) and concordia age of 123.14±0.48 Ma (MSWD = 2.2). Based on the Th/U ratios and the magmatic textures, the c. 123.1 Ma age can be interpreted as the timing of crystallization of this rock.
5.b.4. Gabbro [SZ-2-3]
Zircon grains from this sample are colourless to light brown, transparent to translucent, and mostly show a prismatic and ellipsoidal or sub-rounded morphology with lengths varying from 70–200 μm and a length to width ratio of 1:1–3:1. They mostly display banded, sector or patchy zoning with a few zircons displaying a homogeneous internal texture. Some grains also possess small dark-coloured inherited domains (Fig. 6a). A total of 27 spots were analysed on 27 grains. Their Th contents range from 30.51.27–223.43 ppm and U contents range from 40.04–137.35 ppm with Th/U ratios ranging from 0.74–1.63 (online Supplementary Material Table S1, available at http://journals.cambridge.org/geo). All the 27 spots are highly concordant and distributed as a cluster along the concordia line with a well-defined concordia age of 127.8±0.83 Ma (MSWD = 0.20). The data also yield an almost identical weighted 206Pb–238U mean age of 127.8±1.6 Ma (MSWD = 1.08) (Fig. 8b). The banded, patchy or sector zoning and high Th/U values indicate a magmatic origin of these zircon grains, and the 127.8 Ma age is interpreted as the timing of formation of this rock.
5.b.5. Gabbrodiorite [SZ-1-6A]
The zircons grains from this sample are transparent to translucent and colourless, with a size of 200–500 μm × 100–250 μm and aspect ratios of 4:1 to 1.5:1. Most of these grains exhibit a long prismatic shape with sharp to rounded terminations, while a few grains occur as ellipsoidal or sub-rounded grains. Almost all of them exhibit a banded internal texture and only a few grains have a homogeneous texture (Fig. 6b). A total of 29 spots were analysed on 29 grains and the results show Th contents ranging from 22.67– 318.05 ppm and U contents of 35.26–178.83 ppm with Th/U ratios in a large range of 0.60–1.78 (online Supplementary Material Table S1, available at http://journals.cambridge.org/geo). All the 29 spots form a single cluster along the concordia line with concordance higher than 95%. They defined a concordia age of 127.4±0.69 Ma (MSWD = 0.38) and weighted 206Pb–238U mean age of 127.4±1.4 Ma (MSWD = 0.62) (Fig. 8c). We interpret the age of c. 127.4 Ma as the timing of formation of this rock based on the magmatic features of the zircons (including high Th/U ratios and internal texture).
5.b.6. Fine-grained gabbro [SZ-1-2A]
The zircon grains in this sample mostly show a long prismatic morphology, with a few grains exhibiting an elliptical shape with round terminations. Most of the grains are colourless, and some carrying mineral inclusions show a tawny appearance. The grains vary in size from 60 to 250 μm in length and 20 to 80 μm in width, with aspect ratios ranging from 3.5:1 to 1:1. Under CL imaging, they show banded or patchy zoning, or a homogeneous internal texture (Fig. 6c). A total of 33 analyses were carried out on 33 grains. The results show Th and U contents varying from 43.32–1287.68 ppm and 58.09–459.33 ppm, respectively, and Th/U values of 0.66 to 2.80 (online Supplementary Material Table S1, available at http://journals.cambridge.org/geo). The data show a high concordance (>85%) and cluster along or very near to the concordia line yielding an age of 127.01±0.45 Ma (MSWD = 2.8, n = 33). The weighted 206Pb–238U age is almost identical to the concordia age of 127.02±0.87 Ma (MSWD = 0.86, n = 33) (Fig. 8d). We interpret the c. 127 Ma age as the timing of formation of this rock based on the magmatic features of the zircons (including high Th/U ratios and patchy linear zoning).
5.c. Zircon Lu–Hf isotopes
Representative zircon grains were selected for in situ Hf isotope analysis after zircon U–Pb analysis. A total of 54 spots were analysed on 54 grains from the six samples. The results are listed in Table 1 and illustrated in Figure 9. The data show that most of the 176Lu/177Hf ratios are less than 0.002, indicating the absence of any major enrichment of radiogenic Hf after the formation of the zircons. Thus, the 176Hf/177Hf ratios can be used as a robust reference to deduce the origin (Wu et al. Reference Wu, Li, Zheng and Gao2007). The fLu/Hf values display a tight range from −0.95 to −1.00, which are obviously lower than the fLu/Hf values of mafic crust (−0.34, Amelin, Lee & Halliday, Reference Amelin, Lee and Halliday2000) and sialic crust (−0.72, Vervoort & Patchett, Reference Vervoort and Patchett1996). Wu et al. (Reference Wu, Li, Zheng and Gao2007) suggested that the two-stage model age is more appropriate for these rocks than the single-stage model to evaluate the time of source material extraction from the depleted mantle or the residence time of the source material in the crust. The discrepancy between the two-stage model age and actual model age becomes larger when the ages of the zircons are much younger.
LA-MC-ICP-MS Lu–Hf isotope data on zircons for SZ-1-1A (troctolite), SZ-1-3A (troctolite), SZ-1-5A (gabbro), SZ-2-3 (gabbro), SZ-1-6A (gabbrodiorite) and SZ-1-2A (fine-grained gabbro) from the Shangzhuang intrusion in this study

Note: 176Lu decay constant λ = 1.867×10⁻¹¹ yr−1 (Söderlund et al. Reference Söderlund, Patchett, Vervoort and Isachsen2004); chondritic values: (176Lu/177Hf)CHUR = 0.0332±0.0002, (176Hf/177Hf)CHUR = 0.282772±0.000029 (Blichert-Toft & Albarède, Reference Blichert-Toft and Albarède1997); depleted mantle values: (176Lu/177Hf)DM = 0.0384, (176Hf/177 Hf)DM = 0.28325 (Griffin et al. Reference Griffin, Pearson, Belousova, Jackson, Van Achterbergh, O'Reilly and Shee2000); Hfi: initial Hf isotope composition for U–Pb age; fLu/Hf = (176Lu/177Hf)sample/(176Lu/177Hf)CHUR−1; TDM = 1/λ×ln(1 + ((176Hf/177Hf)sample − (176Hf/177Hf)DM)/((176Lu/177Hf)sample − (176Lu/177Hf)DM)); TDM C = 1/λ×ln(1 + ((176Hf/177Hf)sample,t − (176Hf/177Hf)DM,t)/((176Lu/177Hf)c − (176Lu/177Hf)DM)) + t; (176Lu/177Hf)c = 0.015; t = crystallization time of zircon. The 176Hf/177Hf ratios reported were corrected according to the recommended value of the standard zircon 91500.
Plot of ε Hf(t) v. U–Pb age for the Shangzhuang samples and data from Early Ordovician to Early Cretaceous magmatic bodies in northern Hebei and kimberlites in the eastern North China Craton. Hf isotopic compositions of zircons from hornblendite and clinopyroxenite are from Teng, Yang & Santosh (Reference Teng, Yang and Santosh2015). Hf isotopic compositions of zircons from dacite and rhyolite are from Yang et al. (Reference Yang, Wu, Shao, Xie and Liu2006b). Hf isotopic compositions of zircons from Neoarchaean granitoid gneisses are from Liu et al. (Reference Liu, Lü, Wang, Yang, Bai and Feng2011). Hf isotopic compositions of zircons from Xianghuangqi hornblende gabbro, Wudaoyingzi diorite, Tianqiao quartz diorite, Lingying granodiorite and Zhoutaizi quartz diorite are from Zhang et al. (Reference Zhang, Zhao, Kröner, Liu, Xie and Chen2009a). Hf isotopic compositions of zircons from Hongshila pyroxenite, Xiahabaqin rodingite, Baiqi hornblendite and Boluonuo hornblende gabbro are from Zhang et al. (Reference Zhang, Zhao, Kröner, Liu, Xie and Chen2009b). Hf isotopic compositions of zircons from kimberlites in the eastern North China Craton are from Zhang & Yang (Reference Zhang and Yang2007). Hf isotopic compositions of zircons from Xiaozhangjiakou mafic–ultramafic complex are from Tian et al. (Reference Tian, Chen, Liu and Zhang2007). Hf isotopic compositions of zircons from Gushan monzodiorite are from Zhang et al. (Reference Zhang, Zhao, Song and Liu2007). The Hf isotopic value of enriched mantle of the North China Craton is from Chen et al. (Reference Chen, Tian, Jahn and Chen2008) and Yang et al. (Reference Yang, Wu, Chung, Wilde and Chu2006a).

Six zircons from sample SZ-1-1A analysed for in situ Hf isotopic composition exhibit initial 176Hf/177Hf ratios varying from 0.282482 to 0.282526 and ε Hf(t) values ranging from −7.3 to −6.0 when calculated with respect to the corresponding U–Pb age. Their Hf depleted mantle model ages (TDM) and Hf crustal model ages (TDMC) range from 1008–1067 Ma and 1565‒1657 Ma, respectively. Seven analyses were carried out on selected zircon grains from sample SZ-1-3A, and the results show initial 176Hf/177Hf ratios in the range of 0.2822844 to 0.282505. They show variation in ε Hf(t) values from −14.5 to −6.6. The Hf depleted mantle model ages (TDM) of these zircons range from 1033 Ma to 1346 Ma and the Hf crustal model ages (TDMC) from 1607‒2105 Ma against their corresponding U‒Pb ages.
Five spots on selected zircon grains from gabbro (sample SZ-1-5A) yielded initial 176Hf/177Hf values between 0.282337 and 0.282496 and negative ε Hf(t) values between −12.2 and −7.1 with an average of −9.1, when calculated by their own 206Pb–238U age. The depleted mantle ages (TDM) and crustal residence ages (TDMC) range from 1060–1301 Ma and 1632–1974 Ma, respectively. A total of 11 Lu–Hf analyses were conducted on zircon grains from another gabbro (SZ-2-3). The results exhibit initial 176Hf/177Hf values ranging from 0.282280 to 0.282471, and negative ε Hf(t) values between −14.5 and −8.0 with an average of −11.3, when calculated by their 206Pb–238U age. Their depleted mantle ages (TDM) and crustal residence ages (TDMC) are in the range of 1090 to 1367 Ma and 1689 to 2110 Ma, respectively.
Fourteen spots were analysed on representative zircon grains from sample SZ-1-6A (gabbrodiorite). They show initial 176Hf/177Hf values ranging from 0.282268 to 0.282411, and negative ε Hf(t) values between −14.9 and −9.9 with an average of −13.0, when calculated by their 206Pb–238U age. Their depleted mantle ages and crustal residence ages (TDMC) are in the range of 1171 to 1382 Ma and 1818 to 2137 Ma, respectively.
Eleven analyses on fine-grained gabbro (sample SZ-1-2A) display initial 176Hf/177Hf ratios varying from 0.282274 to 0.282421 and ε Hf(t) values ranging from −14.9 to −9.7 calculated with respect to the corresponding U–Pb age. The ε Hf single-stage model ages (TDM) range from c. 1162 Ma to c. 1373 Ma, and two-stage model ages (TDMC) from c. 1799 Ma to 2127 Ma.
In the ε Hf(t) versus U–Pb age plot (Fig. 9), data are plotted on or near the array of the presumed sub-continental lithospheric mantle (SCLM) area (yellow shaded region in Fig. 9). The array and average line for the evolution of enriched SCLM are based on the following lines of argument. (1) The ε Hf(t) value of −9.0 was estimated for enriched mantle of the NCC by Chen et al. (Reference Chen, Tian, Jahn and Chen2008) and Yang et al. (Reference Yang, Wu, Chung, Wilde and Chu2006a) at c. 220 Ma. (2) The ε Hf(t) values for the captured ~490 Ma zircons represent an enriched mantle source which had been metasomatized by fluid or/and melt released through subduction of the Mongolian oceanic slab during Late Palaeozoic time (Tian et al. Reference Tian, Chen, Liu and Zhang2007). The average line was defined by the value of ~−9.0 at 220 Ma and average value of ε Hf(t) values for the captured ~490 Ma zircons, whereas the array is bounded by the maximum and minimum values of the captured zircons and the boundaries are assumed to be parallel to the average evolution line. If no more enrichment occurred after 220 Ma, the evolutionary array would follow the pattern as indicated by the black broken line. If the original enriched mantle is further enriched, the evolution line and array for SCLM would exhibit more negative ε Hf(t) values. As shown in Figure 9, the data from our zircon grains plot in the array of the presumed SCLM. We, therefore, conclude that the source of the magma is likely linked to the enriched SCLM which had been fertilized by the metasomatism induced by the subduction of the Mongolian oceanic slab during Late Palaeozoic time.
5.d. Whole-rock geochemistry
Whole-rock geochemistry data, including major, minor, trace and rare earth elements for the different rocks from the Shangzhuang intrusion are presented in Table 2. A total of 15 samples were analysed including four troctolites, two noritic gabbros, two gabbroic anorthosites, four gabbros, one gabbrodiorite and two fine-grained gabbros.
Major, trace and rare earth concentrations of the whole-rock samples from Shangzhuang layered intrusion

Note: PM denotes normalization to primitive mantle values of Sun & McDonough (Reference Sun, McDonough, Saunders and Nony1989), while N denotes normalization to chondrite values of Sun & McDonough (Reference Sun, McDonough, Saunders and Nony1989); TFe2O3 = total Fe2O3; Nb/Nb* =  ${\rm{N}}{{\rm{b}}_{{\rm{PM}}}}/\sqrt {{\rm{T}}{{\rm{h}}_{{\rm{PM}}}} \times {\rm{L}}{{\rm{a}}_{{\rm{PM}}}}} $; Ce/Ce* =
 ${\rm{C}}{{\rm{e}}_{\rm{N}}}/\sqrt {{\rm{L}}{{\rm{a}}_{\rm{N}}} \times {{\Pr }_{\rm{N}}}} $; Eu/Eu* =
 ${\rm{E}}{{\rm{u}}_{\rm{N}}}/\sqrt {{\rm{S}}{{\rm{m}}_{\rm{N}}} \times {\rm{G}}{{\rm{d}}_{\rm{N}}}} $; Troc – troctolite; Fgg – fine-grained gabbro; Ganor – gabbroic anorthosite; Norg – noritic gabbro; Gabdo – gabbrodiorite.
5.d.1. Alteration assessment
Though the least altered and homogeneous portions of rocks from the Shangzhuang intrusion were selected for whole-rock geochemical analysis, it is still necessary to assess the effects and extent of post-magmatic alteration on geochemical compositions before utilizing the geochemical data for petrogenetic interpretations. Low loss on ignition values (< 2.02 wt%) for these rocks and the lack of correlation with mobile elements, such as K, Na, Ca and Rb, suggest that the possible alteration in these samples is negligible. In addition, their limited Ce anomalies within the range of 0.90–1.03 and the high degree of other elemental correlation with the least mobile Zr on binary diagrams with a coefficient (R) > 0.75 (figure not shown) further confirm the negligible post-magmatic alteration (Polat & Hofmann, Reference Polat and Hofmann2003).
5.d.2. Major and trace elements
Two types of troctolites can be distinguished according to their major element contents. The samples from the bottom of the intrusion exhibit moderate variations in SiO2 (30.99–34.17 wt%), Al2O3 (12.12– 12.21 wt%), TFe2O3 (28.60–32.40 wt%), TiO2 (4.11–5.04 wt%), MgO (11.65–12.43 wt%), CaO (3.86–4.39 wt%), Na2O (1.89–1.97 wt%) and K2O (0.44–0.49 wt%), whereas those from the upper domain display relatively high contents of SiO2 (41.78–44.00 wt%) and CaO (8.09–9.32 wt%), but conspicuously low TFe2O3 (15.63–15.66 wt%) and TiO2 (1.62–2.13 wt%), with a large variation in Al2O3 (7.70–14.33 wt%), MgO (9.87–19.5 wt%), Na2O (1.69–2.54 wt%) and K2O (0.60–0.79 wt%) contents. The noritic gabbros and gabbroic anorthosite samples exhibit similar contents of SiO2 (42.82–46.00 wt%), TFe2O3 (11.94–14.27 wt%), TiO2 (1.35–2.51 wt%), CaO (8.87–10.95 wt%), K2O (0.53–1.33 wt%) and Na2O (1.67–4.46 wt%), but show a difference in Al2O3 (noritic gabbros: 8.76–13.58 wt%; gabbroic anorthosites: 16.50–16.76 wt%) and MgO (noritic gabbros: 11.06–16.97 wt%; gabbroic anorthosites: 4.82–6.51 wt%), which could be a reflection of the variation in the modal proportion of orthopyroxene and plagioclase. The gabbros show limited variations in SiO2 (43.42–47.37 wt%) and TiO2 (2.19–2.66 wt%), and moderate variations in Al2O3 (10.77–16.73 wt%), TFe2O3 (12.04–16.50 wt%), MgO (5.24–9.96 wt%), CaO (7.54–12.49 wt%), Na2O (1.99–4.42 wt%) and K2O (0.55–2.38 wt%). Compared to the gabbros, the gabbrodiorite exhibits high contents of SiO2, Al2O3, Na2O and K2O at 58.28 wt%, 17.91 wt%, 5.45 wt% and 3.90 wt%, respectively, while having low contents of TiO2 (1.12 wt%) TFe2O3 (5.72 wt%), MgO (2.01 wt%) and CaO (3.7 wt%). The fine-grained gabbros exhibit very similar content of SiO2 (47.91–49.27 wt%) and TiO2 (2.32–2.42 wt%), and moderate variations in Al2O3 (15.30–15.32 wt%), TFe2O3 (11.65–12.66 wt%), MgO (4.36–4.96 wt%), CaO (6.36–7.06 wt%), Na2O (4.73–4.74 wt%) and K2O (1.38–2.94 wt%). In the TAS plot (Fig. 10a), these rocks fall in the alkaline field. In terms of the Zr/TiO2–Nb/Y relationship (Fig. 10b), the rocks are plotted in the trachy-andesite and sub-alkaline to alkaline basalt field. Both these features emphasize their alkaline affinity.
Variation diagrams of major and trace elements from the samples from the Shangzhuang intrusion. (a) Na2O+K2O (wt%) versus SiO2 (wt%) plot. (b) Zr/TiO2 versus Nb/Y classification diagram. The fields in (a) are from Wilson (Reference Wilson1989) and in (b) from Winchester & Floyd (Reference Winchester and Floyd1976).

All these rocks exhibit similar patterns in the chondrite-normalized REE diagram (Fig. 11), with relative enrichment in LREEs (light rare earth elements) compared to HREEs (heavy rare earth elements). The troctolite samples from the bottom layer exhibit total REE abundances lower than the samples from the higher domain (Fig. 11a), and show relatively high positive Eu anomalies with values in the range of 1.49–1.55 compared to 1.14–1.32. Their (La/Yb)N ratios are in the range of 21.84–24.42 and 13.68–18.01, respectively. The noritic gabbro and gabbroic anorthosite samples exhibit relatively flat patterns when compared to troctolites, with (La/Yb)N ratios ranging from 10.48 to 18.95 and positive Eu anomalies varying from 1.08 to 1.40 (Fig. 11b). The gabbro samples can be classified into two groups, following their different locations. The gabbros adjacent to the gabbrodiorite exhibit parallel and overall elevated patterns with the gabbrodiorite, and both rock types display high (La/Yb)N ratios in the range of 28.80–41.75, whereas the gabbros from the lower layer display comparable flat patterns with (La/Yb)N ratios varying from 8.74 to 19.01. Both the gabbros and gabbrodiorite are characterized by positive Eu anomalies with values ranging from 1.08 to 1.66 (Fig. 11c; Table 2). The fine-grained gabbro samples exhibit similar LREE concentrations but with minor differences in HREEs and (La/Yb)N ratios in the range of 36.46–38.17, accompanied by positive Eu anomalies (1.14–1.19) (Fig. 11d).
Chondrite-normalized REE patterns for (a) troctolites, (b) noritic gabbros and gabbroic anorthosites, (c) gabbros and gabbrodiorite and (d) fine-grained gabbros. Chondrite values are from Sun & McDonough (Reference Sun, McDonough, Saunders and Nony1989).

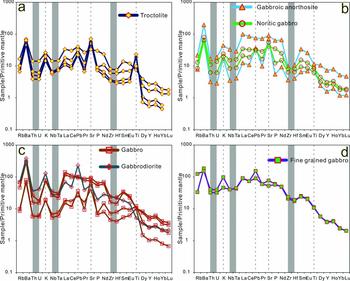
On spider diagrams normalized to primitive mantle (Fig. 12), the Shangzhuang rocks exhibit enrichment in large-ion-lithophile elements (LILEs), relative to high-field-strength elements (HFSEs). Two distinct distribution patterns can be distinguished. Two troctolites, one gabbroic anorthosite, one noritic gabbro, the gabbrodiorite and two gabbros exhibit similar patterns with peaks at Ba, K, Pb, Sr and Ti and nadir at Ce and Pr, coupled with overt Th–U and Nb–Ta ‘troughs’ relative to LILEs, and a Zr–Hf concave pattern relative to LREEs. The other samples (two troctolites, one gabbroic anorthosite, one noritic gabbro, two gabbros and two fine-grained gabbros) exhibit similar patterns characterized by peaks at Ba, K, Pb and Sm and nadir at Ce, Pr and P, coupled with an overall La–Nd convex pattern with conspicuous troughs at Th–U and Zr–Hf. The behaviour, especially for the Ti patterns for different samples, is considered to be controlled by the modal proportion of Fe–Ti oxide.
Primitive mantle-normalized variation diagrams for (a) troctolites, (b) noritic gabbros and gabbroic anorthosites, (c) gabbros and gabbrodiorite and (d) fine-grained gabbros. Primitive mantle values are from Sun & McDonough (Reference Sun, McDonough, Saunders and Nony1989).

6. Discussion
6.a. Evaluation of parent magma and differentiation
Given the close relationship between different lithologies within the Shangzhuang intrusion and their broadly comparable U–Pb ages (Figs 7, 8) as well as similar Hf isotopic compositions (Table 1, Fig. 9), we infer that these rocks share a common parent magma or were generated from similar sources.
It is difficult to precisely estimate the primary parent magma of the Shangzhuang intrusion owing to the fact that the intrusive rocks are silicate oxide mineral cumulates. Unlike other Early Cretaceous gabbros from the eastern NCC, which exhibit conspicuous negative Nb, Ta and Ti anomalies (Xu et al. Reference Xu, Huang, Ma, Wang, Lizuka, Xu, Wang and Wu2004a,b; Huang, Zhong & Xu, Reference Huang, Zhong and Xu2012; Xie et al. Reference Xie, Zhang, Hou, Santosh, Jin, Han and Cheng2015), the Shangzhuang intrusion exhibits positive Ti anomalies and trifling negative Nb–Ta anomalies (Fig. 12), indicating Ti enrichment in the parent magma. At the same time, the presence of abundant Fe–Ti oxide minerals in different rock units suggests possible high TFe2O3 contents in the parent magma the same as the enrichment in Ti (Liu et al. Reference Liu, Zhou, Yan, Zhao, Su and Wang2015; Teng et al. Reference Teng, Santosh, Tsunogae and Tang2016). In addition, high TiO2 contents in hornblende and clinopyroxene and the common occurrence of ilmenite exsolution lamellae from orthopyroxene, magnetite and spinel, as well as the presence of magnetite exsolution lamellae in orthopyroxene and spinel, further suggest that these cumulus minerals were crystallized from Fe–Ti-rich melts (Teng et al. Reference Teng, Santosh, Tsunogae and Tang2016). The Fo content of the most primitive olivine in this intrusion is ~70–75 mol.% (Teng et al. Reference Teng, Santosh, Tsunogae and Tang2016), indicating possible Mg enrichment in the parent magma. On the other hand, the Fo content of the olivine is notably lower than that of olivine crystallizing from a primary mantle-derived magma (Fo > 90 mol.%). The low Ni content in olivine and low Cr content in magnetite (Teng et al. Reference Teng, Santosh, Tsunogae and Tang2016) further indicate that the Shangzhuang intrusion formed by fractionation. Usually, amphibole and mica are water-bearing minerals, and especially, amphibole is the product of incongruent melting that was triggered by a water-fluxed melt regime (Slagstad, Jamieson & Culshaw, Reference Slagstad, Jamieson and Culshaw2005; Berger et al. Reference Berger, Burri, Alt-Epping and Engi2008). Thus, the presence of water-bearing minerals including the euhedral magmatic amphibole (Fig. 4d) and phlogopite (Fig. 4b) that are nearly coeval with the formation of cumulate olivine and plagioclase suggest that the primary magma was hydrous. In summary, the parent magma of the Shangzhuang layered intrusion was rich in Ti, Mg and Fe, and hydrous. The concentrations of incompatible trace elements in the parent magma can be estimated by using the average composition of common cumulus mineral crystals in the most primitive lithological units and available experimental mineral/liquid partition coefficients (Roeder & Emslie, Reference Roeder and Emslie1970; Hart & Dunn, Reference Hart and Dunn1993; Hauri, Wagner & Grove, Reference Hauri, Wagner and Grove1994; Foley et al. Reference Foley, Jackson, Fryer, Greenouch and Jenner1996). In this study, owing to lack of trace-element data for the minerals, it is not possible for us to evaluate the trace elemental signature of the parent magma. The fine-grained gabbro samples could be chemically equivalent to the parent components based on the following lines evidence. (1) The fine-grained gabbro exhibits a chilled phase when in contact with the country rocks. (2) The emplacement age of the fine-grained gabbro is defined as 127.01±0.45 Ma, broadly identical to other lithologies, excluding it as a later intrusion. (3) Similar Hf isotopes in the zircons suggest the same source. (4) Compared to the Fe–Ti oxide-rich layers, the fine-grained gabbro samples exhibit higher SiO2 contents, indicating that it was formed by vertical injection during the ascent of the magma chamber before significant differentiation occurred, rather than as residual melts after differentiation with low silica contents. These fine-grained gabbro samples are mainly composed of amphibole and plagioclase, with interstitial Fe–Ti oxides (Fig. 4k); they are chemically identical to Fe-rich basalts (Fig. 10a, b) with SiO2 and TFe2O3 in the range of 47.91–49.27 wt% and 11.65–12.66 wt%. Their high TiO2 (2.32–2.42 wt%) and MgO (4.36–4.96 wt%) contents are also in accordance with the enrichment in Ti and Mg as inferred above.
The conspicuous layered sequence of the Shangzhuang intrusion and varied proportion of minerals in different lithologies is the result of crystal sorting and accumulation, followed by differentiation, which are typical formation mechanisms for gabbros from basaltic melts (Wager & Brown, Reference Wager and Brown1968; Irvine, Reference Irvine and Yoder1979; Smith et al. Reference Smith, Huang, Walawender, Cheung and Wheeler1983; Sisson, Grove & Coleman, Reference Sisson, Grove and Coleman1996). In these lithologies, the ubiquitous presence of euhedral to subhedral minerals including high-Mg no. olivine and plagioclase were the first batch of products to form as cumulates from the magma, as evidenced by their euhedral crystal morphology in different lithologies (Fig. 4), marked positive correlation between MgO and Ni, and negative correlation between MgO and Al2O3 (Fig. 13a, b). As the plagioclase laths are less dense than olivine grains and form from relatively evolved parent magma after the extraction of already crystallized minerals, they tend to float on the roof of the magma chamber by buoyancy (Morse, Reference Morse and Isachsen1968; Emslie, Reference Emslie, Tobi and Touret1985). Because of their higher density, the olivine grains are more likely to contact with the liquid, and reaction of SiO2-enriched melts with olivine results in the formation of orthopyroxene, which would explain the discrete crystals or rims mantling the olivine grains (Fig. 4b). The gravitational separation of plagioclase and olivine and the formation of orthopyroxene would make the magma much denser and more mafic because of the depletion in CaO, MgO, Al2O3 and SiO2 and the enrichment of heavier components such as TiO2, FeO and Fe2O3. The total iron content of the melt increases along the tholeiitic fractionation trend as experimentally illustrated by Grove & Baker (Reference Grove and Baker1984). Thus, Fe–Ti- rich residual magma would produce magnetite, ilmenite and titano-magnetite as later cumulus oxide minerals. However, owing to the variable modal proportions of these oxide minerals, the correlation trends between MgO and TiO2, between MgO and TFe2O3, and between MgO and vanadium (V) (Fig. 13c, d, e) are not well defined. Anyhow, the broad positive correlations between MgO and TiO2, between MgO and TFe2O3, and between MgO and V all indicate the fractional crystallization of the first batch cumulates, especially olivine. The large scattered trend between MgO and P2O5 (Fig. 13f) indicates the fractionation of apatite was not significant, which is different from layered intrusions containing cumulate nelsonites (Darling & Florence, Reference Darling and Florence1995; Dymek & Owens, Reference Dymek and Owens2001; Charlier et al. Reference Charlier, Sakoma, Sauvé, Stanaway, Auwera and Duchesne2008; Tollari et al. Reference Tollari, Barnes, Cox and Nabil2008; Chen, Zhou & Zhao, Reference Chen, Zhou and Zhao2013). The further evolved residual magma system would attain a new equilibrium and lead to the crystallization of Na-rich plagioclase, amphibole and phlogopite.
Co-variation diagrams against MgO (as fractionation index) for rocks from the Shangzhuang intrusion as follows: (a) Ni, (b) Al2O3, (c) TiO2, (d) TFe2O3, (e) V and (f) P2O5.

6.b. Assessment of crustal contamination
Contamination of crustal materials is crucial for magmas during ascent or solidification of mantle-derived melts within continental crust, especially in the case of ultramafic–mafic layered intrusions (Campbell, Reference Campbell1977; Kinnaird et al. Reference Kinnaird, Kruger, Nex and Cawthorn2002). Relatively low Th/Ta (<1.85), Ba/Zr (<5.56) and high Nb* ((Nb/Nb* = NbPM/√(ThPM × LaPM) (normalized to primitive mantle) = >0.66) anomaly values of the fine-grained gabbro samples from the Shangzhuang intrusion indicate limited crustal contamination. The ratios of Nb, Th, La, Sm and Y have been utilized as proxies for assessing crustal contamination in different settings (e.g. Wallace, Jowitt & Saleem, Reference Wallace, Jowitt and Saleem2015; Santosh et al. Reference Santosh, Teng, He, Tang and Yang2016). Magmas originating at depth and which are influenced by crustal contamination during ascent should show a hyperbolic trend, during their passage through lower continental crust to upper continental crust. However, the behaviours of the Shangzhuang samples (non-hyperbolic trend and especially narrow variation in the ratios for the fine-grained gabbro samples) as shown in Figure 14 exclude any significant role of crustal contamination. The enrichment of the fine-grained gabbro samples would be better interpreted as the influence of the magma source region at depth rather than processes in the magma chamber at the sites of ascent and final emplacement. The negligible contamination could also be evidenced by the broadly identical Lu–Hf isotopic compositions of the different lithologies in this intrusion (Fig. 9; Table 1), suggesting the homogeneous nature of the magma.
Diagrams showing variations in (a) Nb/Th and La/Sm, and (b) (Nb/Th)PM and (Th/Yb)PM for the samples analysed in this study. PM denotes normalization to primitive mantle values of Sun & McDonough (Reference Sun, McDonough, Saunders and Nony1989), with N-MORB (N-type mid-ocean ridge basalt), E-MORB (E-type mid-ocean ridge basalt) and OIB (oceanic island basalt) compositions also from Sun & McDonough (Reference Sun, McDonough, Saunders and Nony1989). The upper continental crust (UCC), middle continental crust (MCC) and lower continental crust (LCC) compositions are from Rudnick & Gao (Reference Rudnick, Gao and Rudnick2003).

6.c. Source nature of the Shangzhuang intrusion
The ratios of highly incompatible trace elements, such as Th, La, Ba and Nb, show only limited variation for moderately evolved magma under various petrogenetic processes such as partial melting or fractional crystallization, and are therefore particularly useful as sensitive proxies to differentiate between the contribution of convecting and non-convecting parts of the mantle to the sources of basaltic rocks (Saunders et al. Reference Saunders, Storey, Kent, Norry, Alabaster, Storey and Pankhurst1992; Peate, Reference Peate, Mahoney and Coffin1997; Jourdan et al. Reference Jourdan, Bertrand, Schärer, Blichert-Toft, Fëraud and Kampunzu2007). For example in the Th/Yb versus Nb/Yb plot illustrated in Figure 15a, rocks from the Shangzhuang intrusion fall along the MORB–OIB mantle array from E-MORB to OIB with parent-equivalent fine-grained gabbros plotted near to OIB average values, exhibiting an enriched source. The higher Th/Yb ratios are likely attributed to the conservative behaviour of Yb in the subducted slab, but addition of Th and LREEs from the slab to the wedge (Pearce, Reference Pearce2008). Overall, their distribution patterns in Figure 15a are similar to rocks from the Shona Ridge system and Discovery Rise (Le Roex et al. Reference Le Roex, Class, O'Connor and Jokat2010), exhibiting limited crustal contribution to the source origin, and are distinct from the basaltic rocks from the Karoo large igneous province (LIP) with crustal input in the source origin (Jourdan et al. Reference Jourdan, Bertrand, Schärer, Blichert-Toft, Fëraud and Kampunzu2007; Neumann et al. Reference Neumann, Svensen, Galerne and Plamke2011). The trends of the rocks shown in Figure 15a also follow the vector of within-plate variation and fractional crystallization, and further indicate possible magma differentiation and crystal sorting as discussed above. The plots of La/Ba versus La/Nb (Fig. 15b) are located in the area towards the lithosphere with the fine-grained gabbro samples exhibiting more affinity to OIB. This inference is also corroborated by Nb/U and Ce/Pb ratios of the fine-grained gabbro samples, which are in the range of 34.46–43.13 and 12.02–20.34, respectively, showing remarkable similarity with those of OIB (Nb/U ~47±10; Ce/Pb ~25±5; Hofmann et al. Reference Hofmann, Jochum, Seufert and White1986; Hofmann, Reference Hofmann1988; Sun & McDonough, Reference Sun, McDonough, Saunders and Nony1989), and suggest interaction of asthenospheric mantle or deeper-mantle materials with lithospheric mantle components. In summary, the rocks have an enriched mantle origin with limited crustal input. The enriched source region for the parent magma also is also supported by the ε Hf(t) values as illustrated in Figure 9. Since the crustal input is limited, we infer that the enriched SCLM under the NCC was stable, at least during the formation of the Shangzhuang intrusion and in the interior domain beneath the craton.
Trace-element plots of (a) Th/Yb v. Nb/Yb and (b) La/Ba v. La/Nb from rocks from the Shangzhuang intrusion. In (a), the shaded areas for oceanic arcs and continental arcs are from Wilson (Reference Wilson2001); N-MORB, E-MORB and OIB average values are from Pearce (Reference Pearce2008). Abbreviations: s – subduction component vector; cc – crustal contamination vector; w – within-plate variation; f – fractional crystallization; LC – lower crust; MC – middle crust; UC – upper crust; CC – continental crust. All the crustal values are from Rudnick & Gao (Reference Rudnick, Gao and Rudnick2003). The field in (b) is from Saunders et al. (Reference Saunders, Storey, Kent, Norry, Alabaster, Storey and Pankhurst1992). The geochemical data on the Shona Ridge system and Discovery Rise rocks is from Le Roex et al. (Reference Le Roex, Class, O'Connor and Jokat2010), while rocks of the Karoo LIP with high-Ti and low-Ti were compiled from Jourdan et al. (Reference Jourdan, Bertrand, Schärer, Blichert-Toft, Fëraud and Kampunzu2007) and Neumann et al. (Reference Neumann, Svensen, Galerne and Plamke2011), respectively.

6.d. Mechanism of generation of the parent magma
Several models have been proposed for the petrogenesis of Fe-rich rocks including the following: (1) high-degree partial melting of a refractory subducted slab at low pressure (Leybourne, Van Wagoner & Ayres, Reference Leybourne, Van Wagoner and Ayres1999); (2) direct inheritance from a high-Fe mantle source, such as involvement of subducted Fe–Mn nodules (Baker & Krogh Jensen, Reference Baker and Krogh Jensen2004) or mantle plume-related Fe-rich streaks (Kerrich et al. Reference Kerrich, Polat, Wyman and Hollings1999; Gibson, Thompson & Dickin, Reference Gibson, Thompson and Dickin2000); (3) low-degree partial melting of the mantle at high pressure (Hirose & Kushiro, Reference Hirose and Kushiro1993; Lassiter & DePaolo, Reference Lassiter, DePaolo, Mahoney and Coffin1997).
The possibility of formation of the Fe-rich magmas from a refractory subducted slab source at low pressure seems impossible, because of the absence of positive Nb and Ta anomalies in the Shangzhuang parent fine-grained gabbros (Fig. 12d). If Fe-rich magmas were derived from a refractory subducted slab source, positive Nb, Ta and Ti anomalies are expected (Leybourne, Van Wagoner & Ayres, Reference Leybourne, Van Wagoner and Ayres1999). The subsequent injection of subducted Fe–Mn nodules into the mantle is another possible method for Fe enrichment in SCLM (Baker & Krogh Jensen, Reference Baker and Krogh Jensen2004). However, process like this would also lead the magma to be Mn enriched (Ichiyama et al. Reference Ichiyama, Ishiwatari, Hirahara and Shuto2006), which is not in accordance with the low MnO content in the present case (Table 2). The model of direct inheritance from mantle plume-related Fe-rich streaks should be reflected in high positive zircon anomalies ε Hf(t) and (Nb/La)PM (>1, Gibson, Reference Gibson2002), obviously different from the negative zircon ε Hf(t) (Fig. 9; Table 1) and parent-equivalent fine-grained gabbros with (Nb/La)PM less than 0.5 (Table 2) in the present case. Combined with the enriched nature as shown in Figure 15, we exclude this model. The third scenario for the Shangzhuang intrusion is related to low-degree partial melting of the mantle at high pressure. Alternatively, the potential mantle source for high-Fe mafic melts includes eclogite foundered lower crust, and pyroxenite- and lherzolite-rich mantle. Experimental studies of Klemme, Blundy & Wood (Reference Klemme, Blundy and Wood2002) showed that melt derived from the eclogitic lower crust would have low MgO and high SiO2 and Al2O3, CaO/Al2O3 and Ni/MgO (Sobolev et al. Reference Sobolev, Hofmann, Sobolev and Nikogosian2005; Spandler et al. Reference Spandler, Yaxley, Green and Rosenthal2008), which is in contrast to the features of the Shangzhuang rocks, especially with the fine-grained gabbro considered to represent the composition of the early melt. The same also applies to partial melts derived from mantle pyroxenite (without olivine), which would generate magmas with high Ni/MgO (Sobolev et al. Reference Sobolev, Hofmann, Sobolev and Nikogosian2005, Herzberg, Reference Herzberg2006), in contrast to the low Ni/MgO in the Shangzhuang rocks. Also, experimentally simulated partial melts of garnet pyroxenite are far too aluminous to be appropriate for the Shangzhuang intrusion (Hirschmann et al. Reference Hirschmann, Kogiso, Baker and Stolper2003; Kogiso, Hirschmann & Frost, Reference Kogiso, Hirschmann and Frost2003). Thus, the origin of the Shangzhuang intrusion is likely related to lherzolite facies mantle. Peridotite has been considered as the major mantle lithology in Mesozoic time in the NCC (Gao et al. Reference Gao, Rudnick, Yuan, Liu, Liu, Xu, Ling, Ayers, Wang and Wang2004) and has been confirmed by the wide occurrence of Late Jurassic high-Mg andesites, dacites and adakites in the NCC where they exhibit unusual compositions that are interpreted to result from melting of ancient, mafic lower crust which was foundered into the mantle (Rudnick, Reference Rudnick2005) and supported by the identification of peridotite xenoliths (Zheng et al. Reference Zheng, O'Reilly, Griffin, Lu, Zhang and Pearson2001; Rudnick et al. Reference Rudnick, Gao, Ling, Liu and McDonough2004; Ying et al. Reference Ying, Zhang, Kita, Morishita and Shimoda2006; Xiao et al. Reference Xiao, Zhang, Fan, Ying, Zhang, Zhao and Su2010). The co-variation of Zr/Y versus TiO2/Al2O3 (Fig. 16) has been utilized to estimate the pressure or melting degree of partial melting. The trend for the fine-grained gabbro samples from the Shangzhuang intrusion suggests relatively high pressure or a low degree of partial melting when compared to the Abitibi (Kerrich, Polat & Xie, Reference Kerrich, Polat and Xie2008) and Chagangnuoer (Li et al. Reference Li, Niu, Bao, Shan, Yang, Jiang and Zeng2014a) high-Fe-rich basalts, the Zhongtiao Fe-rich mafic sill (Li et al. Reference Li, Niu, Bao, Shan, Yang, Jiang and Zeng2014a), the Ji'nan gabbro (Xie et al. Reference Xie, Zhang, Hou, Santosh, Jin, Han and Cheng2015) and picrites from Iceland (Skovgaard et al. Reference Skovgaard, Storey, Baker, Blusztajn and Hart2001). Their features are similar to that of Fe-rich basalts from Tarim (Jiang et al. Reference Jiang, Jia, Li, Zhang, Lu and Bai2004) and Emeishan (Xu et al. Reference Xu, Mei, Xu, Huang, Wang and Chung2003), although lower than the ranges in Siberian basalts (Arndt, Lehnert & Vasil'ev, Reference Arndt, Lehnert and Vasil'ev1995). Besides, the equivalent fine-grained gabbros in our study exhibit relatively low values of Dy/Yb (3.48–3.55), and are plotted near the phlogopite–spinel lherzolite facies without significant garnet in the source as shown in Figure 17a (Liu et al. Reference Liu, Zhao, Zhu, Niu, Depaolo, Harrison, Mo, Dong, Zhou, Sun, Zhang and Liu2014) and within spinel lherzolite facies in Figure 17b (Zhu et al. Reference Zhu, Guo, Song, Zhang and Gu2009). The rocks display La abundance and La/Sm values higher than those generated by depleted- or primitive-mantle melting. The partial melting trajectory for the Shangzhuang intrusion also implies low partial melting of less than ~5% of an enriched mantle that contains mainly spinel lherzolite (Green, Reference Green2006; Zhu et al. Reference Zhu, Guo, Song, Zhang and Gu2009). The possible mechanism of Ti and Mg enrichment in the parent magma is attributed to the addition of magmas from a deeper-mantle source, which also provided heat and additional Fe to the parent magma.
Plots of Zr/Y v. TiO2/Al2O3 for the Shangzhuang rocks after Ichiyama & Ishiwatari (Reference Ichiyama and Ishiwatari2005). Picrites from Iceland in the middle (Skovgaard et al. Reference Skovgaard, Storey, Baker, Blusztajn and Hart2001), an Fe-rich mafic sill from the Zhongtiao Mountains (Li et al. Reference Li, Niu, Bao, Shan, Yang, Jiang and Zeng2014a), and Fe-rich basalts from Ji'nan gabbro (Xie et al. Reference Xie, Zhang, Hou, Santosh, Jin, Han and Cheng2015), Abitibi (Kerrich, Polat & Xie, Reference Kerrich, Polat and Xie2008), Chagangnuoer (Li et al. Reference Li, Niu, Bao, Shan, Yang, Jiang and Zeng2014a), Tarim (Jiang et al. Reference Jiang, Jia, Li, Zhang, Lu and Bai2004), Emeishan (Xu et al. Reference Xu, Mei, Xu, Huang, Wang and Chung2003) and Siberia (Arndt, Lehnert & Vasil'ev, Reference Arndt, Lehnert and Vasil'ev1995) are shown for comparison.

Plots of (a) Dy/Yb v. La/Yb (after Liu et al. Reference Liu, Zhao, Zhu, Niu, Depaolo, Harrison, Mo, Dong, Zhou, Sun, Zhang and Liu2014) and (b) La v. La/Sm for the Shangzhuang rocks (after Zhu et al. Reference Zhu, Guo, Song, Zhang and Gu2009). In (a), La, Dy and Yb concentrations of primitive mantle, sub-continental lithospheric mantle and lower crust are from Sun & McDonough (Reference Sun, McDonough, Saunders and Nony1989), McDonough (Reference McDonough1990) and Rudnick & Gao (Reference Rudnick, Gao and Rudnick2003), respectively. Curve 1 and curve 2 belong to rutile-bearing eclogitic facies, composed of garnet (64%) + clinopyroxene (35%) + rutile (1%) and garnet (35%) + clinopyroxene (64%) + rutile (1%), respectively, while curve 3 represents phlogopite-spinel lherzolite facies, composed of olivine (70%) + orthopyroxene (15%) + clinopyroxene (9%) + phlogopite (5%) + spinel (1%). In (b), mantle arrays defined by depleted mantle (DM; McKenzie & O'Nions, Reference McKenzie and O'Nions1991), primitive mantle (PM) and E-MORB compositions (Sun & McDonough, Reference Sun, McDonough, Saunders and Nony1989) are shown. Melting curves for spinel lherzolite are composed of olivine (53%) + orthopyroxene (27%) + clinopyroxene (17%) + spinel (3%), while garnet lherzolite is composed of olivine (60%) + orthopyroxene (20%) + clinopyroxene (10%) + garnet (10%) sources, with both DM and E-MORB compositions after Aldanmaz et al. (Reference Aldanmaz, Pearce, Thirlwall and Mitchell2000). Short lines on each melting curve correspond to degrees of partial melting for a given mantle source. Values in brackets denote the mineral percentages in the residue.

As stated in the previous section, the Shangzhuang intrusion shows negligible crustal contamination, reflecting the influence of the magma source region at depth rather than processes in the magma chamber at the site of emplacement. The fine-grained gabbros show enrichment in LILEs (e.g. Rb, K, Th and U) and moderate depletion of HFSEs (e.g. Nb, Ta, Zr and Hf) and HREEs (Fig. 12d), together with depletion of Nb and Ta relative to La (Figs 12d, 18a, b). These features suggest that the magma originated from an enriched SCLM source that had been affected by metasomatism induced by subduction (Wilson, Reference Wilson1989; La Flèche, Camire & Jenner, Reference La Flèche, Camire and Jenner1998; Wang et al. Reference Wang, Fan, Zhang, Guo, Zhang and Peng2004), through the circulation of carbonatitic- or subduction-melts and/or fluids (Elliott et al. Reference Elliott, Plank, Zindler, White and Bourdon1997; Class et al. Reference Class, Miller, Goldstein and Langmuir2000; Kogarko, Kurat & Ntaflos, Reference Kogarko, Kurat and Ntaflos2001; Reubi, Sims & Bourdan, Reference Reubi, Sims and Bourdan2014). Generally, mantle-derived magmas influenced by carbonate metasomatism are ultramafic and show low (Hf/Sm)PM and (Hf/Sm)N values (La Flèche, Camire & Jenner, Reference La Flèche, Camire and Jenner1998; Kogarko, Kurat & Ntaflos, Reference Kogarko, Kurat and Ntaflos2001; Gasparik & Litvin, Reference Gasparik and Litvin2002; Hammouda, Reference Hammouda2003). Rocks from Shangzhuang intrusion exhibit high (Hf/Sm)PM and (Hf/Sm)N values, and therefore their mantle source was unlikely to have been metasomatized by carbonatite (Fig. 18a, b). The negligible influence on the mantle by carbonatite can also be evidenced by the absence of calcite disseminations in the Shangzhung intrusion, unlike some intrusions that have been affected by carbonatite, such as those Alaskan-type ultramafic or mafic intrusions in arc settings with calcite disseminations/a calcium-rich signature (Eyuboglu et al. Reference Eyuboglu, Dilek, Bozkurt, Bektas, Rojay and Sen2010; Deng et al. Reference Deng, Yuan, Zhou, White, Zhang, Guo, Zhang and Zhao2015a; Teng, Yang & Santosh, Reference Teng, Yang and Santosh2015), which is also consistent with their alkaline signature other than calc-alkaline affinity (Fig. 10a, b). In the Th/La versus Ce/Pb diagram (Fig. 18c), these rocks show low Th/La ratios and plot along a trend consistent with what would be expected for slab fluid influence (Temizel et al. Reference Temizel, Arslan, Ruffet and Peucat2012); this is consistent with their behaviour in Figure 18a, b, which shows affinity to fluid-related subduction metasomatism. With the input of large-scale impregnation by fluids, partial melting of the refractory mantle would likely occur. Partial melting of the refractory mantle with a high viscosity hardly occurs, even when heated by a plume (Rudnick et al. Reference Rudnick, Gao, Ling, Liu and McDonough2004). Deviation of the Shangzhuang rocks from melt-related subduction and carbonatite could also attest to the negligible crustal contamination as discussed above.
Co-variation diagrams of (a) (Hf/Sm)PM v. (Ta/La)PM and (b) (Hf/Sm)N v. (Nb/La)N (after La Flèche, Camire & Jenner, Reference La Flèche, Camire and Jenner1998); and (c) Th/La v. Ce/Pb (Temizel et al. Reference Temizel, Arslan, Ruffet and Peucat2012), illustrating that the source region of the Shangzhuang rocks has been influenced by subduction-related fluids.

6.e. Tectonic implications
The geochemical and isotopic features of the Shangzhuang intrusion do not favour arc-related magmatism where prominent imprints of melting of subducted slab should exist. The non-arc affinity of the intrusion is further strengthened by their contrast with subduction zone magmas, which exhibit large Nb–Ta depletions and minor Ti depletions, with strong enrichments in K and Pb, and lesser enrichment of Sr (Fig. 12d), plotting away from typical oceanic and continental arcs (Fig. 15a) with no prominent correlation to arc magmatism (Fig. 19). The features displayed in the present case are comparable with those of many mafic–ultramafic layered intrusions occurring within cratonic domains and correlated to extensional or rift settings (Brooks, Larsen & Nielsen, Reference Brooks, Larsen and Nielsen1991; von Gruenewaldt & Harmer, Reference von Gruenewaldt, Harmer and Condie1992; Seo et al. Reference Seo, Oh, Choi and Rajesh2013; Teng & Santosh, Reference Teng and Santosh2015). The parent magma of the Shangzhuang intrusion was generated through partial melting of a spinel-bearing lherzolite source in the SCLM which had been enriched by metasomatism through prolonged subduction of the Mongolian oceanic slab during Late Palaeozoic time. The culmination of subduction was marked by the final collision between the Mongolian microcontinent and the NCC in Late Permian time along the Solonker–Linxi suture zone (Chen et al. Reference Chen, Jahn, Wilde and Xu2000; Davis et al. Reference Davis, Zheng, Wang, Darby, Zhang, Gehrels, Hendrix and Davis2001; Xiao et al. Reference Xiao, Windley, Hao and Zhai2003; Windley et al. Reference Windley, Alexeiev, Xiao, Kröner and Badarch2007; Teng, Yang & Santosh, Reference Teng, Yang and Santosh2015). However, the contemporaneous subduction of the Pacific Plate beneath provided only a minor contribution to further fertilize the mantle source for the Shangzhuang magma, as shown in Figure 9, where the zircon ε Hf(t) values are distributed within the evolution array of the Mongolian oceanic subduction-induced enriched SCLM (Yang et al. Reference Yang, Wu, Chung, Wilde and Chu2006a; Chen et al. Reference Chen, Tian, Jahn and Chen2008; Teng, Yang & Santosh, Reference Teng, Yang and Santosh2015), without any obvious trend of further enrichment.
Diagram showing variations in (Gd/Yb)PM and (La/Sm)PM values (normalized to primitive mantle (PM) values of McDonough & Sun, Reference McDonough and Sun1995). Increasing (Gd/Yb)PM ratios are indicative of increasing depth of mantle melting, whereas increasing (La/Sm)PM ratios are indicative of decreasing influence of slab-related or crustal components or assimilation of arc-related material.

The emplacement age of the Shangzhuang intrusion is constrained as c. 128 to 123 Ma, coeval with those of other intrusive phases in Xuejiashiliang Complex at ~128.8–123.7 Ma (Su et al. Reference Su, Deng, Zhao, Zhao and Liu2006, Reference Su, Niu, Deng, Liu, Zhao and Zhao2007). Although this age for the Shangzhuang intrusion pre-dates the regional extension related to Yanshanian tectonics that widely occurred at ~118–115 Ma, which has been evidenced by the Hefangkou Fault and contemporary Yunmengshan granodiorite (118–116 Ma) and Daguikou pluton (117±2 Ma) (Davis et al. Reference Davis, Qian, Zheng, Yu, Wang, Tong, Gehrels, Shafiquallah, Fryxell, Yin and Harrison1996a,Reference Davis, Qian, Zheng, Yu, Wang, Tong, Gehrels, Shafiquallah and Fryxellb, Reference Davis, Zheng, Wang, Darby, Zhang, Gehrels, Hendrix and Davis2001), it is spatially consistent with the extensional setting between c. 135 and 115 Ma in the eastern and central NCC related to the Mesozoic lithospheric thinning beneath the craton, as demonstrated by the appearance of A-type granite, dyke swarms and structural features including metamorphic core complexes and extensional basins (Wu et al. Reference Wu, Lin, Wilde, Zhang and Yang2005; Yang et al. Reference Yang, Wu, Chung, Lo, Wilde and Davis2007; Li et al. Reference Li, Zhao, Dai, Liu, Zhou, Santosh and Su2012; Wang et al. Reference Wang, Guo, Zheng, Donskaya, Gladkochub, Zeng, Li, Wang and Mazukabzov2012; Gao, Zhao & Chen, Reference Gao, Zhao and Chen2014). Two prevalent models for the thinning of the lithospheric mantle for the NCC are thermal and/or chemical erosion of lithospheric mantle by continuous heat/materials input from deep-asthenosphere (Zhang et al. Reference Zhang, Sun, Zhou, Zhou, Fan and Zheng2003; Xu et al. Reference Xu, Huang, Ma, Wang, Lizuka, Xu, Wang and Wu2004a; Menzies et al. Reference Menzies, Xu, Zhang and Fan2007), and rapid ‘sink down’ delamination/foundering from the lithospheric mantle due to density increase (Gao et al. Reference Gao, Rudnick, Yuan, Liu, Liu, Xu, Ling, Ayers, Wang and Wang2004; Yang et al. Reference Yang, Wu, Chung, Wilde, Chu, Lo and Song2005; Ling et al. Reference Ling, Duan, Xie, Zhang, Zhang, Cheng, Liu and Yang2009). In general, delamination/foundering would cause large quantities of basaltic underplating and magma ponding at the base of the crust, some of which might erupt into the surface of the crust (Deng et al. Reference Deng, Su, Niu, Liu, Zhao, Zhao, Zhou and Wu2007). Zhang et al. (Reference Zhang, Zhao, Kröner, Liu, Xie and Chen2009b) considered that the initiation of lithospheric thinning of the NCC might date back to Early–Late Triassic time along the northern margin of the NCC, and evolved into the interior domain gradually. Gao et al. (Reference Gao, Rudnick, Yuan, Liu, Liu, Xu, Ling, Ayers, Wang and Wang2004) considered that the large-scale lithospheric removal related to delamination/foundering started at ~160 Ma, as evidenced by the wide occurrence of Late Jurassic high-Mg andesites, dacites and adakites in the NCC (Rudnick, Reference Rudnick2005). Since the emplacement of the Shangzhuang intrusion was related to the intra-continental extension in the eastern and central NCC during c. 135 and 115 Ma, with only sparse exposures of basaltic rocks and high-Mg andesites, dacites and adakites in the nearby area, we consider that the thermal and/or chemical erosion model is more plausible (Rudnick, Reference Rudnick2005; Deng et al. Reference Deng, Su, Niu, Liu, Zhao, Zhao, Zhou and Wu2007).
The nature of lithospheric mantle domains beneath the NCC has been well addressed through Sr–Nd–Pb isotope geochemical data from the mantle-derived volcanic rocks, mafic intrusive rocks and mantle xenoliths (Zhang et al. Reference Zhang, Sun, Zhou, Zhou, Fan and Zheng2003, Reference Zhang, Sun, Zhou, Fan, Zhou and Zhai2004; Xu et al. Reference Xu, Huang, Ma, Wang, Lizuka, Xu, Wang and Wu2004b; Zheng et al. Reference Zheng, Sun, Zhou and Robinson2005; Huang, Zhong & Xu, Reference Huang, Zhong and Xu2012). For the lithospheric mantle beneath the eastern NCC, an EMI-like domain and EMII-like domain are distinguished along the boundary, which lies about ~80 km west of Tan-Lu fault (Xu et al. Reference Xu, Huang, Ma, Wang, Lizuka, Xu, Wang and Wu2004b), with the western part dominantly EMI-like. This has been correlated to the subduction of either pelagic sediments or sub-continental lithosphere, whereas the eastern part is dominantly EMII-like, and considered to represent subducted continental sediments (Hart et al. Reference Hart, Hauri, Oschmann and Whitehead1992; Hofmann, Reference Hofmann1997) or incorporation of recycled oceanic lithosphere into the SCLM with trapped melt fractions (Workman et al. Reference Workman, Hart, Blusztajn, Jackson, Kurz and Staudigel2003). The Shangzhuang rocks show a non-arc signature, and recycled components played little contribution as shown in Figure 19, which is different from the EMII-like domain. Thus, the origin for the Shangzhuang rocks is more likely correlated to the EMI-like enriched mantle. However, these rocks exhibit a geochemical signature that is more complex and different from magmas derived from a typical EMI-like source, such as the Zr/Nb, Zr/Y and Nb/Y values for the fine-grained gabbros ranging from 8.03–9.09, 13.0–15.1 and 1.62–1.66, whereas typical EMI-like mantle has a very low Zr/Nb ratio (~5) and high Zr/Y (~12) and Nb/Y (~3) ratios (Condie, Reference Condie2005). We, therefore, infer that a deep-mantle source such as the asthenosphere or mantle plume also played a role in the mixing of the parent magma. The emplacement age of the Shangzhuang intrusion corresponds well with the intra-continental extensional setting in the eastern and central NCC. The heat induced by asthenospheric mantle upwelling under intra-continental extension (Menzies, Fan & Zhang, Reference Menzies, Fan, Zhang, Prichard, Alabaster, Harris and Neary1993; Fan et al. Reference Fan, Zhang, Baker, Jarvis, Mason and Menzies2000), and addition of the water derived from the ongoing subducting Pacific Plate could together reduce the solidus of the SCLM and the viscosity contrast between the lithospheric mantle and the asthenosphere, thus leading to thermal and/or chemical erosion of the SCLM which had been fertilized by the subduction process of the Mongolian oceanic slab during Late Palaeozoic time. This process is similar to a plume impinging on lithosphere but with a limited extent (Davies & von Blanckenburg, Reference Davies and von Blanckenburg1995), and with an ephemeral thermal anomaly (van de Zedde & Wortel, Reference van de Zedde and Wortel2001) of limited extent. This could be a good interpretation for the extra enrichment in Fe, Ti and Mg in the Shangzhuang intrusion, but without the extensive depletion if large mantle plume events occurred.
7. Conclusions
(1) The Shangzhuang layered mafic intrusion was emplaced during Early Cretaceous time with its age constrained as c. 128–123 Ma. The timing of emplacement correlates with the major extensional setting between c. 135 and 115 Ma in the eastern and central NCC related to the Mesozoic lithospheric thinning.
(2) The parent magma for the Shangzhuang mafic layered intrusion was likely enriched in Fe, Ti and Mg, generated through a low (less than ~5%) degree of partial melting of a spinel lherzolite source in the lithospheric mantle beneath the NCC. The geochemical and zircon Lu–Hf isotopic data suggest that the source of the Shangzhuang intrusion had been enriched by crust–mantle interaction and metasomatic fluids and melts derived from the Late Palaeozoic Mongolian oceanic subduction beneath the northern NCC. These were locally mixed with limited asthenospheric or deeper-mantle materials by mantle upwelling under the intra-continental extension related to the Mesozoic lithospheric thinning in the eastern and central NCC.
(3) The formation of the layered sequence is ascribed to crystal sorting and accumulation, followed by differentiation through density contrast and continuous re-equilibration.
(4) The tectonic setting for the formation of the Shangzhuang parent magma was considered to be intra-continental extensional that triggered mantle upwelling to provide heat/materials, leading to thermal–chemical erosion of the lithospheric mantle.
Acknowledgements
We thank the Editor Dr Chad Deering and two anonymous reviewers for constructive comments. This work forms part of the Ph.D. research of Xue-Ming Teng at the China University of Geosciences Beijing. Funding for this study was provided through the Talent Award project to M. Santosh through the 1000 Talents Plan of the Chinese Government. We are grateful to our colleagues Ms Xiao-Fang He and Ms Shan-Shan Li for their various help with the field investigation and the indoor experimental work.
Supplementary material
To view supplementary material for this article, please visit https://doi.org/10.1017/S0016756817000371