


INTRODUCTION
Environmental impacts have become a major issue for animal production, especially for meat production. Among the impacts, greenhouse gas (GHG) emissions are now considered as the main concern due to the dramatic consequences for climate change (Thomas et al. Reference Thomas, Scollan and Moran2010). However, other impacts such as energy demand, eutrophication, acidification and impacts associated with land use are of major importance, depending on the country (Steinfeld et al. Reference Steinfeld, Mooney, Schneider and Neville2010). At the same time, meat consumption is expected to increase in the world in the future, due to demographic pressure and economic growth. This affects mainly pork and poultry, but beef is expected to increase too (FAO 2009). Therefore, it is important to reduce the environmental impacts related to the beef sector. Although more than 0·70 of environmental impacts of beef production systems, when expressed by kg of product, arise from the cow–calf phase (Pelletier et al. Reference Pelletier, Pirog and Rasmussen2010; Nguyen et al. Reference Nguyen, Van Der Werf, Eugene, Veysset, Devun, Chesneau and Doreau2012), it is important to investigate strategies for decreasing impacts during the fattening phase. For example, in France, beef farms specialize in either the suckler cow–calf phase based on forage feeding or in the fattening phase based on diets with higher amounts of concentrates. Farms specialized in fattening require mitigation strategies to decrease emissions of pollutants. Although very little information is available in the literature about the effect of the type of diet on environmental impacts, it is hypothesized that the choice of feeding system may modulate the extent of air and water pollution, of resource consumption and of land occupation. The current study aims to assess environmental impacts by life cycle assessment (LCA) in three contrasting systems representative of different feeding systems of bull-fattening in France. The impact of these finishing systems on GHG emissions have been described in Doreau et al. (Reference Doreau, Van Der Werf, Micol, Dubroeucq, Agabriel, Rochette and Martin2011). Large differences between feeding systems have been shown. The current paper analyses the implications for eutrophication, acidification, cumulative energy demand and land occupation, per kg of product and per ha of surface.
MATERIALS AND METHODS
System characteristics
The three systems correspond to typical French bull-fattening farms and differ in the nature of the forage consumed and the proportion of concentrate in fattening diets, and by the region of France where these systems are most likely to be found. On a dry matter (DM) basis, diet H consisted of 0·49 natural grassland hay, 0·41 ground maize grain and 0·10 soybean meal; diet MS consisted of 0·63 maize silage, 0·21 ground maize grain, 0·16 soybean meal; diet C consisted of 0·70 ground maize grain, 0·16 soybean meal and 0·14 wheat straw. Diets H, MS and C were representative of diets fed to finishing bulls in the Centre of France (Auvergne), the North West of France (Brittany) and the South West of France (Aquitaine), respectively. The fattening period occur over 175, 147 and 131 days for H, MS and C, respectively. The main features of the three bull fattening processes were determined during a feeding trial and are reported in Table 1. The boundaries of the fattening systems were limited to the production and delivery of the components of the diets (natural grassland hay, maize silage, wheat straw, maize grain and soybean meal), the production and delivery of inputs used to produce these components (e.g. seed, diesel, tractors and fertilizers), associated upstream processes and emissions from manure management. The application of the manure for the production of these components was included. Buildings and veterinary medicines were not included because of lack of data. The transport and slaughter of animals leaving the system were also not included.
Performances of fattened animals in three bull-fattening systems
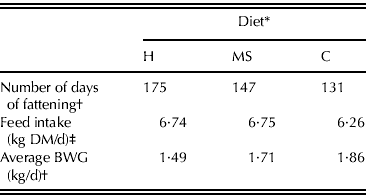
* Diet H = 0·49 natural grassland hay + 0·41 maize grain + 0·10 soybean meal; Diet MS = 0·63 maize silage + 0·21 maize grain + 0·16 soybean meal; Diet C = 0·14 wheat straw + 0·70 maize grain + 0·16 soybean meal.
Emissions from feed production and animals
Grassland practices for hay production were based on data provided by the French extension service (Institut de l'Elevage 2008). The crop production inputs and management practices used were based on French government statistics (AGRESTE 2006); yield levels were the averages for 2004–7. Slurry produced by bulls in the fattening system was stored without natural crust cover and its emissions in housing and in storage were considered to be part of the animal production system and accounted for. After storage, resource use and emissions associated with the transport and application of this slurry, and of organic fertilizer in general, were considered to be part of the crop production system. Maize grain and maize silage grown in Brittany were mainly fertilized with pig slurry, while maize grain and wheat in other regions received mainly mineral fertilizer. Estimations of nitrate-N emitted from crop production was based on Basset-Mens et al. (Reference Basset-Mens, Van Der Werf, Robin, Morvan, Hassouna, Paillat and Vertès2007), considering the nature of the crop and the duration of the subsequent period without the presence of a crop. For grassland production, nitrate-N emitted was based on Vertès et al. (Reference Vertès, Simon, Le Corre and Decau1997), considering the management practices and harvest methods. Data for fertilizer use, yield level and nitrate-N emitted of feed ingredients are summarized in Table 2. Data concerning resource use and emissions associated with the production and delivery of several inputs for crop production (fertilizers, pesticides, tractor fuel and agricultural machinery) were from Nemecek & Kägi (Reference Nemecek and Kägi2007). Equations and emission factors used to calculate field-level emissions from crop and forage production and from slurry produced by bulls are presented in Table 3. It was assumed that soybean was produced in Brazil, since 0·60 of soybean meal imported in France comes from Brazil (ISTA 2009). Impacts associated with soybean production, including CO2 emission associated with land use change from forest to soybean, were estimated according to Prudêncio da Silva et al. (Reference Prudêncio Da Silva, Van Der Werf, Spies and Soares2010) and represent the average Brazilian production, i.e. both traditional production areas and recently deforested areas.
Fertilizer use, yield level and nitrate-N emitted (per ha) for the major crops serving as feed-ingredients for bull-fattening diets

* Diet H = 0·49 natural grassland hay + 0·41 maize grain + 0·10 soybean meal.
† Diet C = 0·14 wheat straw + 0·70 maize grain + 0·16 soybean meal.
‡ Diet MS = 0·63 maize silage + 0·21 maize grain + 0·16 soybean meal.
Published values for emissions sources, equations or emission factors used

For the processes of transformation of crop products into feed ingredients, data were based on Nguyen et al. (2011) for drying of maize, and Nemecek & Kägi (Reference Nemecek and Kägi2007) and Jungbluth et al. (Reference Jungbluth, Faist Emmenegger, Dinkel, Stettler, Doka, Chudacoff, Duriat, Gnansounou, Sutter, Spielmann, Kljun and Keller2007) for the production of soybean meal. Soybean transformation yields two co-products: meal and oil. Resource use and emissions for these products were allocated according to the economic value of the products and were calculated using extraction rates (the proportion of processed products obtained from the parent product) and costs. Extraction rates were taken from FAO (2002) and costs were averages for 2004–7 from ISTA (2009).
For diet H, hay is produced on farm, maize grain is transported over 70 km by truck and soybean meal is transported by truck from sea port of Bordeaux (510 km). For diet MS, maize silage is produced on farm, maize grain is transported over 80 km by truck and soybean meal is transported by truck from Brest (110 km). For diet C, both straw and maize grains are transported by truck over 50 and 10 km, respectively; soybean meal is transported by truck from Bordeaux (310 km).
Environmental impact assessment
Environmental impacts associated with the three diets were evaluated using an LCA model, inputs and outputs being interpreted in terms of environmental impacts. The impact categories considered were cumulative energy demand, eutrophication, acidification and land occupation. The indicator result for each impact category was determined by multiplying the aggregated resources used and the aggregated emissions of each individual substance with a characterization factor for each impact category to which it may potentially contribute. Characterization factors were substance-specific, quantitative representations of the additional environmental pressure per unit emission of a substance. Cumulative energy demand was calculated according to Frischknecht et al. (Reference Frischknecht, Jungbluth, Althaus, Bauer, Doka, Dones, Hischier, Hellweg, Humbert, Köllner, Loerincik, Margni and Nemecek2007) and took into account the renewable and non-renewable resources by using the conversion efficiencies of primary energy carriers. Eutrophication covered all potential impacts of high environmental levels of macronutrients, in particular N and P. Eutrophication potential (EP) was calculated using the generic EP factors in kg PO4 equivalent (equiv.), viz., NH3: 0·35, NO3: 0·1, NO2: 0·13, NO x : 0·13, PO4: 1 (Guinée et al. Reference Guinée, Gorrée, Heijungs, Huppes, Kleijn, De Koning, Van Oers, Sleeswijk, Suh, De Haes, De Bruijn, Van Duin and Huijbregts2002). Acidifying pollutants had a wide variety of impacts on soil, groundwater, surface water, biological organisms, ecosystems and materials (buildings). Acidification potential (AP) was calculated using the average European AP factors in kg SO2 equiv., viz., NH3: 1·6, NO2: 0·5, NO x : 0·5, SO2: 1·2 (Guinée et al. Reference Guinée, Gorrée, Heijungs, Huppes, Kleijn, De Koning, Van Oers, Sleeswijk, Suh, De Haes, De Bruijn, Van Duin and Huijbregts2002). Land occupation referred to the loss of land as a resource in the sense of being temporarily unavailable for other purposes due to crop and paddocks. Land occupation is a surface multiplied by the proportion of time of use in the year, expressed as m2 × yr. Environmental impacts have been expressed per kg of body weight gain (BWG) obtained in the fattening period and per ha of land occupied.
RESULTS
The environmental impacts of maize silage for diet MS (per kg of DM) delivered at farm were lower than the impacts of maize grain for all diets, except for AP of maize grain H (Table 4), principally due to higher DM yield/ha of maize silage. Cumulative energy demand/kg DM of maize grain for diet MS was lower than those of maize grain for diet H and C; the opposite was true for AP and land occupation. There were small differences for cumulative energy demand and AP between soybean meal for H, MS and C due to the difference in transportation distances in France.
Cumulative energy demand/kg of BWG was the lowest for diet MS and the highest for diet C (18·7, 13·0 and 19·7 MJ equiv./kg of BWG for H, MS and C, respectively) (Fig. 1). Crop production was the largest consumer of energy (accounting for 0·62, 0·44 and 0·62 of the totals for H, MS and C, respectively), followed by transportation (0·15, 0·24 and 0·14 for H, MS and C, respectively) and grain drying (0·13, 0·14 and 0·12 for H, MS and C, respectively). Road transport was the main means of transportation used (0·70, 0·62 and 0·64 of cases for H, MS and C, respectively), followed by sea transport (0·25, 0·32 and 0·30 for H, MS and C, respectively). Rail transport used partly for soybean transportation in Brazil only accounted for 0·04–0·06. Impacts related to deforestation contributed for 0·04–0·08 to cumulative energy demand per kg of BWG.
Environmental impacts per kg of feed ingredient (on DM basis) delivered at the bull-fattening farm
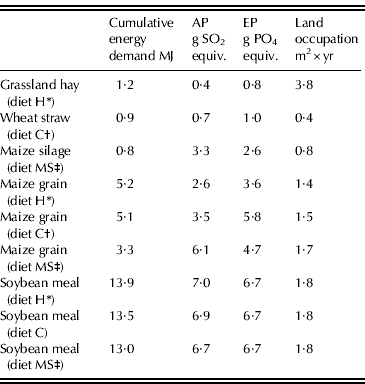
* Diet H = 0·49 natural grassland hay + 0·41 maize grain + 0·10 soybean meal.
† Diet C = 0·14 wheat straw + 0·70 maize grain + 0·16 soybean meal.
‡ Diet MS = 0·63 maize silage + 0·21 maize grain + 0·16 soybean meal.
Contribution of crop production, grain drying, feed ingredient processing, transportation and deforestation to cumulative energy demand for fattening systems based on hay (diet H*), maize silage (diet MS†) or concentrate (diet C‡), expressed per kg BWG. *Diet H = 0·49 natural grassland hay + 0·41 maize grain + 0·10 soybean meal. †Diet MS = 0·63 maize silage + 0·21 maize grain + 0·16 soybean meal. ‡Diet C = 0·14 wheat straw + 0·70 maize grain + 0·16 soybean meal.

AP per kg of BWG was the highest for diet MS and the lowest for diet C (31·3, 38·1 and 29·4 g SO2 equiv./kg of BWG for H, MS and C, respectively) (Fig. 2). Ammonia from manure management was the primary contributor for AP (accounting for 0·72, 0·54 and 0·58 for H, MS and C, respectively), followed by ammonia from feed crop production (0·11, 0·33 and 0·21 for H, MS and C, respectively). Ammonia emissions from crops grown for feed for diet MS, which were twice as high as those for diet C and four times as high as those for diet H, were principally related to the application of pig slurry. Sulphur dioxide emissions accounted for 0·10, 0·07 and 0·13 of the AP of H, MS and C, respectively. The smallest contributor to AP was nitrogen oxide emissions.
Contribution of emitted substances from feed production and manure management to AP (A) and EP (B) arising from fattening systems based on hay (diet H*), maize silage (diet MS†) or concentrate (diet C‡), expressed per kg BWG. *Diet H = 0·49 natural grassland hay + 0·41 maize grain + 0·10 soybean meal. †Diet MS = 0·63 maize silage + 0·21 maize grain + 0·16 soybean meal. ‡Diet C = 0·14 wheat straw + 0·70 maize grain + 0·16 soybean meal.

EP per kg of BWG was the highest for diet C and the lowest for diet H (16·5, 19·0 and 21·5 g PO4 equiv./kg of BWG for H, MS and C, respectively) (Fig. 2). Nitrate emissions from feed crop production were the largest contributor to EP (accounting for 0·36, 0·40 and 0·54 for H, MS and C, respectively), followed by ammonia emissions from manure (0·30, 0·24 and 0·17 for H, MS and C, respectively) and phosphate emissions from feed crops (0·25, 0·19 and 0·19 for H, MS and C, respectively). The smallest contributor to EP was nitrogen oxide emissions. Nitrate emissions from feed crops for diet C were 56% and 95% higher than those for diet MS and H, respectively.
Land occupation per kg of BWG was the highest for diet H (11·7 m2 × yr), which was 2·5 times higher that for diet MS (4·5 m2 × yr) and diet C (4·6 m2 × yr). For diet H, grassland contributed 0·71 to land occupation. For diet MS and diet C, all land occupation was cropland. As a result, the impacts expressed per ha of land occupied were 1·8–3·3 times lower for diet H than for diets MS and C (Table 5). Per ha of land occupied, acidification was the highest for diet MS, eutrophication and cumulative energy demand were the highest for diet C.
Cumulative energy demand, AP, EP arising from fattening systems based on hay (H), maize silage (MS) or concentrate (C), expressed per ha of land occupied
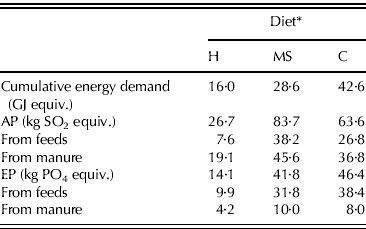
* Diet H = 0·49 natural grassland hay + 0·41 maize grain + 0·10 soybean meal; Diet MS = 0·63 maize silage + 0·21 maize grain + 0·16 soybean meal; Diet C = 0·14 wheat straw + 0·70 maize grain + 0·16 soybean meal.
DISCUSSION
Differences among diets for environmental criteria
The three diets which have been studied are very different. Diet C is a feedlot diet that does not require forage production, compared to the other two diets. They also differ in BWG, which is the highest for diet C and the lowest for diet H. With these diets, the climate change impact per kg of BWG was 3·65, 4·56 and 4·74 kg CO2 equiv. for diets C, H and MS, respectively, when taking into account C sequestration by soils (Doreau et al. Reference Doreau, Van Der Werf, Micol, Dubroeucq, Agabriel, Rochette and Martin2011). Differences between diets are not ranked similarly for impacts studied in the current paper. The lowest energy demand/kg of BWG with diet MS was due to the lower energy demand for feed production. This is principally related to the higher DM yield for maize silage, as the whole plant is harvested. Although maize silage has a lower digestible energy/kg DM than maize grain, maize silage yielded higher digestible energy/ha than maize grain. Secondly, energy demand/ha of maize silage and maize grain produced in Brittany was lower than that of maize produced in other regions, as maize in Brittany is mainly fertilized with pig slurry. In the present study, the highest energy demand per kg of BWG for diet C was due to its high energy demand for crop-based feed production, although animals had the highest average BWG. The high energy demand per kg BWG for diet H was due to its low average BWG. These results confirm the important contribution of the crop production stage to the total energy demand for cattle fattening, as shown by Ogino et al. (Reference Ogino, Kaku, Osada and Shimada2004) and Pelletier et al. (Reference Pelletier, Pirog and Rasmussen2010). The contribution of feed transport to the farm was principally related to the transport of soybean meal, especially due to road transport in Brazil (Prudêncio da Silva et al. Reference Prudêncio Da Silva, Van Der Werf, Spies and Soares2010) rather than to sea transport from Brazil to France, or even road transport in France.
In the current study, AP was mainly due to ammonia from manure (0·54–0·72) and EP was mainly due to feed production (0·70–0·83). This is in agreement with Ogino et al. (Reference Ogino, Kaku, Osada and Shimada2004) for AP and with Pelletier et al. (Reference Pelletier, Pirog and Rasmussen2010) for EP. As discussed by Nguyen et al. (Reference Nguyen, Hermansen and Mogensen2010), it is not clear whether phosphate and nitrate emissions from feed production were taken into account for EP in Ogino et al. (Reference Ogino, Kaku, Osada and Shimada2004). The highest AP/kg of BWG for diet MS can be explained by the use of pig slurry for maize grain and maize silage in Brittany, causing high ammonia emissions. The highest ammonia emission from manure management for diet H resulted from the lowest BWG of animals in this system. This was the opposite of diet C, for which AP was the lowest, even if contribution of ammonia from feed was higher for diet C than for diet H. The highest EP for diet C can be explained by the highest nitrate emission from feed, principally from maize grain production. In Aquitaine, maize grain production is a monoculture (AGRESTE 2006), i.e. maize is followed by maize, and as a result, there is a high risk of nitrate leaching (Basset-Mens et al. Reference Basset-Mens, Van Der Werf, Robin, Morvan, Hassouna, Paillat and Vertès2007). Diet H resulted in the lowest EP, even with the lowest BWG, because of the low ammonia and nitrate emissions from hay production.
Pelletier et al. (Reference Pelletier, Pirog and Rasmussen2010) found lower energy use and EP/kg BWG for a feedlot system rather than for a system where a period of grazing high-quality forage occurred before fattening. In the same way, Nguyen et al. (Reference Nguyen, Hermansen and Mogensen2010) found higher energy use, EP and AP/kg carcass weight for steers fed large amount of forages than for bulls fed a concentrate-based diet, but this effect is mainly due to the difference in fattening duration. The amount of fertilizers and other inputs may have differed between these studies; however, the major cause of the difference between these studies is the large difference in BWG between the feeding systems in Pelletier et al. (Reference Pelletier, Pirog and Rasmussen2010) and Nguyen et al. (Reference Nguyen, Hermansen and Mogensen2010), whereas the difference is lower in the current trial.
The three diets differed in the area of land used for production. A large area cultivated/kg of product is often considered detrimental, owing to the competition for land between grassland and crops dedicated to human food or biofuels. However, in Europe, hay-based diets for bull-fattening are used mainly in semi-mountain or mountain areas, and in this case grasslands may be in competition only with forest, which stores more carbon than grasslands but does not contribute to human food. More generally, pastures that occupy 0·26 of ice-free terrestrial surface of the planet often do not compete with crops for food and biofuels (FAO 2009), as soils or climate do not allow annual cropping.
Differences according to the method of calculation of impacts
Environmental impacts are calculated per kg of product (BWG, yielding meat in the present case), or per ha. Published data often consider only one of these expressions, depending on the priority: reducing the impact per kg of product or reducing the pollution for a limited territory. In the first case, the driver is meeting the present or future global demand. This allows the comparison of the efficiency of systems in a globalized world, and this is especially important when providing food for 9 billion people in 2050 is an objective. In the second case, the driver is reduction of pollution. Thus, there is a need for a land-based measurement. Most available data deal with the impact on climate change and show minor differences per kg of milk according to the production system (review by Martin et al. Reference Martin, Morgavi and Doreau2010). Few data have compared the two modes of expression for impacts other than climate change, especially for meat production; most comparisons deal with milk production. In four different countries (Sweden, Germany, the Netherlands and France), Cederberg & Mattson (Reference Cederberg and Mattsson2000), Haas et al. (Reference Haas, Wetterich and Köpke2001), De Boer (Reference De Boer2003) and van der Werf et al. (Reference Van Der Werf, Kanyarushoki and Corson2009) showed that differences in EP and AP between conventional and organic dairy systems were small when impacts were expressed per kg milk, whereas impacts were much larger for conventional systems than for organic systems when they were expressed per ha. The same conclusion is drawn by Veysset et al. (Reference Veysset, Lherm and Bebin2011) for energy consumption in conventional and organic beef systems, whereas there are few differences in energy consumption per ha among conventional beef systems (Veysset et al. Reference Veysset, Lherm and Bebin2010). The extent of differences between conventional and organic systems probably depends on differences in stocking rates and off-farm surfaces.
In the current study, when results are expressed per ha, diet H showed lower potential impacts on eutrophication, acidification and cumulative energy demand than the other two diets, due to its higher land occupation. A similar conclusion had previously been drawn for climate change (Doreau et al. Reference Doreau, Van Der Werf, Micol, Dubroeucq, Agabriel, Rochette and Martin2011). It is thus unlikely that, with the H diet, local impacts as eutrophication reach levels that cause actual environmental damage, especially when this diet is practised in a semi-mountain area with a moderate livestock density.
CONCLUSIONS
The current analysis shows that the type of diet for fattening bulls strongly affects the bulls’ environmental impacts. When impacts are expressed per kg of BWG, differences between diets may reach 0·25–0·35 according to the impact considered. It is not possible to define the ‘best’ diet, because the ranking between diets is not the same according to the impact category. Impacts can also be considered per surface unit. In this case the diet based on hay results in much lower impacts because it requires a larger area for the same production. The impact on climate change also depends whether carbon storage in soils is considered. It is concluded that stakeholders and policy makers need to integrate the different environmental issues, and that decisions that will be taken should depend on the priority, maintaining animal production or reducing the pollution on a given territory.



