Fatty acids (FA), one of the major classes of circulating lipids, play an important role in human physiological processes(Reference Jerab, Blangero and Da Costa1,Reference Gutiérrez, Svahn and Johansson2) (including glucose and lipid metabolism, and inflammation) typically related to the risk of metabolic disorders and premature deaths(Reference Rodriguez, Lavie and Elagizi3). Circulating FA could represent the combined effect of dietary intake and endogenous metabolism(Reference Schooling, Kwok and Zhao4) and thus serve as reliable biomarkers to estimate population-level FA exposure(Reference Masoodi, Gastaldelli and Hyötyläinen5). To date, numerous epidemiological studies have demonstrated the associations between circulating FA level and risk for mortality in the general populations(Reference O’Keefe, O’Keefe and Tintle6–Reference Liu, Ao and Li9), for example, higher levels of n-6 PUFA (n-6), particularly linoleic acid (LA), associated with a modestly lower risk of mortality from all causes, CVD and cancer. However, the effect modifiers underlying these associations remain unclear. Understanding the potential heterogeneity in associations between FA and mortality would be necessary to identify individuals’ susceptibility to health benefits or risks of FA.
Large-scale gene–FA interaction studies have revealed insights into genetic variants modifying the effect of circulating FA on the risk of mortality. Adding SFA on top of the habitual diet was associated with an increased risk of mortality in men with the CT/CC FADS1 rs174550 genotype(Reference Fridén, Olsson and Lind10). The associations of circulating n-3 PUFA with sudden cardiac arrest risk may be more pronounced in carriers of the PLA2G2A rs4654990 G allele(Reference Lemaitre, Bartz and King11). Meanwhile, recently emerging evidence suggested that the relation between FA and human health is likely to be influenced by many behaviours(Reference Reger, Hoyt and Nan12,Reference Gao, Li and Chen13) , such as smoking and alcohol consumption(Reference Simon, Fong and Bemert14). However, using genetic variants or lifestyle factors cannot fully capture the physiological differences in associations between FA and health outcomes. Unlike genetic variation, which is largely static, the circulating proteome (such as apolipoproteins and carrier proteins) reflects dynamic biological processes in response to environmental stimuli(Reference Larrea-Sebal, Dai and Brenes15,Reference Jiao, Gao and Zhao16) , encompassing key functions such as transport, metabolic regulation, coagulation and immune responses, and capturing the combined influence of genetic and non-genetic factors(Reference Caron, Patin and Rotival17). Thus, it provides us with a better understanding of heterogeneity between FA and mortality. Recently, the large-scale proteomics data released by UK Biobank (UKBB) offered us an opportunity to further investigate interaction between proteomics and FA(Reference Sun, Chiou and Traylor18). Proteome-wide interaction analyses for FA may shed light on differences in associations of FA with mortality across people with varied physiological status and provided potential evidence for further identifying subpopulations who were more sensitive to health effects of FA.
Utilising data from UKBB prospective cohort study, we conducted analyses to better understand the effect modifications of proteins on associations between FA and all-cause mortality. The aim of this study is (1) to identify the effect-modifying role of proteins on the relationship between FA and all-cause mortality and (2) to explore whether associations between FA and all-cause mortality vary across different levels of specific protein, thereby identifying high-risk groups for targeted prevention.
Methods
Study population
We performed a prospective cohort study based on individual-level data from the UKBB, a multisite biomedical database of 502 413 participants aged 40–69 years enrolled between 2006 and 2010 from 22 recruitment centres throughout the UK(Reference Sudlow, Gallacher and Allen19). Participants completed anthropometric measurements and questionnaires linked to sociodemographic characteristics, lifestyles and health-related conditions at baseline and the death and hospitalisation register. Informed consent was obtained from all individual participants. Participants were excluded from the analysis if they were lost to follow-up assessments or withdrew consent(Reference Drozd, Pujades-Rodriguez and Lillie20). The blood samples obtained at the baseline visit were processed for quantification of metabolomics and proteomic profiling(Reference Sun, Chiou and Traylor18,Reference Carrasco-Zanini, Pietzner and Davitte21) .
Metabolomics measurement
Metabolomics (249 biomarkers, including 168 readouts and 81 ratios) from EDTA plasma and serum samples of approximately 250 000 participants were measured between June 2019 and April 2020 through nuclear magnetic resonance technique(Reference Soininen, Kangas and Würtz22,Reference Würtz, Kangas and Soininen23) . This method provides simultaneous quantification of routine lipids, lipoprotein subclass profiling with lipid concentrations within 14 subclasses, FA composition and various low-molecular metabolites, including amino acids, ketone bodies and gluconeogenesis-related metabolites, in molar concentration units. Details of the measurements of metabolomics can be seen elsewhere(Reference Julkunen, Cichońska and Tiainen24). We selected FA categories in the current study including n-3 fatty acids to total fatty acids percentage (n-3-pct), n-6 fatty acids to total fatty acids percentage (n-6-pct), n-6 fatty acids to n-3 fatty acids ratio (n-6/n-3 ratio), PUFA to total fatty acids percentage (PUFA-pct), MUFA to total fatty acids percentage (MUFA-pct), SFA to total fatty acids percentage (SFA-pct), LA to total fatty acids percentage (LA-pct), non-LA n-6 to total fatty acids percentage (non-LA n-6 pct) and docosahexaenoic acid to total fatty acids percentage (DHA-pct) based on previous research(Reference Harris, Tintle and Imamura7). Non-LA n-6 pct was computed as total n-6-pct minus LA-pct.
Proteomics profiling
The Olink platform has measured 2923 unique proteins for 54 219 participants. The measurements included panels from cardiometabolic, inflammation, neurology and oncology pathways. Normalised protein expression levels represent relative protein abundances that have been transformed and corrected, providing refined metrics for analytical applications. Detailed information on the Olink assay, protein measurements, processing and quality control details is provided in previously published articles(Reference Sun, Chiou and Traylor18,Reference Zhong, Edfors and Gummesson25) .
Covariates assessment
We included sociodemographic factors, physical measurements and lifestyle factors relevant to mortality as potential covariates based on the previous literature and biological rationality in our analyses(Reference Puka, Buckley and Mulia26–Reference Di Angelantonio and Bhupathiraju31). Covariates were extracted from demographic, lifestyle and physical examination data and included in the model for adjustment including age (continuous), sex (male or female), ethnicity (white or non-white), smoking status (non-smoker, ex-smoker or current-smoker), alcohol intake (never, lower than three times a month or over once a week), BMI was calculated as weight (kg)/(height (m))2, education attainment (College or University degree, A levels/AS levels or equivalent, O levels/GCSE or equivalent, CSE or equivalent, NVQ/HND/HNC or equivalent, other professional qualifications and none of the above), household income before tax (less than £18 000, £18 000 to £30 999, £31 000 to 51 999, £52 000 to £100 000, greater than £100 000), Townsend deprivation index (continuous, higher score represents worse socioeconomic status) and C-reactive protein (continuous). The healthy diet score was constructed on the basis of the following factors: vegetable intake (cooked and raw combined) ≥ 4 tablespoons/day; fruit intake (fresh and dried combined) ≥ 3 pieces/day; fish intake (oily and non‑oily combined) ≥ 2 times/week; unprocessed red meat intake ≤ 2 times/week; and processed meat intake ≤ 2 times/week(Reference Tao, Liu and Fan32). For each component, 1 point was assigned if the recommended intake was met and 0 otherwise. The total score was calculated as the sum of the component scores, ranging from 0 to 5. Baseline chronic diseases were ascertained using self-reported medical history, medication use, physical measurements, biological samples and linked health-related records (Data Category 1712 in UKBB). CVD was defined as self-reported history of heart attack, angina or stroke, or use of antihypertensive or antianginal medication at baseline(Reference Cho, Koyama and Ruan33,Reference Zhang, Qian and Chen34) . Cancer was defined as a self-reported cancer(Reference Ong, An and Law35). Hypertension was defined as having a systolic blood pressure ≥ 140 mmHg and/or diastolic blood pressure ≥ 90 mmHg, self-reported hypertension history or use of antihypertensive medication(Reference Zhang, Qian and Chen34,Reference Zhu, Chen and Kuang36) . Hyperlipidaemia was defined as any of the following: self-reported diagnosis, use of lipid-lowering medication, total cholesterol > 4·0 mmol/L, LDL cholesterol ≥ 1·7 mmol/L or HDL cholesterol < 1·3 mmol/L in women or <1·0 mmol/L in men(Reference Sun, Yu and Liao37,Reference Pan, Liang and Zhang38) . Diabetes was defined as self-reported diagnosis of diabetes, use of insulin or oral hypoglycaemic agents, HbA1c ≥ 48 mmol/mol (≥ 6·5 %) or measured fasting glucose ≥ 11·1 mmol/L(Reference Wang, Morton and Salim39–Reference Young, McGovern and Barroso41).
Outcomes assessment
Date of deaths was systematically compiled from records maintained by the National Health Service Information Centre (England and Wales) and the National Health Service Central Register Scotland (Scotland). Follow-up periods were calculated as intervals from date of attending baseline survey to death date or date of censoring, whichever came first. And the censoring date was established as 15 January 2023 according to the latest released mortality data. The outcomes were all-cause mortality and cause-specific mortality (CVD, cancer) according to the corresponding International Classification of Diseases, 10th Revision codes(Reference Han, Cao and Feng42). Cardiovascular mortality was defined using International Classification of Diseases, 10th Revision codes I00-I99 and cancer mortality using codes C00-C97(Reference Inoue-Choi, Ramirez and Cornelis43).
Statistical analysis
The entire cohort was randomly divided into training dataset (80 %) and test dataset (20 %). P values were calculated using Student’s t-test for continuous variables and chi-square test for categorical variables. All metabolite concentrations were log-transformed using the natural logarithm (log(n + 1)) to reduce skewness and account for zero values, followed by z-score standardisation within each dataset. Only proteins with fewer than 20 % missing values across all samples were included (N 2911), and missing values were imputed with the median within each dataset to avoid data leakage. Then, plasma protein levels were scaled using z-score standardisation. The missing covariates were imputed by median/mode in the analyses.
We first performed multivariable Cox proportional hazards regression to estimate hazard ratio (HR) and their 95 % CI of associations between FA and all-cause mortality. Two models were established. The minimally adjusted model was only adjusted for age and sex. The fully adjusted model was further adjusted for ethnicity, smoking status, alcohol intake, BMI, education attainment, household income, Townsend deprivation index and healthy diet score. FA were categorised into tertiles based on their distributions, and HR for the second and third tertiles were calculated using multivariable Cox proportional hazards models, with the lowest tertile as the reference group. Additionally, restricted cubic splines were incorporated into Cox models to examine potential non-linear associations between FA and all-cause mortality. Then, we evaluate interactions between FA and 2911 proteins on all-cause mortality (P for interaction < 1·7 × 10–5 [0·05/2911]) in the train dataset, which was subsequently validated in the test dataset (P < 0·05 and effect direction consistent with the train dataset). To further assess robustness, we performed repeated random splits of the dataset to account for variability arising from different data partitions and obtain more reliable estimates. We further performed random-effects meta-analysis to combine the protein–FA interaction estimates across the train and test sets. And non-linear interactions between FA and proteins were assessed using restricted cubic splines in Cox models. In addition, we conducted several sensitivity analyses in the entire dataset to determine the robustness of our findings. First, we conducted the main analyses excluding participants with missing values of covariates. Second, we repeated the main analyses by restricting the follow-up periods above three years. Third, we imputed missing data for proteins to validate interactions between robust proteins and FA in relation to all-cause mortality, using the multiple imputation by chained equations approach with five imputed datasets(Reference White, Royston and Wood44,Reference Marshall, Altman and Holder45) . Each imputed dataset was analysed separately, and estimates were combined using Rubin’s rules. Fourth, we excluded participants with prevalent CVD or cancer at baseline. Fifth, among participants free of baseline disease, multivariable models were further adjusted for hypertension, diabetes and hyperlipidaemia. Sixth, we additionally included C-reactive protein to account for systemic inflammation in the fully adjusted models. Furthermore, we assessed additive interactions using the relative excess risk due to interaction and attributable proportion with their 95 % CI. To assess the potential impact of unmeasured confounding, we calculated E-values for the identified FA-protein interaction pairs(Reference VanderWeele and Ding46). E-values were derived from univariable Cox models for the FA-mortality association. For proteins significantly associated with all-cause mortality, we further stratified participants based on individual median protein levels and estimated associations between FA (below/above median values) and all-cause mortality within each protein stratum in the entire dataset. For cause-specific mortality (CVD and cancer), we applied Fine-Gray subdistribution hazard models to account for competing risks. Then, we further performed subgroup analyses to assess the association between FA and cause-specific mortality in individuals stratified by protein levels. All statistical analyses and data visualisation were conducted using R programming software 4.1.0. The study was reported following Strengthening the Reporting of Observational Studies in Epidemiology guidelines(Reference Vandenbroucke, Von Elm and Altman47).
Results
Participant characteristics
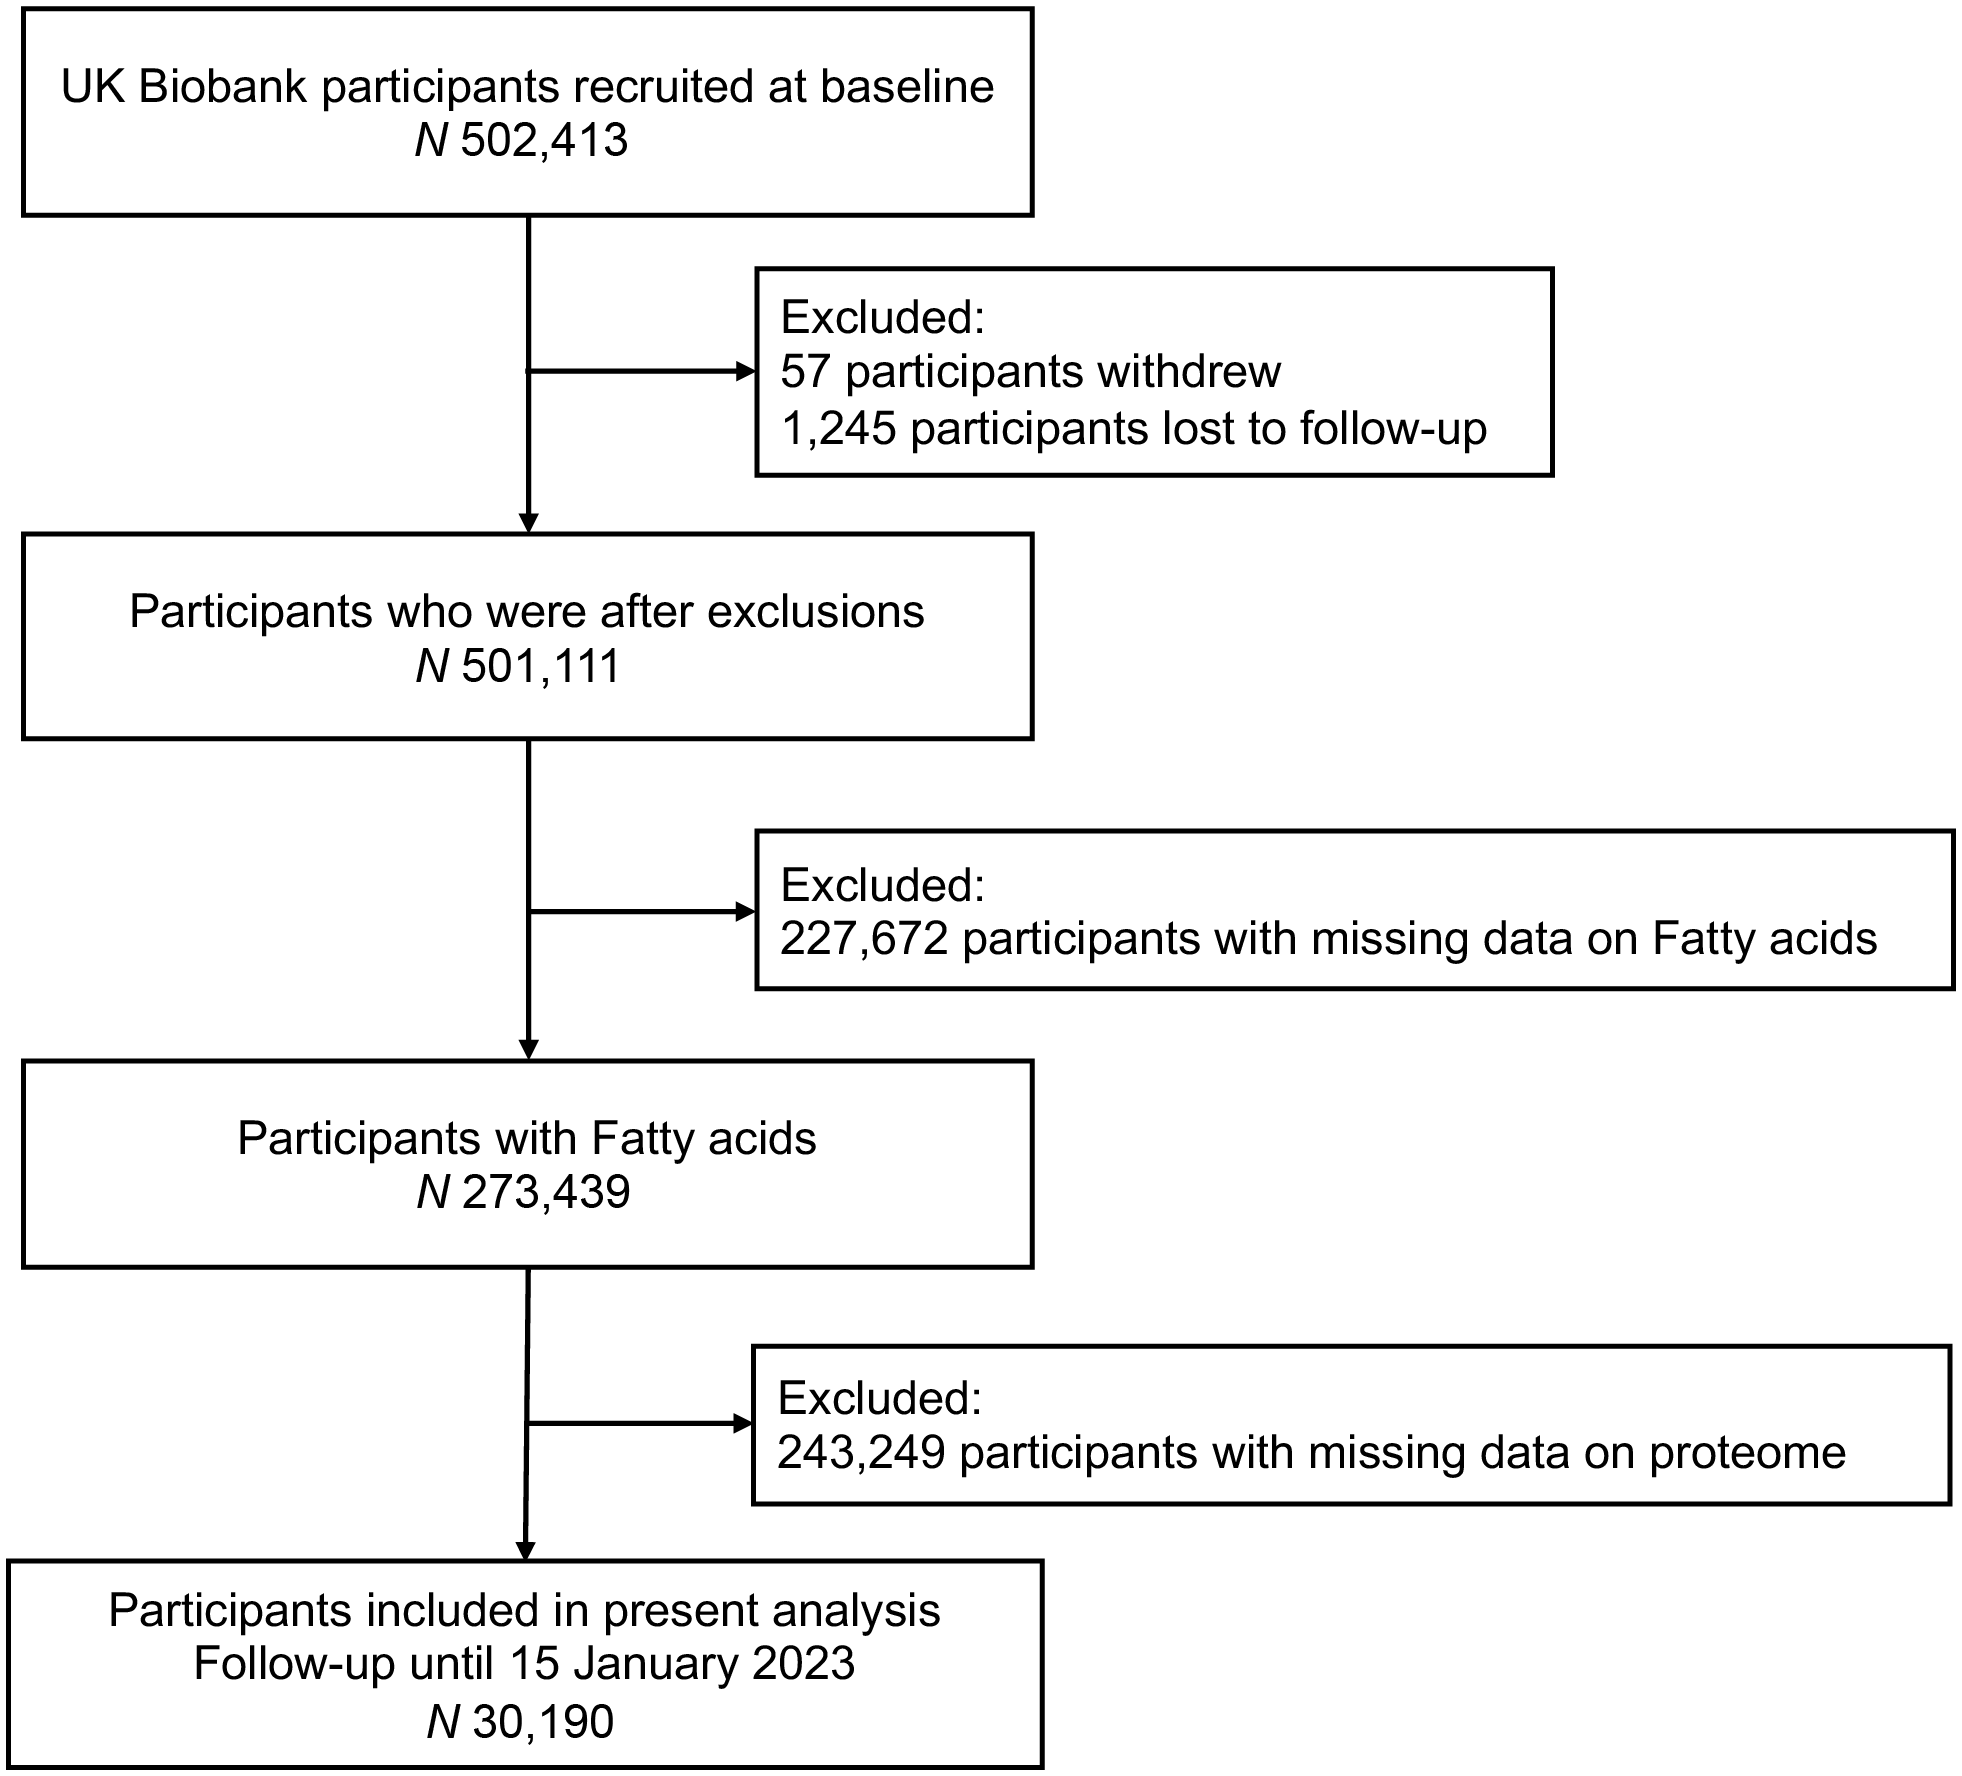
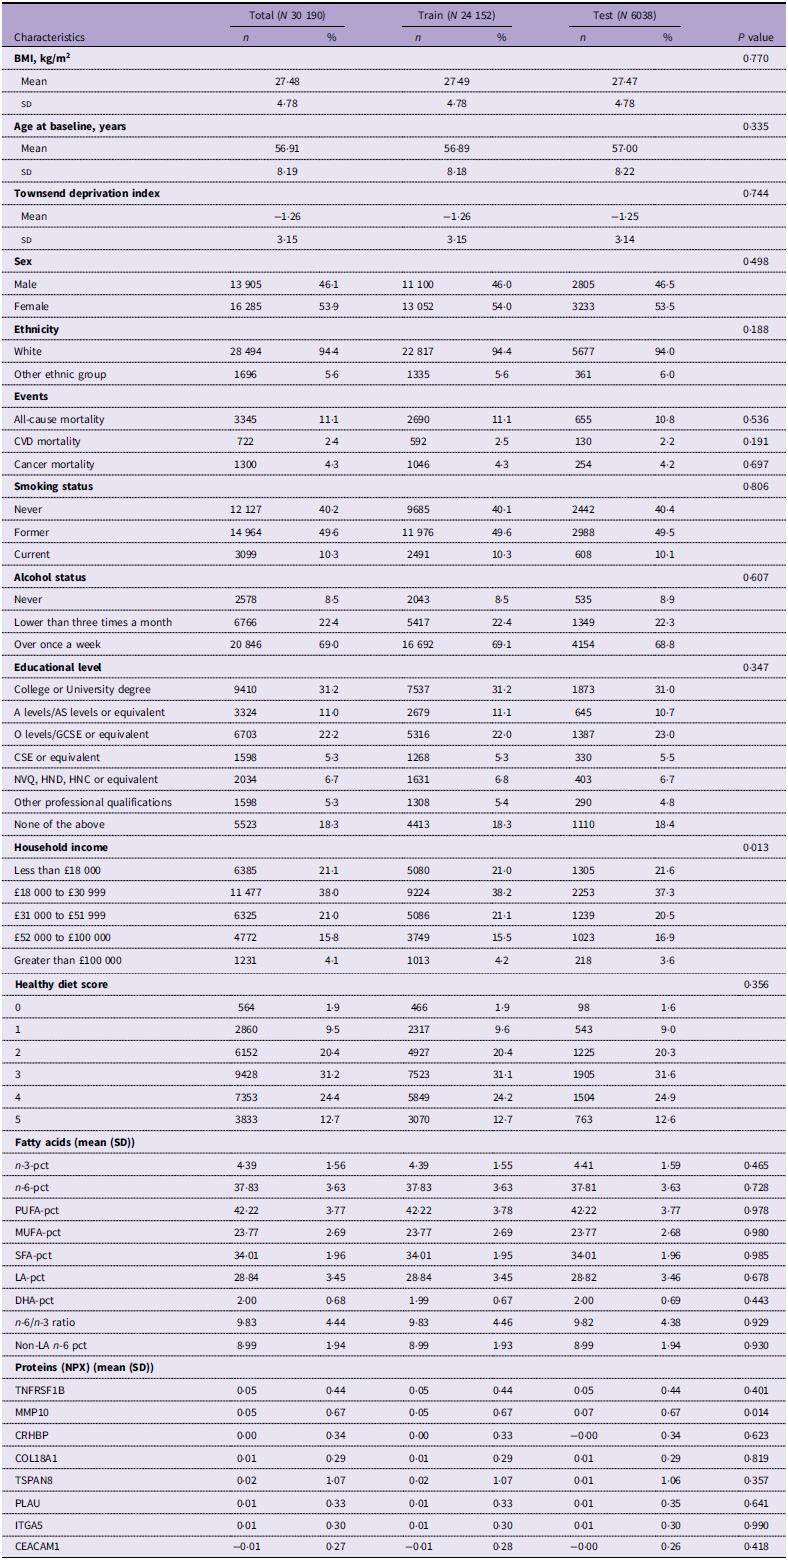
After excluding the participants without complete FA data, and those lost to follow-up or withdrew consent, our study included a total of 30 190 participants for prospective cohort analyses (mean age: 56·91 years, 16 285 females and 13 905 males; Figure 1 and Table 1; Supplementary Table 1). Totally, we documented 3345 deaths during a median 13·9 years of follow-up.
Flowchart for study sample in the UK Biobank.

Figure 1. Long description
Among 502,413 participants enrolled in the UK Biobank cohort, 57 participants who withdrew consent and 1,245 participants without available follow-up information were excluded, leaving 501,111 participants. Among these, 227,672 participants without available fatty acid measurements were excluded, leaving 273,439 participants with fatty acid data. Subsequently, participants without available proteomic measurements were excluded. The final analysis included 30,190 participants with available fatty acid biomarkers, proteomic measurements, and linked mortality data up to 15 January 2023.
Main characteristics of study populations (N 30 190)

Table 1. Long description
Baseline characteristics are shown for 30,190 UK Biobank participants, including demographic characteristics, lifestyle factors, mortality outcomes, fatty acid biomarkers, and circulating protein biomarkers. Participants were divided into train (N = 24,152) and test (N = 6,038) datasets. Most baseline characteristics were similar between the two datasets.
Abbreviations: BMI (calculated as weight in kilograms divided by height in metres squared); PUFA-pct, PUFA to total fatty acids percentage; MUFA-pct, MUFA to total fatty acids percentage; SFA-pct, SFA to total fatty acids percentage; n-3-pct, n-3 fatty acids to total fatty acids percentage; n-6-pct, n-6 fatty acids to total fatty acids percentage; n-6/n-3 ratio, n-6 fatty acids to n-3 fatty acids ratio; LA-pct, linoleic acid to total fatty acids percentage; DHA-pct, docosahexaenoic acid to total fatty acids percentage; non-LA n-6 pct, non-linoleic acid n-6 to total fatty acids percentage; NPX, normalised protein expression; TNFRSF1B, TNF receptor superfamily member 1B; MMP10, matrix metallopeptidase 10; CRHBP, corticotropin-releasing hormone binding protein; COL18A1, collagen type XVIII α 1 chain; TSPAN8, tetraspanin 8; PLAU, urokinase-type plasminogen activator; ITGA5, integrin subunit α 5; CEACAM1, CEA cell adhesion molecule 1.
Associations of fatty acid with all-cause mortality
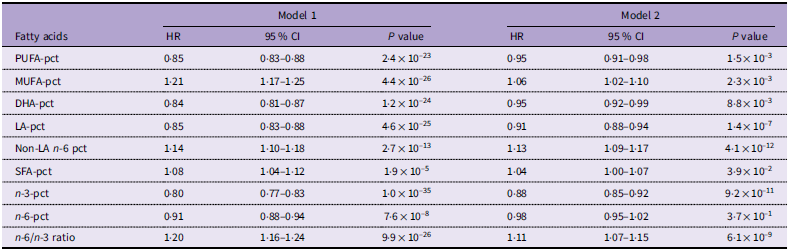
In the models adjusted for age and sex, plasma FA were widely associated with all-cause mortality, and these associations attenuated but remained significant after further adjustment for ethnicity, smoking status, alcohol intake, BMI, education, household income, Townsend deprivation index and healthy diet score (Table 2). Specifically, PUFA-pct (HR per sd: 0·95, 95 % CI: 0·91–0·98, P = 1·5 × 10–3), DHA-pct (HR: 0·95, 95 % CI: 0·92–0·99, P = 8·8 × 10–3), LA-pct (HR: 0·91, 95 % CI: 0·88–0·94, P = 1·4 × 10–7) and n-3-pct (HR: 0·88, 95 % CI: 0·85–0·92, P = 9·2 × 10–11) were associated with lower mortality risk, while MUFA-pct (HR: 1·06, 95 % CI: 1·02–1·10, P = 2·3 × 10–3), SFA-pct (HR: 1·04, 95 % CI: 1·00–1·07, P = 3·9 × 10–2), non-LA n-6 pct (HR: 1·13, 95 % CI: 1·09–1·17, P = 4·1 × 10–12) and n-6/n-3 ratio (HR: 1·11, 95 % CI: 1·07–1·15, P = 6·1 × 10–9) were positively associated with mortality risks. No significant associations between n-6-pct and all-cause mortality were observed (HR: 0·98, 95 % CI: 0·95–1·02, P = 3·7 × 10–1). Meanwhile, n-3-pct was monotonically associated with reduced risk, and compared with the lowest tertile, the HR (95 %CI) were 0·84 (0·78–0·92) and 0·79 (0·72–0·86) for the second and third tertiles, respectively (P-trend < 0·001) (Supplementary Figure 1; Supplementary Table 2). Similar inverse associations were observed for LA-pct, DHA-pct and PUFA-pct, whereas SFA-pct, n-6/n-3 ratio and Non-LA n-6 pct were positively associated with mortality risk. No significant non-linear association was observed (Supplementary Figure 2).
Associations between fatty acids and all-cause mortality

Table 2. Long description
Hazard ratios (HRs) and 95% confidence intervals (CIs) for the associations between nine fatty acid biomarkers and all-cause mortality are presented. Model 1 was adjusted for age and sex. Model 2 was additionally adjusted for ethnicity, alcohol intake, smoking status, BMI, educational level, household income, Townsend deprivation index, and healthy diet score. In the fully adjusted model, Omega-3-pct, PUFA-pct, DHA-pct, and LA-pct were inversely associated with all-cause mortality, whereas MUFA-pct, SFA-pct, Non-LA Omega-6-pct, and Omega-6/Omega-3 ratio were positively associated with all-cause mortality. Omega-6-pct was not significantly associated with all-cause mortality after full adjustment.
Abbreviations: HR, hazard ratio; PUFA-pct, PUFA to total fatty acids percentage; MUFA-pct, MUFA to total fatty acids percentage; DHA-pct, docosahexaenoic acid to total fatty acids percentage; LA-pct, linoleic acid to total fatty acids percentage; Non-LA n-6 pct, non-linoleic acid n-6 to total fatty acids percentage; SFA-pct, SFA to total fatty acids percentage; n-3-pct, n-3 fatty acids to total fatty acids percentage; n-6-pct, n-6 fatty acids to total fatty acids percentage; n-6/n-3 ratio, n-6 fatty acids to n-3 fatty acids ratio. Model 1 was adjusted for age and sex. Model 2 was additionally adjusted for ethnicity, alcohol intake, smoking status, BMI, educational level, household income, Townsend deprivation index and healthy diet score.
Interactions between 2911 circulating proteins and fatty acid on all-cause mortality
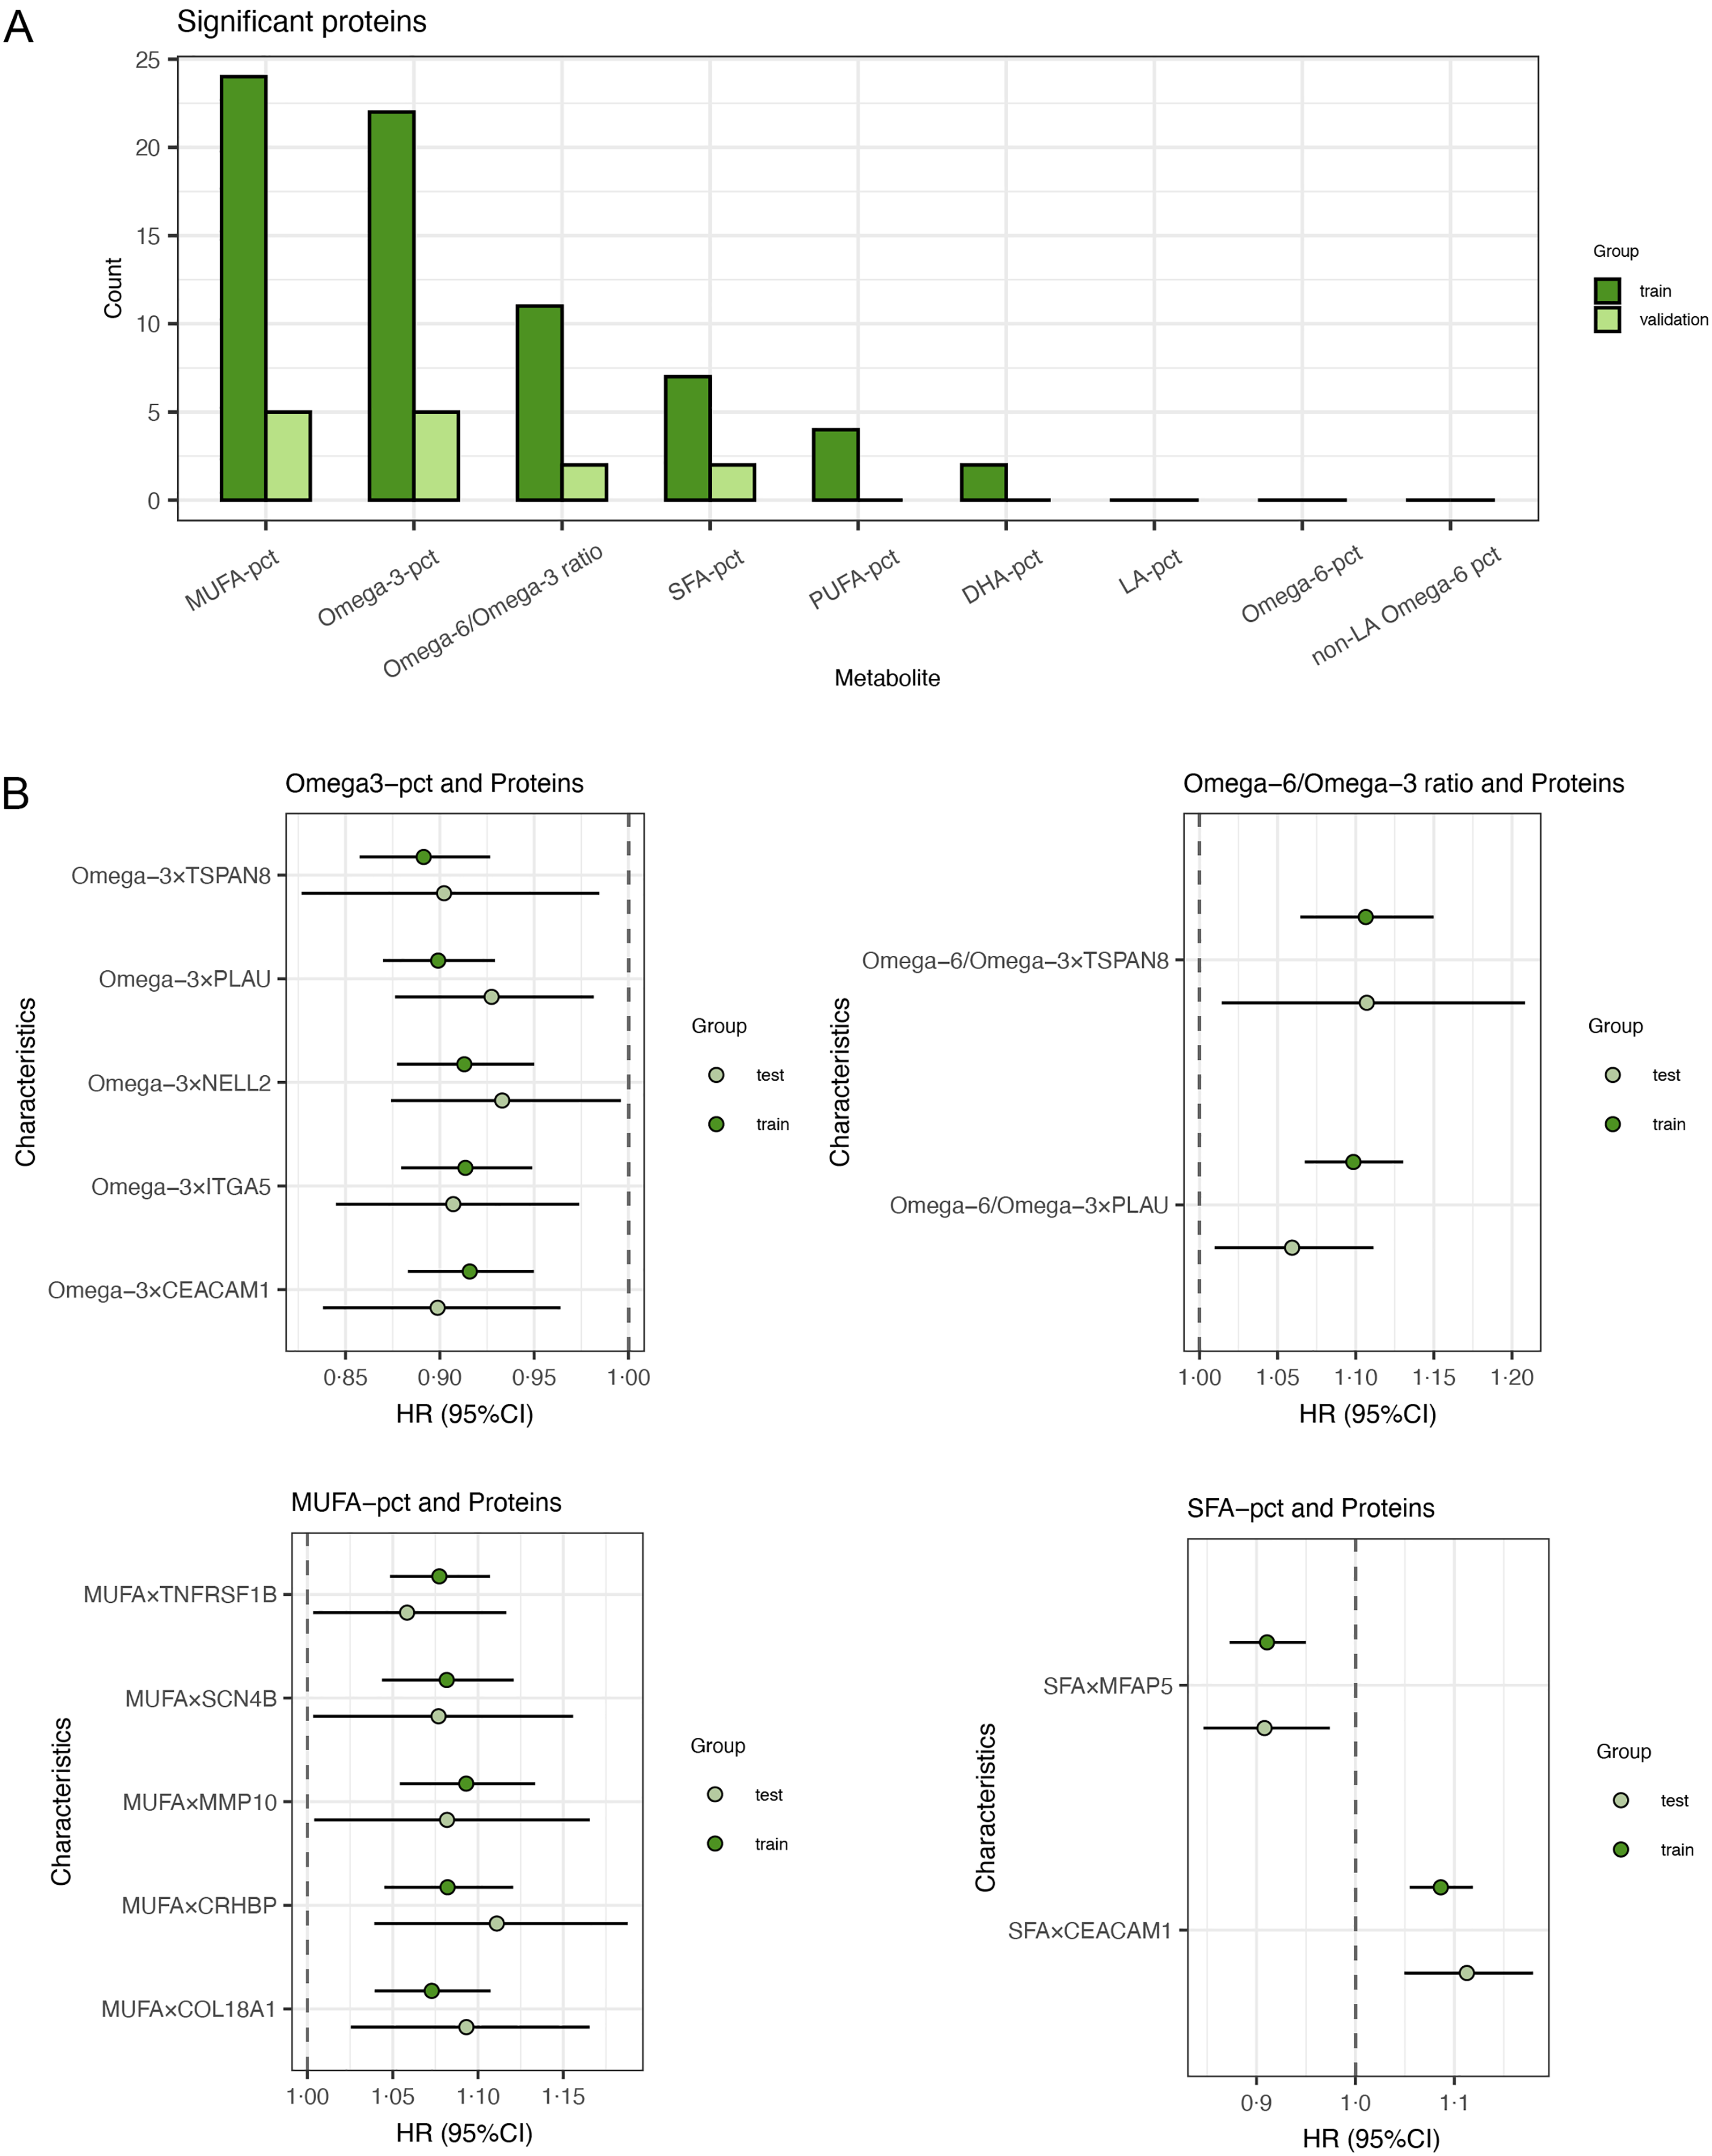
Proteome-wide protein–FA interactions in relation to mortality were estimated in the minimally adjusted model (Supplementary Table 3–10). In the fully adjusted models, we observed statistically significant interactions between 24 pairs of proteins and MUFA-pct, 22 pairs of proteins and n-3-pct, 7 pairs proteins and SFA-pct, 2 pairs of proteins and DHA-pct, 4 pairs of proteins and PUFA-pct, 11 pairs of proteins and n-6/n-3 ratio in the train dataset, and we replicated a subset of these interactions for protein-FA pairs in the test dataset (n 5 for MUFA-pct, n 5 for n-3-pct, n 2 for SFA-pct, n 2 for n-6/n-3 ratio) (Figure 2A; Supplementary Tables 11–16). Interactions between MUFA-pct and TNF receptor superfamily member 1B (TNFRSF1B, P train = 7·5 × 10–8), sodium voltage-gated channel beta subunit 4 (SCN4B, P train = 1·6 × 10–5), matrix metallopeptidase 10 (MMP10, P train = 1·5 × 10–6), corticotrophin-releasing hormone binding protein (CRHBP, P train = 9·0 × 10–6), collagen type XVIIIα1 chain (COL18A1, P train = 1·3 × 10–5) in relation to mortality risks was detected and validated; For n-3-pct, we observed interactions of such FA biomarkers and tetraspanin 8 (TSPAN8, P train = 6·4 × 10–9), urokinase-type plasminogen activator (PLAU, P train = 2·6 × 10–10), neural EGFL-like 2 (NELL2, P train = 7·3 × 10–6), integrin subunit α 5 (ITGA5, P train = 3·2 × 10–6) and CEA cell adhesion molecule 1 (CEACAM1, P train = 2·2 × 10–6). Moreover, interactions of CEACAM1 (P train = 3·3 × 10–8), microfibril-associated protein 5 (MFAP5, P train = 1·4 × 10–5) with SFA-pct in relation to all-cause mortality were identified. Additionally, for the n-6/n-3 ratio, we identified robust interactions with TSPAN8 (HR: 1·106, 95 % CI: 1·065–1·150, P train = 2·6 × 10–7) and PLAU (HR: 1·098, 95 % CI: 1·067–1·130, P train = 1·3 × 10–10) (Figure 2B). No significant interaction was found for other FA biomarkers. Of note, across five independent random splits, nine protein–FA interaction pairs were consistently replicated (MUFA-pct: CRHBP, MMP10, TNFRSF1B; n-3-pct: CEACAM1, ITGA5, PLAU, TSPAN8; n-6/n-3 ratio: PLAU, TSPAN8), whereas five pairs showed inconsistent replication (MUFA-pct: SCN4B, COL18A1; n-3-pct: NELL2; SFA-pct: MFAP5, CEACAM1) (Supplementary Table 17). All nine protein–FA interactions with all-cause mortality remained robust, with consistent effect estimates across train and test datasets (Supplementary Figure 3). Additionally, most protein–FA interactions showed no evidence of non-linearity (all P for non-linearity > 0·05). Notably, the interaction between n-3-pct and CEACAM1 demonstrated a non-linear interaction pattern (P for non-linearity = 0·0427), with relatively little variation in risk at lower CEACAM1 levels and a progressively stronger inverse association at higher CEACAM1 levels (Supplementary Figure 4).
Interaction between 2911 circulating proteins and FA on all-cause mortality in UK Biobank. (A) Bar plot of the CoxPH results. Significant protein counts associated with all-cause mortality (P < 1.7 × 10⁻⁵ [0.05/2911]) in train dataset and (P < 0.05) in the test dataset are labelled. (B) Forest plot of interaction between significant proteins and FA on all-cause mortality in the train dataset and test dataset, respectively. Analyses are adjusted for age, sex, ethnicity, smoking status, alcohol intake, BMI, education attainment, household income, Townsend deprivation index and healthy diet score. Abbreviations: HR, hazard ratio; MUFA-pct, MUFA to total fatty acids percentage; n-3-pct, n-3 fatty acids to total fatty acids percentage; n-6/n-3 ratio, n-6 fatty acids to n-3 fatty acids ratio; SFA-pct, SFA to total fatty acids percentage; PUFA-pct, PUFA to total fatty acids percentage; DHA-pct, docosahexaenoic acid to total fatty acids percentage; LA-pct, LA to total fatty acids percentage; n-6-pct, n-6 fatty acids to total fatty acids percentage; Non-LA n-6 pct, non-LA n-6 to total fatty acids percentage; TSPAN8, tetraspanin 8; PLAU, urokinase-type plasminogen activator; NELL2, neural EGFL-like 2; ITGA5, integrin subunit α 5; CEACAM1, CEA cell adhesion molecule 1; TNFRSF1B, TNF receptor superfamily member 1B; SCN4B, sodium voltage-gated channel beta subunit 4; MMP10, matrix metallopeptidase 10; CRHBP, corticotrophin-releasing hormone binding protein; COL18A1, collagen type XVIII α 1 chain; MFAP5, microfibril-associated protein 5.

Figure 2. Long description
Panel A shows the number of significant protein-fatty acid interactions identified for each fatty acid biomarker in the train dataset and test dataset. The largest numbers of significant interactions were identified for MUFA-pct and Omega-3-pct, followed by Omega-6/Omega-3 ratio, SFA-pct, PUFA-pct, and DHA-pct. Panel B presents forest plots showing hazard ratios and 95% confidence intervals for significant protein-fatty acid interactions replicated between the train dataset and test dataset. Significant replicated interactions included Omega-3-pct with TSPAN8, PLAU, NELL2, ITGA5, and CEACAM1; Omega-6/Omega-3 ratio with TSPAN8 and PLAU; MUFA-pct with TNFRSF1B, SCN4B, MMP10, CRHBP, and COL18A1; and SFA-pct with MFAP5 and CEACAM1. The interaction effects showed consistent directions and similar effect estimates between the train dataset and test dataset.
In the sensitivity analyses, the results were generally consistent when excluding participants with missing covariates (Supplementary Table 18–20) or mortality that occurred within the first three years of follow-up (Supplementary Table 21–23). And no substantial changes in estimates were observed using multiple imputed proteomics data (Supplementary Table 24–26). Excluding participants with baseline CVD or cancer, additionally adjusting for baseline hypertension, diabetes and hyperlipidaemia, or adjusting for C-reactive protein, the interactions of MUFA-pct, n‑3-pct and n‑6/n‑3 ratio with their respective proteins remained statistically significant, consistent with the primary analyses (Supplementary Table 27).
Additive interaction was further assessed using the relative excess risk due to interaction. For all-cause mortality, relative excess risk due to interaction estimates were consistently positive and statistically significant across all replicated pairs (e.g. n-3-pct × PLAU: 0·37, 95% CI: 0·24–0·51) (Supplementary Table 28).
Subgroup analysis of significant circulating proteins and fatty acid with all-cause mortality
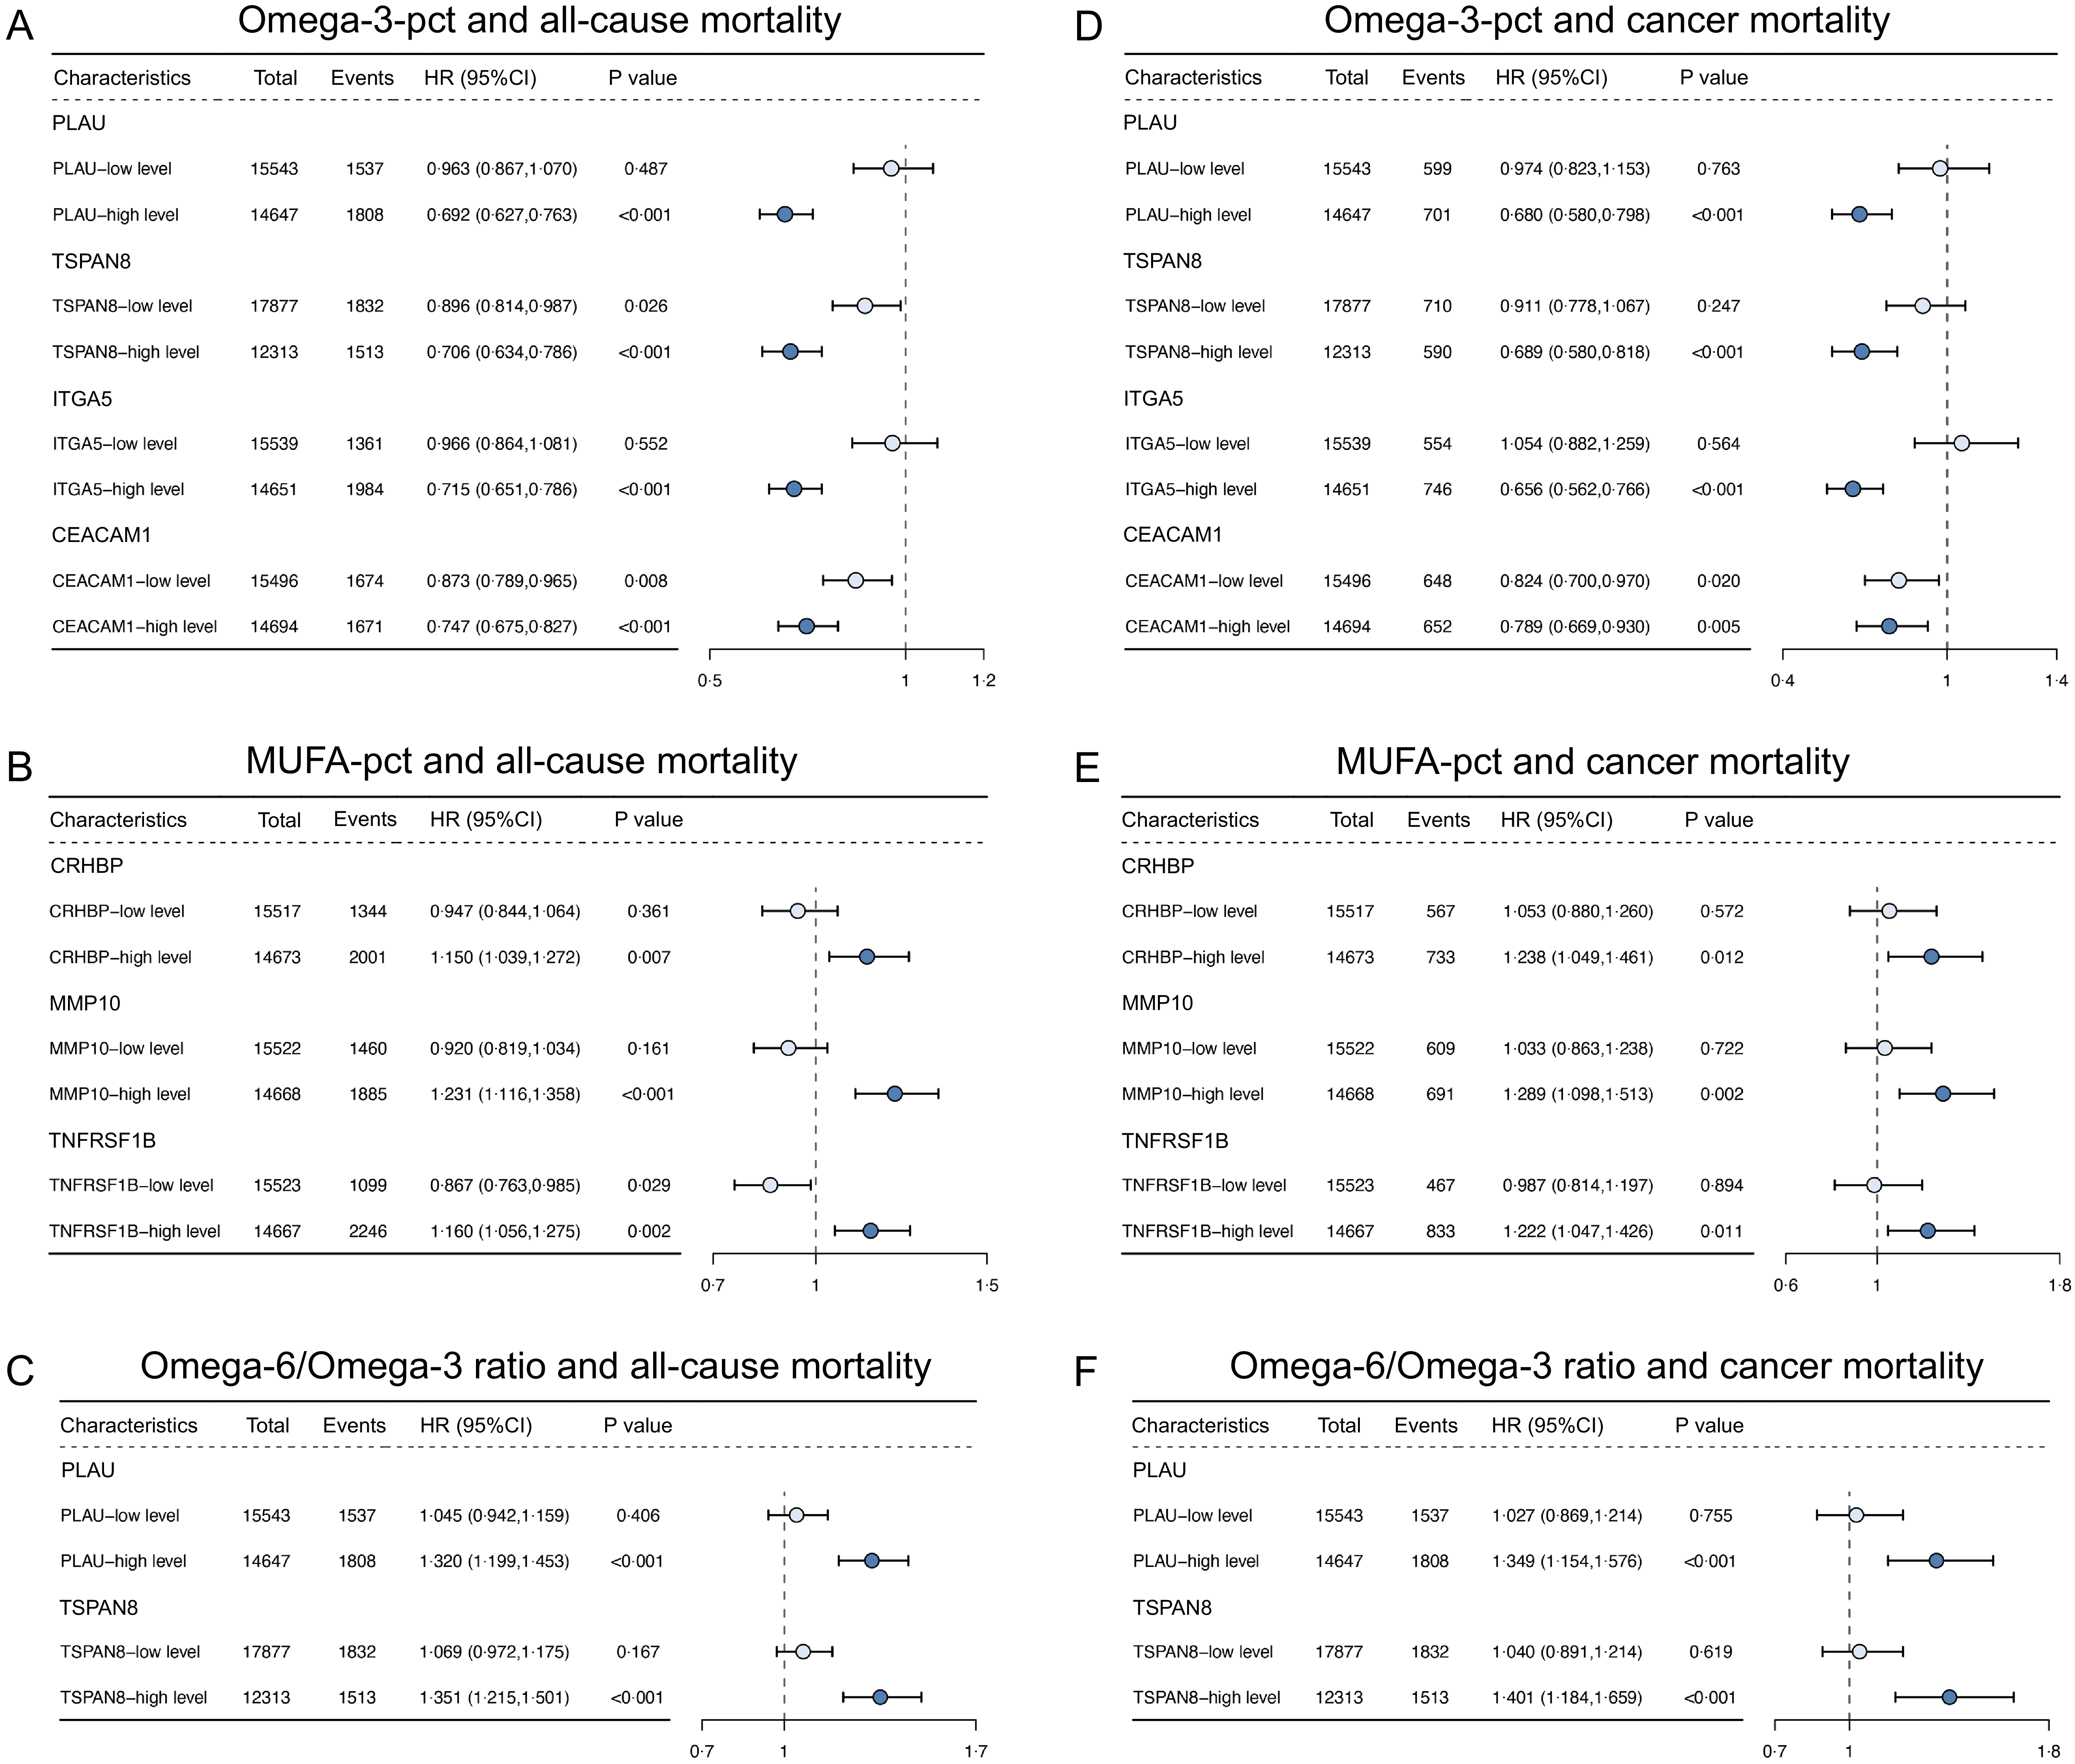
To better interpret the interaction between proteins and FA on all-cause mortality, we conducted subgroup analyses based on protein, examining differences in associations of FA and all-cause mortality within different protein expression levels under the fully adjusted model. In the protein-stratified analysis, participants were categorised into low- and high-level groups of proteins using the median protein expression as the cut-off (Figure 3A–C, Supplementary Table 29–31). MUFA-pct was associated with higher risk of all-cause mortality among strata with high levels of CRHBP (HRMUFA: 1·15, 95 %CI: 1·04–1·27), MMP10 (HRMUFA: 1·23, 95 %CI: 1·12–1·36) and TNFRSF1B (HRMUFA: 1·16, 95 %CI: 1·06–1·28), whereas stronger protective associations were observed for n-3-pct with all-cause mortality among those with high levels of PLAU (HRn −3:0·70, 95 %CI: 0·63–0·76), TSPAN8 (HRn -3:0·71, 95 %CI: 0·63–0·79), ITGA5 (HRn -3:0·72, 95 %CI: 0·65–0·79) and CEACAM1 (HRn -3:0·75, 95 %CI: 0·68–0·83). Furthermore, n-6/n-3 ratio showed more positive associations with all-cause mortality risk among individuals with high level of PLAU (HRn -6/ n -3 ratio: 1·32, 95 %CI: 1·20–1·45) or TSPAN8 (HRn -6/ n -3 ratio: 1·35, 95 %CI: 1·22–1·50).
Subgroup analysis of significant proteins and FA for mortality. (A) Forest plot of n-3-pct on all-cause mortality after stratification according to significant proteins. (B) Forest plot of MUFA-pct on all-cause mortality after stratification according to significant proteins. (C) Forest plot of n-6/n-3 ratio on all-cause mortality after stratification according to significant proteins. (D) Forest plot of n-3-pct on cancer mortality after stratification according to significant proteins. (E) Forest plot of MUFA-pct on cancer mortality after stratification according to significant proteins. (F) Forest plot of n-6/n-3 ratio on cancer mortality after stratification according to significant proteins. Abbreviations: HR, hazard ratio; n-3-pct, n-3 fatty acids to total fatty acids percentage; PLAU, urokinase-type plasminogen activator; TSPAN8, tetraspanin 8; ITGA5, integrin subunit α 5; CEACAM1, CEA cell adhesion molecule 1; MUFA-pct, MUFA to total fatty acids percentage; CRHBP, corticotrophin-releasing hormone binding protein; MMP10, matrix metallopeptidase 10; TNFRSF1B, TNF receptor superfamily member 1B; n-6/n-3 ratio, n-6 fatty acids to n-3 fatty acids ratio; PLAU, urokinase-type plasminogen activator; TSPAN8, tetraspanin 8.

Figure 3. Long description
For all-cause mortality, Omega-3-pct was associated with lower mortality risk among participants with high levels of PLAU, TSPAN8, ITGA5, and CEACAM1. MUFA-pct was associated with higher mortality risk among participants with high levels of CRHBP, MMP10, and TNFRSF1B, whereas Omega-6/Omega-3 ratio was associated with higher mortality risk among participants with high levels of PLAU and TSPAN8. Similar patterns were observed for cancer mortality. Omega-3-pct was associated with lower mortality risk among participants with high levels of PLAU, TSPAN8, ITGA5, and CEACAM1. MUFA-pct was associated with higher mortality risk among participants with high levels of CRHBP, MMP10, and TNFRSF1B, whereas Omega-6/Omega-3 ratio was associated with higher mortality risk among participants with high levels of PLAU and TSPAN8.
Protein–fatty acid interactions in relation to cause-specific mortality
We further investigated interactions between robust proteins and FA in relation to CVD and cancer mortality. The Fine-Gray subdistribution hazard models showed that the interaction between FA and cause-specific mortality were broadly consistent with those observed for all-cause mortality, although the estimates were attenuated (Supplementary Table 32). MUFA-pct was associated with higher CVD mortality in individuals with high MMP10 levels (HRMUFA: 1·25, 95 %CI: 1·02–1·55), while n-3-pct was associated with a lower risk for mortality from CVD among those with high-level PLAU (HRn -3:0·80, 95 %CI: 0·65–1·00) and TSPAN8 (HRn −3:0·78, 95 %CI: 0·62–0·99). Additionally, a higher n-6/n-3 ratio was associated with increased CVD mortality among participants with high-level PLAU (HRn -6/ n -3 ratio: 1·23, 95 %CI: 1·00–1·52) or TSPAN8 (HRn -6/ n -3 ratio: 1·32, 95 %CI: 1·05–1·66) (Supplementary Figure 5A-C; Supplementary Table 33–35). The interactions between robust proteins and FA on cancer mortality were largely consistent with all-cause mortality. (Figure 3D-F; Supplementary Table 36–38). In addition, E-value analyses for the high protein strata showed that substantial unmeasured confounding would be required to explain away the observed associations, with E-values ranging from 1·74 to 3·71 (Supplementary Table 29–31, 33–38).
Discussion
In this study, we systematically estimated the interactions between proteins and FA in relation to all-cause mortality risk in the UKBB. MUFA-pct was associated with increased risk on all-cause mortality among individuals with high-level TNFRSF1B, MMP10 and CRHBP, while n-3-pct had stronger protective associations with such outcome among individuals with high-level TSPAN8, PLAU, ITGA5 and CEACAM1. Additionally, n-6/n-3 ratio was linked to increased risk of mortality among participants with high-level PLAU or TSPAN8. Given the observational nature of our study, these findings should be interpreted as hypothesis-generating, but nevertheless advance current understandings of FA in relation to health risks and highlight the heterogeneity in associations between FA and mortality risks across distinct protein expression levels.
Although epidemiological studies have observed associations between FA and mortality in the general population(Reference O’Keefe, O’Keefe and Tintle6–Reference Liu, Ao and Li9), few studies had been conducted to investigate physiological difference in health risks or benefits linked to FA. And most research focused on modifying multiple risk factors, how they relate to health at a molecular level remains poorly understood. For example, a recent study investigated the associations of FA with all-cause, CVD and cancer mortality and found that rs174547 and rs16966952 modified these associations(Reference Liu, Ao and Li9). However, such interaction analyses are limited to selected loci and capture only part of the underlying biological heterogeneity. In contrast, large-scale plasma proteomic studies show that both genetic and non-genetic factors contribute to variation in circulating proteins, with joint influences explaining a substantial proportion of proteomic variability(Reference Niu, Stinson and Holm48,Reference Carrasco-Zanini, Wheeler and Uluvar49) . Accordingly, proteome-wide analyses enable systematic identification of molecular features that may modify FA-mortality associations. With comprehensive proteomic profiling, we evaluated the interactions between FA and proteins on mortality. Our findings indicated that the association between FA and mortality varies according to protein expression levels, highlighting the role of specific proteins as potential effect modifiers in the relationship between FA and mortality. Furthermore, we observed that the associations of FA with mortality may be stronger among individuals with specific protein patterns relevant to high stress and inflammatory status. In the future, the complex interactions between FA intakes and specific protein model require further research to help develop personalised nutrition and precise intervention among populations, informing more effective strategies to reduce mortality risk.
n-3 exert positive modulatory and anti-inflammatory properties, having been shown to be beneficial for inflammation-related disorders(Reference Yan, Jiang and Spinetti50). Elevated levels of robust proteins can indicate inflammation status. Tumour necrosis factor-α (TNF-α) upregulates leucocyte adhesion by enhancing expression of α5β1 integrins, composed of ITGA5 and ITGB1 subunits, suggesting that the engagement of ITGA5 may promote TNF-α/NF-κB-mediated pro-inflammatory responses(Reference Li, Chen and Kubota51). TSPAN8 has been reported to contribute to TNF-α shedding through enhanced ADAM17-mediated pro-inflammatory signalling(Reference Müller, Saunders and Senftleben52). Tumour cell-secreted PLAU activates fibroblasts into inflammatory cancer-associated fibroblasts, which may facilitate expression and secretion of IL8 via the uPAR/Akt/NF-κB pathway. Additionally, CEACAM1 may contribute to chronic inflammatory milieu by promoting endothelial dysfunction, fibrosis, and oxidative stress via mutual up-regulation with TNF-α(Reference Götz, Rueckschloss and Reimer53). As previously reported, n-3 can down-regulate multiple transcription factors (such as NF-κB) activities leading to the lower synthesis of pro-inflammatory cytokines (TNF-α/IL-1)(Reference Wenderoth, Feldotto and Hernandez54). Taken together, our findings suggested that the protective association of n-3 on all-cause mortality may be amplified among participants with elevated inflammation status, as characterised by high-level ITGA5, TSPAN8, PLAU and CEACAM1.
n-6/n-3 ratio contributes to the pathogenesis of multiple chronic diseases, like CVD, cancer, and inflammatory and autoimmune diseases(Reference Mazidi, Shekoohi and Katsiki55–Reference DiNicolantonio and O’Keefe59). Excessive amounts of n-6 are pro-inflammatory, whereas increased levels of n-3 exert suppressive effects(Reference Innes and Calder60,Reference Peh, Nshimiyimana and Brüggemann61) . Lipid mediators derived from n-6, such as prostaglandins and leukotrienes, are involved in the initiation and propagation of inflammation(Reference Serhan and Levy62). In contrast, n-3 are precursors of specialised pro-resolving mediators that actively orchestrate the resolution of inflammation and promote the return to tissue homeostasis(Reference Park63). These mediators limit further neutrophil infiltration and stimulate macrophage-mediated clearance of apoptotic cells (efferocytosis)(Reference Körner, Schlegel and Theurer64). During inflammation, the resolution phase is an active process mediated by specialised pro-resolving mediators derived from n-3(Reference Serhan and Levy62,Reference Panigrahy, Gilligan and Serhan65) . Meanwhile, n-3 and n-6 share common desaturases and elongases and are therefore possibly competitive within both metabolic pathways. Notably, eicosapentaenoic acid, as a 20-carbon long-chain n-3, competes with arachidonic acid (AA) for cyclooxygenase and lipoxygenase enzymes and gives rise to different eicosanoids, while decreasing the production of pro-inflammatory eicosanoids derived from AA(Reference Körner, Schlegel and Theurer64). Overall, these findings support that the observed associations of the n-6/n-3 ratio may be largely attributable to n-3 and are significantly modified by PLAU and TSPAN8.
Non-LA n-6 refers to all n-6 other than LA in circulation. Among these, AA is a major long-chain n-6 but accounts for only a minor proportion in circulation(Reference Wu, Lemaitre and King66), as it is mainly esterified in membrane phospholipids where it is stored in the sn-2 position(Reference Hanna and Hafez67). Upon cellular activation, AA is released by phospholipase A2 through hydrolysis of the sn-2 acyl bond and is subsequently metabolised by cyclooxygenases, lipoxygenases and cytochrome P450 enzymes to generate eicosanoids, including prostaglandins and leukotrienes(Reference Wang, Wu and Chen68). These eicosanoids are bioactive lipid mediators that regulate a wide variety of physiological and pathological processes, whereas AA is the usual substrate for eicosanoid synthesis(Reference Zhang, Liu and Sun69). Taken together, this may partly explain the weaker associations observed between circulating non-LA n-6 and proteins.
MUFA, including oleic acid and palmitic acid, was shown to impair insulin secretion and exert pro-inflammatory effects(Reference Wu, Liu and Pang70–Reference Howe, Burke and O’Reilly72). TNFRSF1B, predominantly expressed on immune cells and up-regulated during inflammation, binds TNF-α to activate NF-κB signalling, thereby inducing pro-inflammatory cytokine production(Reference Cabal-Hierro, Rodríguez and Artime73,Reference Dostert, Grusdat and Letellier74) . Endothelial MMP10 can be induced by thrombin via a PAR-1-dependent mechanism involving ERK/JNK/AP1 activation, leading to up-regulation of pro-inflammatory cytokines such as TNF-α and IL-1β, thereby enhancing vascular inflammation(Reference Matilla, Roncal and Ibarrola75). Circulating CRHBP as high-affinity binding protein is bound to CRH and then reduce CRH’s biological effects mediated by CRH-Receptor (R)1 and CRH-R2, thereby attenuating the activation of hypothalamic-pituitary-adrenal axis. This leads to reduced cortisol production, which exerts anti-inflammatory effects, including suppression of NF-κB signalling(Reference Ketchesin, Stinnett and Seasholtz76). Additionally, studies have demonstrated that high palmitic acid levels synergistically up-regulated inflammation marker levels (TNF-α, IL-6 and TGF-β) under cerulein-induced stress state(Reference Ben-Dror and Birk77). Building upon these findings, our study suggests amplification of the positive association between MUFA and all-cause mortality among participants with elevated inflammation status and stress, as characterised by high-level TNFRSF1B, MMP10, and CRHBP.
Our study has several limitations. Firstly, we only analysed protein concentrations measured at baseline and therefore could not capture the observed variability over time, which may have led to inaccurate estimation of effect sizes in the observational study. Secondly, we could not analyse the relationships for more specific subtypes of plasma FA, such as different chain lengths and degrees of unsaturation of MUFA. Thirdly, as plasma metabolome reflects individuals’ ultimate metabolic state, influenced by the integration of various internal and external factors, their origins remain indistinguishable. Fourthly, given that the participants included in our observational study were predominantly Caucasian and from developed countries with high socioeconomic status, the generalisability of our results should be further determined in other ancestries. Fifthly, residual confounding cannot be ruled out despite extensive adjustment for potential confounders. Nevertheless, E-value analyses indicated that substantial unmeasured confounding would be needed to explain away the observed associations. Lastly, given the observational design, causal inference cannot be established. Despite extensive adjustment for potential confounders, residual confounding cannot be ruled out. Further studies, including mediation analyses, Mendelian randomisation analyses, randomised controlled trials and mechanistic investigations, are needed to clarify potential causal relationships.
Conclusions
By integrating multi-omics data, proteome-wide interaction study of FA identified several candidate proteins interacting with FA, providing novel clues for understanding the heterogeneity of associations between the FA and all-cause mortality. Specific protein patterns relevant to inflammation and stress may modify the risk of n-3, n-6/n-3 ratio and MUFA on all-cause mortality, providing evidence for future development of personalised interventions of FA to reduce mortality risks.
Supplementary material
For supplementary material/s referred to in this article, please visit https://doi.org/10.1017/S0007114526108204
Data availability statement
This research has been conducted using the UK Biobank (UKBB) Resource under application number 70522. All participants provided electronically signed informed consent. The UKBB data will be made available directly from UKBB website (https://www.ukbiobank.ac.uk/) upon researchers’ request. No customised code was used in this study, and all the analyses were performed based on R. Cox proportional hazards regression models were constructed using survival package. Random-effects meta-analyses were conducted using the metafor package. Multiple imputation was conducted using the mice package. Competing risk analyses were performed using the cmprsk package. Dose–response analyses were implemented using the rms and interactionRCS packages. Detailed code for analysis will be available from the authors on request.
Acknowledgements
We thank all the participants and staff in the UK Biobank cohort for their substantial contributions for preparing the underlying data. And we would like to thank Adam Hafidh Omar for his assistance with language editing and manuscript data review to improve the clarity of the manuscript.
Ziyan Qiao: Data curation, Investigation, Formal analysis, Validation, Visualisation, Resources, Software, Writing – original draft, Writing – review & editing. Xinru Wang: Data curation, Validation, Writing – original draft, Writing – review & editing. Chengzhe Tao: Conceptualisation, Investigation, Formal analysis, Validation, Visualisation, Writing – original draft, Writing – review & editing. Sijing Liao: Validation, Writing – original draft, Writing – review & editing. Jiawei Lu: Writing – original draft, Writing – review & editing. Yiting Yuan: Writing – original draft, Writing – review & editing. Yun Fan: Writing – original draft, Writing – review & editing. Qiaoqiao Xu: Writing – original draft, Writing – review & editing. Xu Wang: Conceptualisation, Investigation, Project administration, Supervision, Validation, Writing – review & editing. Chuncheng Lu: Conceptualisation, Data curation, Funding acquisition, Investigation, Project administration, Resources, Supervision, Validation, Writing – review & editing. Ziyan Qiao, Xinru Wang, and Chengzhe Tao contributed equally to this work and should be considered co-first authors.
This work was supported by the National Key Research and Development Program of China (No. 2023YFC2705700), the National Natural Science Foundation of China (No. 82271691) and ‘333 High-level Talent Training Project’ of the Jiangsu Province ((2022) 3-16-425).
The authors declare that there is no conflict of interest.