Introduction
The olive tree Olea europaea L. is a widespread perennial crop in Mediterranean areas all over the world (FAOSTAT, 2014), with important social-economic and landscape impact and increasing interest on its products (Malheiro et al., Reference Malheiro, Rodrigues and Pereira2015), but pests can cause significant losses and reduce profits for growers (Arambourg, Reference Arambourg, Pralavorio and Arambourg1986; Ramos et al., Reference Ramos, Campos and Ramos1998). The olive moth Prays oleae (Bernard) (Lepidoptera: Praydidae) is one of the most important pests of the olive tree in some regions of Europe, occurring also in some African and Asian countries (EPPO, 2011). It has three generations a year and their larval stages feed on different organs of the olive tree. Adults of the phyllophagous generation lay eggs on floral buds. Following eggs hatch, larvae will feed on flowers (anthophagous generation). The flight period of adults of the anthophagous generation occurs at the end of spring, laying the eggs of the carpophagous generation on the olive calyx. Then, larvae bore into the olive stone and feed on the seed. At the end of summer and beginning of autumn, adults of the carpophagous generation emerge and lay the eggs of phyllophagous generation on the olive leaves. From them, hatched larvae will dig galleries and feed on leaves, where they overwinter till the beginning of spring (Arambourg, Reference Arambourg, Pralavorio and Arambourg1986).
Crop management practices intend to suppress pest densities, often by improving the action of natural enemies but also affecting directly the pest population (Gurr et al., Reference Gurr, Wratten, Landis and You2017). Moreover, the surrounding landscape can also influence the crop colonization by both pests and natural enemies (Thies and Tscharntke, Reference Thies and Tscharntke1999; Bianchi et al., Reference Bianchi, Booij and Tscharntke2006; Koh and Holland, Reference Koh and Holland2015). In olive groves, Paredes et al. (Reference Paredes, Cayuela, Gurr and Campos2015) found that local, landscape and regional variability explained a large proportion of the variability in several olive pests response variables, including the olive moth, while there were small and inconsistent effects of ground cover on the abundance of pests.
Non-crop habitats surrounding olive groves could influence P. oleae populations. These habitats also might be beneficial for P. oleae adults by supplying food, shelter or resting places during dispersal. Some plant species normally present in natural habitats near olive groves have floral nectar theoretically accessible to P. oleae (Nave et al., Reference Nave, Gonçalves, Crespí, Campos and Torres2016) and, when tested in laboratory experiments, they improved P. oleae survival (Villa et al., Reference Villa, Marrão, Mexia, Bento and Pereira2016a). Additionally, the degree of permeability of non-crop habitats to pest or natural enemies constitute an important factor which determines the influence of the surrounding landscape on the crop colonization. This degree of permeability can facilitate or impede movements among resources patches (i.e. functional connectivity) and influence the pest dispersal (Taylor et al., Reference Taylor, Fahrig, Henein and Merriam1993; Tischendorf and Fahrig, Reference Tischendorf and Fahrig2000). Importantly, population exchanges between crop and non-crop areas may include beneficial as well as unwelcome interactions (Tscharntke et al., Reference Tscharntke, Rand and Bianchi2005). Therefore, the knowledge about the role of non-crop habitats as barriers for specific pests can be used for conservation biological control (Perović et al., Reference Perović, Gurr, Raman and Nicol2010). Finally, several studies suggested that heterogeneous landscapes have more potential for maintaining and enhancing the biological control of pests (Bianchi et al., Reference Bianchi, Booij and Tscharntke2006; Rusch et al., Reference Rusch, Bommarco, Jonsson, Smith and Ekbom2013). Studies performed with the olive fruit fly Bactrocera oleae (Rossi) (Diptera: Tephritidae) showed that the reduction of the pest numbers was correlated with the landscape complexity (Ortega and Pascual, Reference Ortega and Pascual2014) or with the increase of scrubland areas at 1500 m radii (Ortega et al., Reference Ortega, Pascual and Rescia2016). Also, Boccaccio and Petacchi (Reference Boccaccio and Petacchi2009) showed that parasitoids of B. oleae were positively affected by landscape connectivity. However, despite the importance of P. oleae as an olive pest, few studies addressed the effect of the olive crop surrounding patches on its abundance. For example, Paredes et al. (Reference Paredes, Cayuela, Gurr and Campos2013b) found that the abundances of the olive psyllid Euphyllura olivina (Costa) (Hemiptera: Psyllidae) and P. oleae decreased with the presence of herbaceous and woody vegetation patches near the olive crops and with the occurrence of smaller patches of woody vegetation within the olive groves.
In this context, pest movements throughout the field can be tracked through the identification of pollen grains in or on the insect bodies (Jones, Reference Jones2014 and references therein) due to the presence of specific plants. This technique has been used for studying migrations in lepidopteran species, such as the turnip moth, Agrotis segetum (Schiff.) (Lepidoptera: Noctuidae) (Chang et al., Reference Chang, Guo, Fu, Liu, Kris, Hou and Wu2018 and references therein).
Thus, the aim of this study was to evaluate the dispersal of P. oleae among crop areas and movements throughout surrounding non-crop patches as well as the effect of the landscape on the pest abundance. Three approaches were considered: (i) the presence of non-crop pollen grains from surrounding areas on P. oleae bodies; (ii) the capability of P. oleae to penetrate non-crop patches; (iii) the response of P. oleae abundance to the landscape structure.
Material and methods
Study areas
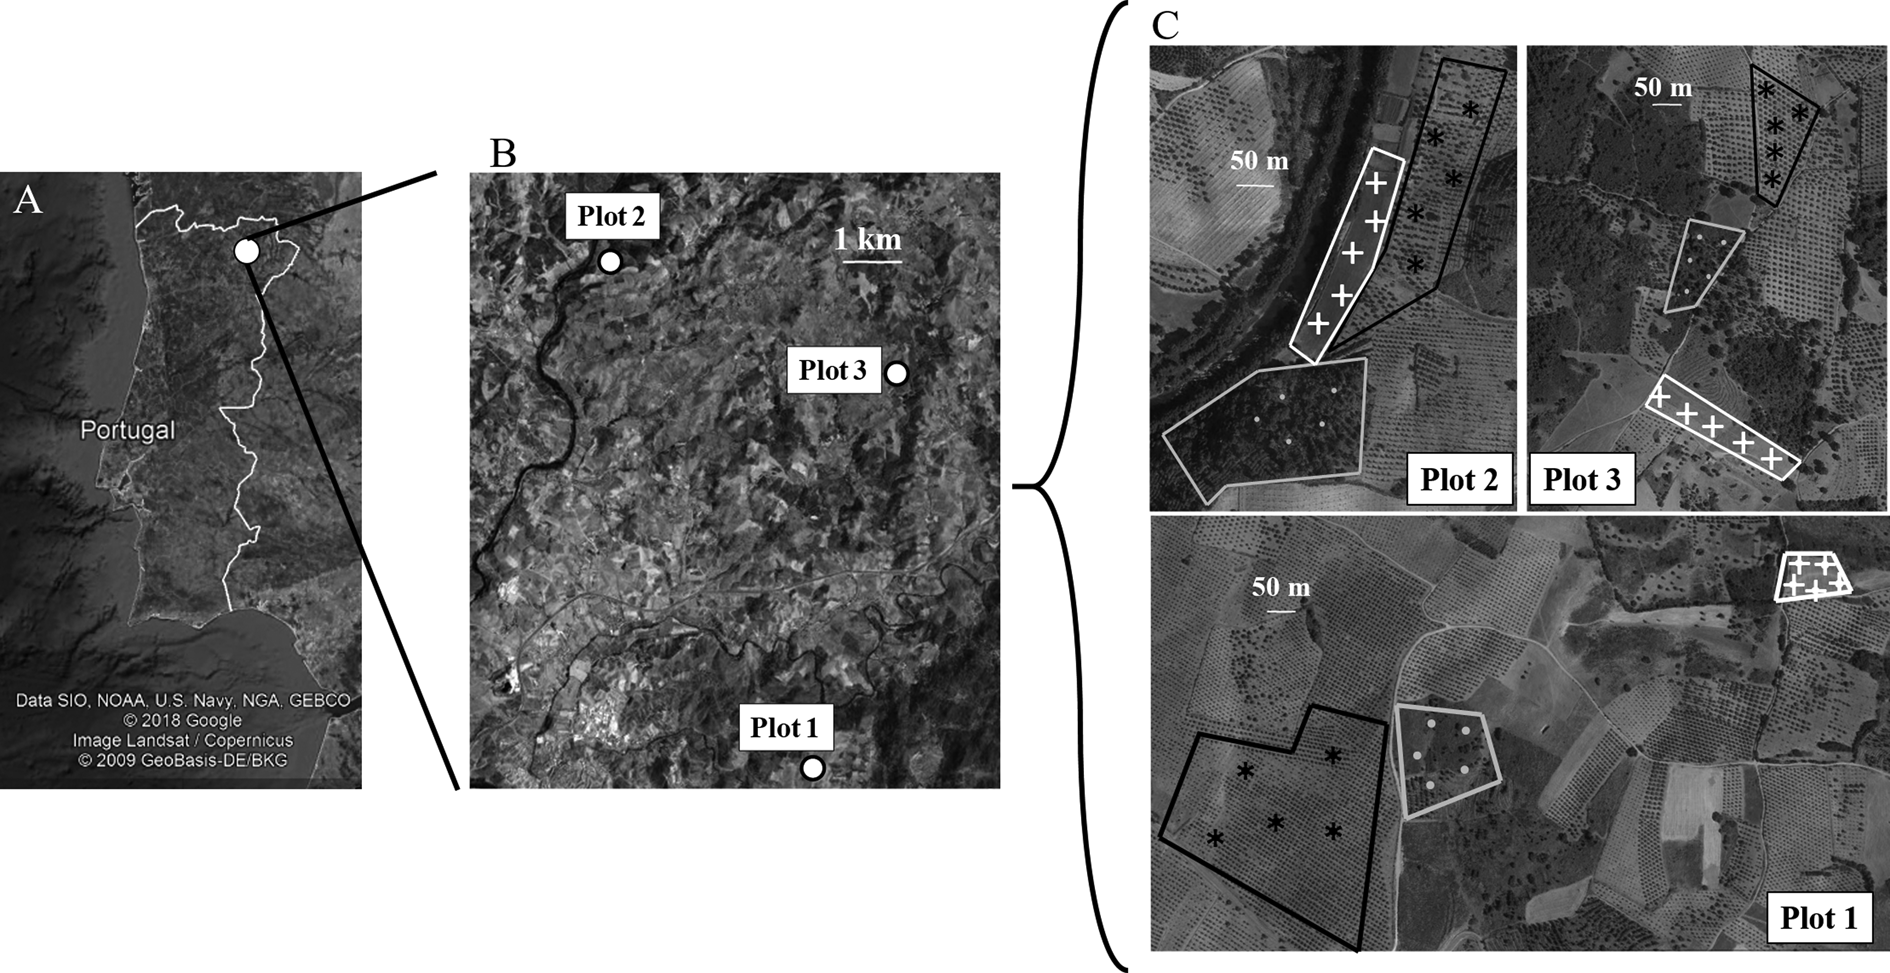
The study was conducted in Mirandela municipality (northeast of Portugal), during 2012 and 2013 in three landscape areas (plot 1 – located in Cedães 41°29′16″N, −7°07′34″W, plot 2 – located in Paradela: 41°34′12″N, −7°09′59″W, and plot 3 – located in Guribanes: 41°32′8″N, −7°07′29″W), separated between 5 and 8 km. Each plot included one olive grove, one herbaceous vegetation patch and one scrubland patch (fig. 1). During the experimental years, the olive groves were not tilled and were not sprayed with pesticides. The three olive groves had similar characteristics: the plant density is 7 × 7 m2, the olive tree age was around 35–70 years and tree varieties were mostly Cobrançosa with some Madural and Verdeal Transmontana. Scrubland patches were composed of three vegetation strata: herbaceous, shrub and tree strata derived from agriculture abandonment and were dominated by typical Mediterranean species such as the holm oak Quercus rotundifolia Lam. (Fagaceae) and the shrubs gum rockrose – Cistus ladanifer L (Cistaceae), common broom – Cytisus spp. (Fabaceae) or French lavender – Lavandula pedunculata (Miller) (Lamiaceae). Herbaceous vegetation patches were composed of cereal or grass mixture for livestock food, where the main plant families were Poaceae, Asteraceae, Fabaceae and Brassicaceae. The sampled area was about 2 ha in each olive grove and about 1 ha in each surrounding patches (scrubland and herbaceous). The land uses selection (olive groves, scrubland and herbaceous) was based on the most frequent field types occurring in the region.
Map of Portugal showing the study site (a). Map showing sampled plots and distance between them (b). Maps showing the patches on plots (olive groves – *; scrublands – •; herbaceous vegetation – +), the distance between them and the delta traps location (points) (c).

Prays oleae sampling
• Prays oleae sampling for pollen analysis
In 2013, in a weekly basis from the end of March to December P. oleae adults were captured from the canopy of 25 olive trees randomly selected in each of the three olive groves. Two branches were beaten three times in each olive tree over a rectangular cloth (60 × 50 cm2) provided with a plastic bag in the base for insect collection and P. oleae adults were frozen for further pollen analysis.
• Prays oleae sampling for dispersal and landscape effect analysis
The abundance of P. oleae males in the different patches (olive grove, scrubland and herbaceous patches) and in the three plots (Cedães, Guribanes and Paradela) was monitored, every week, from the end of March to December of 2012 and 2013. For that, five Delta traps were installed in each olive grove, scrubland and herbaceous patch, i.e. nine patches (three olive groves, three scrublands and three herbaceous vegetation patches summing a total of 45 traps in each sampling date). Traps were separated about 50 m from each other (fig. 1). The delta traps were baited with P. oleae sex pheromone ((Z)-7-tetradecenal (Biosani, Palmela, Portugal)) that attracted males. In olive groves and scrublands, the traps were hung on trees (at about 2 m height) and in the herbaceous vegetation, patches were hung on a T-shaped structure made of wood (at 70 cm height).
Pollen analysis
In order to identify which patches were visited by adults of P. oleae (without sex distinction), the pollen types on the body of individuals previously collected from the olive tree canopies were identified to pollen type. For that, they were acetolysed in order to eliminate P. oleae tissues, proteins, lipids and debris and make possible the pollen grains identification (Jones, Reference Jones2014). Each insect was transferred into a 1.5 ml microcentrifuge tube and 0.5 ml of glacial acetic acid was added to dehydrate the sample for 5 min. The glacial acetic acid was discarded, the insect was smashed with a clean toothpick and 0.5 ml of acetolysis mixture (9:1 ratio of acetic anhydride to sulphuric acid) was added to each sample. The tubes were heated (100°C) in a dry heater for microcentrifuge tubes for 5 min. After that, 0.5 ml of glacial acetic acid was added to stop the acetolysis process. The samples were centrifuged for 3 min to 5000 rpm and the supernatant was discarded. In order to clean the remaining reagents, the samples were washed three times by adding 0.5 ml of distilled water and stirring in a vortex. Then, they were centrifuged (3 min at 5000 rpm) and the supernatant discarded. All reactive processes were conducted in a fume hood. The acetolysed material was transferred to a microscope slide. Then two drops of glycerine jelly: water (1:1) were added, and a coverslip (22 × 22 mm2) was applied. The pollen grains were counted and identified using an optical microscope. Pollen was identified to family, genus, species or type (grouping several species or genus) accordingly to similarities of the pollen grains morphology. Identification was based on Valdés et al. (Reference Valdés, Diez and Fernández1987) and Moore et al. (Reference Moore, Webb and Collinson1991) and supported by a reference pollen collection hosted at the School of Agriculture, Polytechnic Institute of Bragança.
Landscape metrics
A circular area with radius of 500 m, including the studied non-crop patches, was generated around each olive grove. Data from ‘Carta de Uso e Ocupacão do Solo de Portugal Continental para 2007’ (COS2007) were used to identify the land uses and proportions. The mean perimeter area ratio (MPAR), i.e., the sum of each patch perimeter/area ratio divided by the number of patches (meters/hectare), that quantifies the shape complexity was calculated as landscape configuration index and the Shannon landscape diversity index (SDI) was calculated as landscape composition metric (McGarigal and Marks, Reference McGarigal and Marks1995). The software Patch Analyst for ArcGIS, version 9.3.1 (ESRI, Redlands, California) was used to calculate the landscape indices. Pearson correlation among these two variables was calculated (0.12) to confirm the absence of collinearity problems in further analyses.
Data analysis
All analyses were made in R (R Core Team, 2016).
• Dispersal of P. oleae throughout the different patches
Generalized Linear Models (GLMs) were used to analyze the abundance of P. oleae in the different patches (olive groves, scrublands and herbaceous vegetation) and plots 1, 2, and 3. Accumulated counts of P. oleae were modelled separately for each generation. The negative binomial distribution was applied for the response variable (abundance of P. oleae) to account with overdispersion and glm.nb function from the ‘MASS’ package was used (Venables and Ripley, Reference Venables and Ripley2002). The Log-link was used between the expected value of the response variable and the systematic part of the model. Overall differences among main effects and interactions were checked using the likelihood-ratio chi-square test with Anova function from the ‘car’ package (Fox and Weisberg, Reference Fox and Weisberg2011). Significant differences among interactions were checked using function testInteractions from the ‘phia’ package (de Rosario-Martinez, Reference De Rosario-Martinez2015). Bonferroni P-value adjustment was applied. Following the ‘marginality principle’ when non-null-interactions stood out, main effects were not analyzed (de Rosario-Martinez, Reference De Rosario-Martinez2015). A Tukey test for post hoc analysis was carried out to detect the differences between treatments using the glht function from the ‘multcomp’ package (Hothorn et al., Reference Hothorn, Bretz and Westfall2008). The models were validated plotting the residuals vs. fitted values to assess the homogeneity of the variance. A plot of the residuals vs. each covariate in the model and not in the model was used to investigate model misfit (Zuur et al., Reference Zuur, Ieno, Walker, Saveliev, Smith, Gail, Krickeberg, Samet, Tsiatis and Wong2009).
• Effect of landscape structure on P. oleae abundance
Generalized Estimating Equations (GEEs) were used to analyze the effect of the landscape structure on male P. oleae trap captures (as a proxy for population densities) within the olive groves in order to account with the spatial autocorrelation existing among samples (e.g., Villa et al., Reference Villa, Santos, Mexia, Bento and Pereira2016b). The explanatory variables were: (i) the mean perimeter-area ratio (MPAR) and (ii) the Shannon landscape diversity index (SDI). The response variable was the cumulated count of each generation of P. oleae being each model elaborated for each generation. The variance structure was Poisson type for count data and the relationship between the conditional mean and the systematic component was Log-link. Exchangeable correlation structure was used because the correlation between two observations from the same grove is expected. Data analysis was performed using ‘geepack’ package (Halekoh et al., Reference Halekoh, Højsgaard and Yan2006). The models were validated by plotting the residuals vs. fitted values to assess the homogeneity of the variance. A plot of the residuals vs. each covariate in the model and not in the model was used to investigate model misfit (Zuur et al., Reference Zuur, Ieno, Walker, Saveliev, Smith, Gail, Krickeberg, Samet, Tsiatis and Wong2009).
Results
Patches visited by P. oleae adults
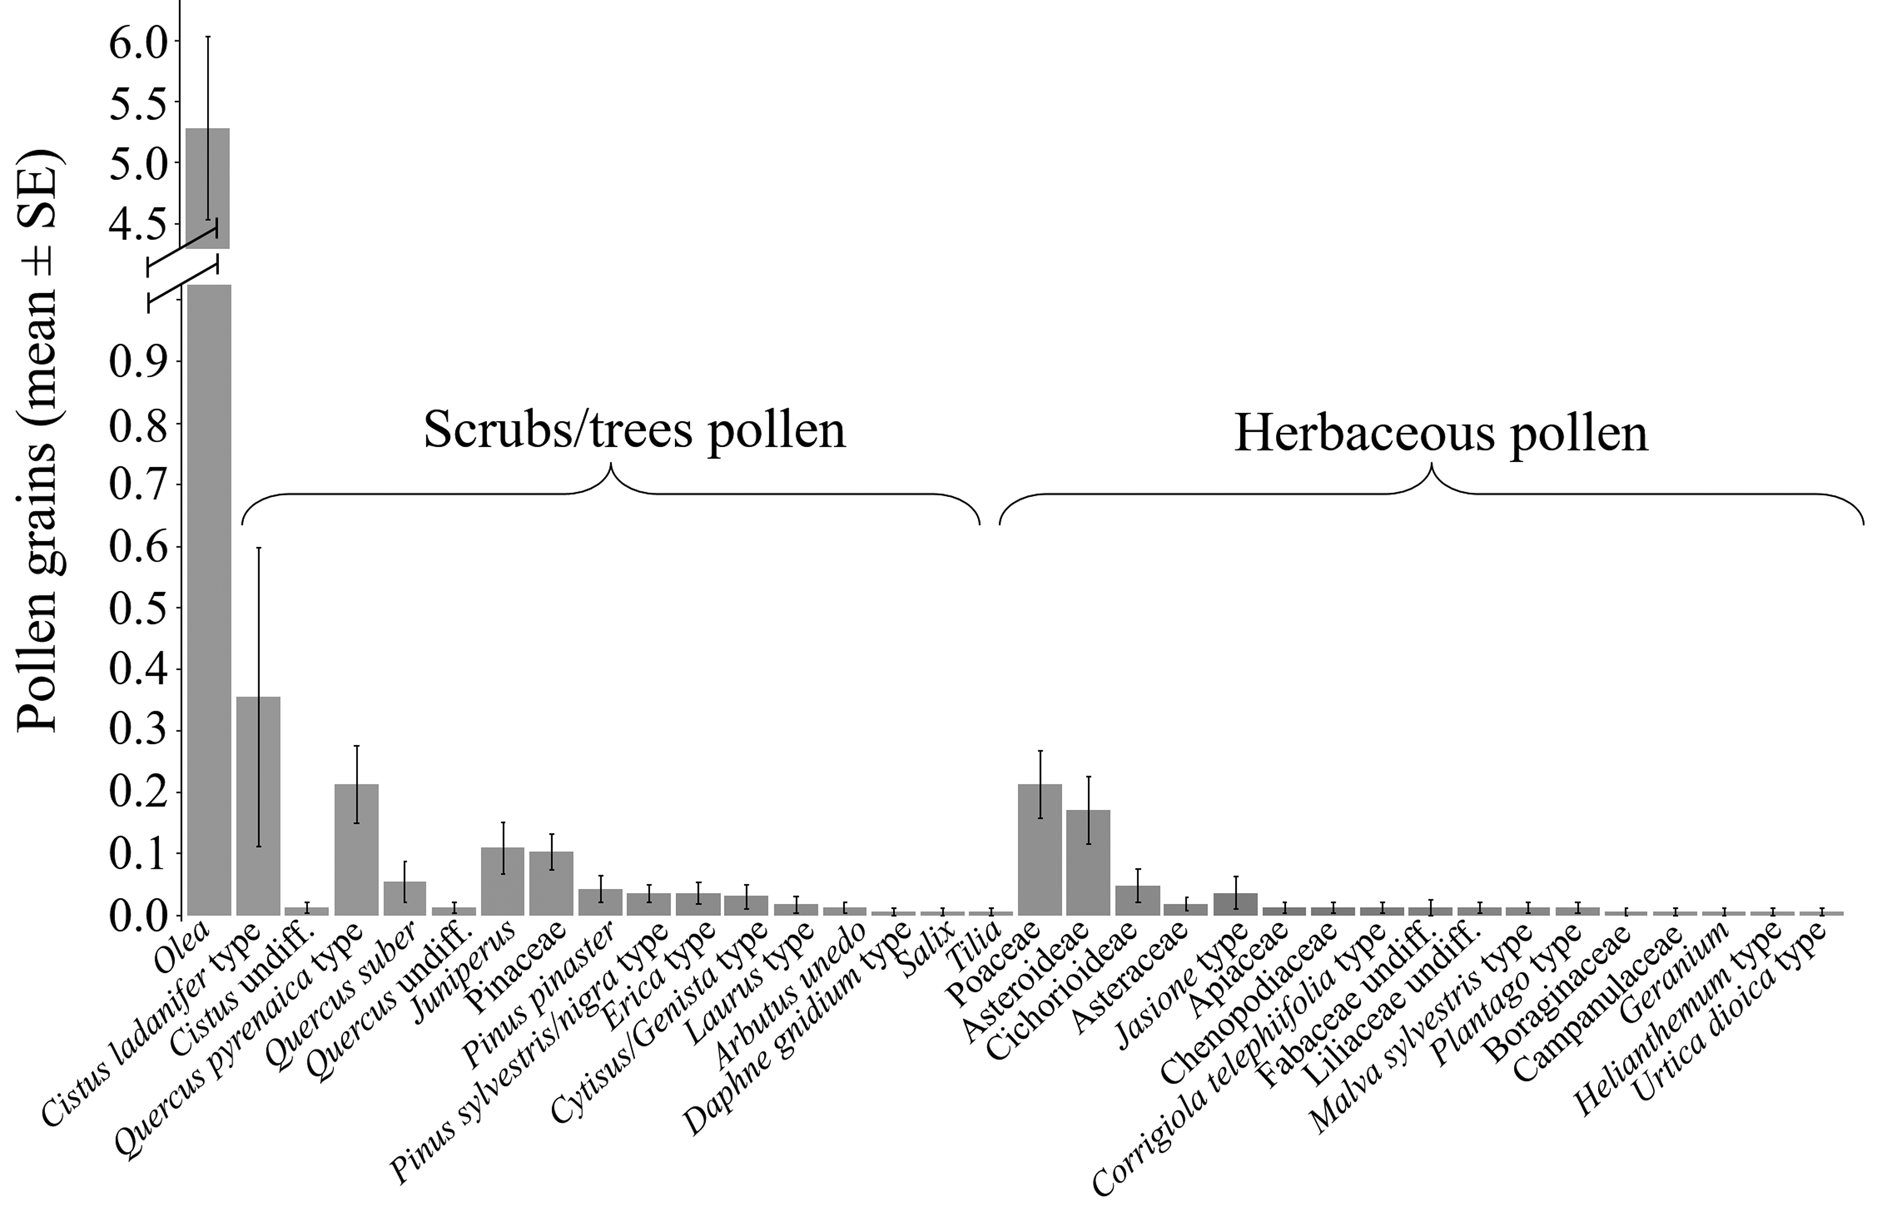
A total of 4, 411 and 65 adults from the phyllophagous, anthophagous and carpophagous generations were captured during 2013. The number of analyzed individuals for the presence of pollen were 4, 232 and 59 for each generation respectively and 1, 160 and 27 had pollen. In the anthophagous generation, a total of 34 pollen types was identified from which 16 belonged to plants only present in the surrounding scrublands or forest (fig. 2) and 18 occurred in the herbaceous ground cover of both olive groves and scrublands or forests. The most abundant pollen type belonged to Olea europaea. Among the scrubs/trees pollen, the most abundant types were Cistus sp., Quercus sp., Juniperus type and several Pinaceae. The most abundant herbaceous families were Poaceae followed by Asteraceae. The number of grains varied between 1 and 69 with a mean of 7 and median of 3. The number of pollen types varied between 1 and 7 with a mean of 2 and median of 1.
Pollen grains (mean ± SE) identified on adults of the anthophagous Prays oleae in 2013.

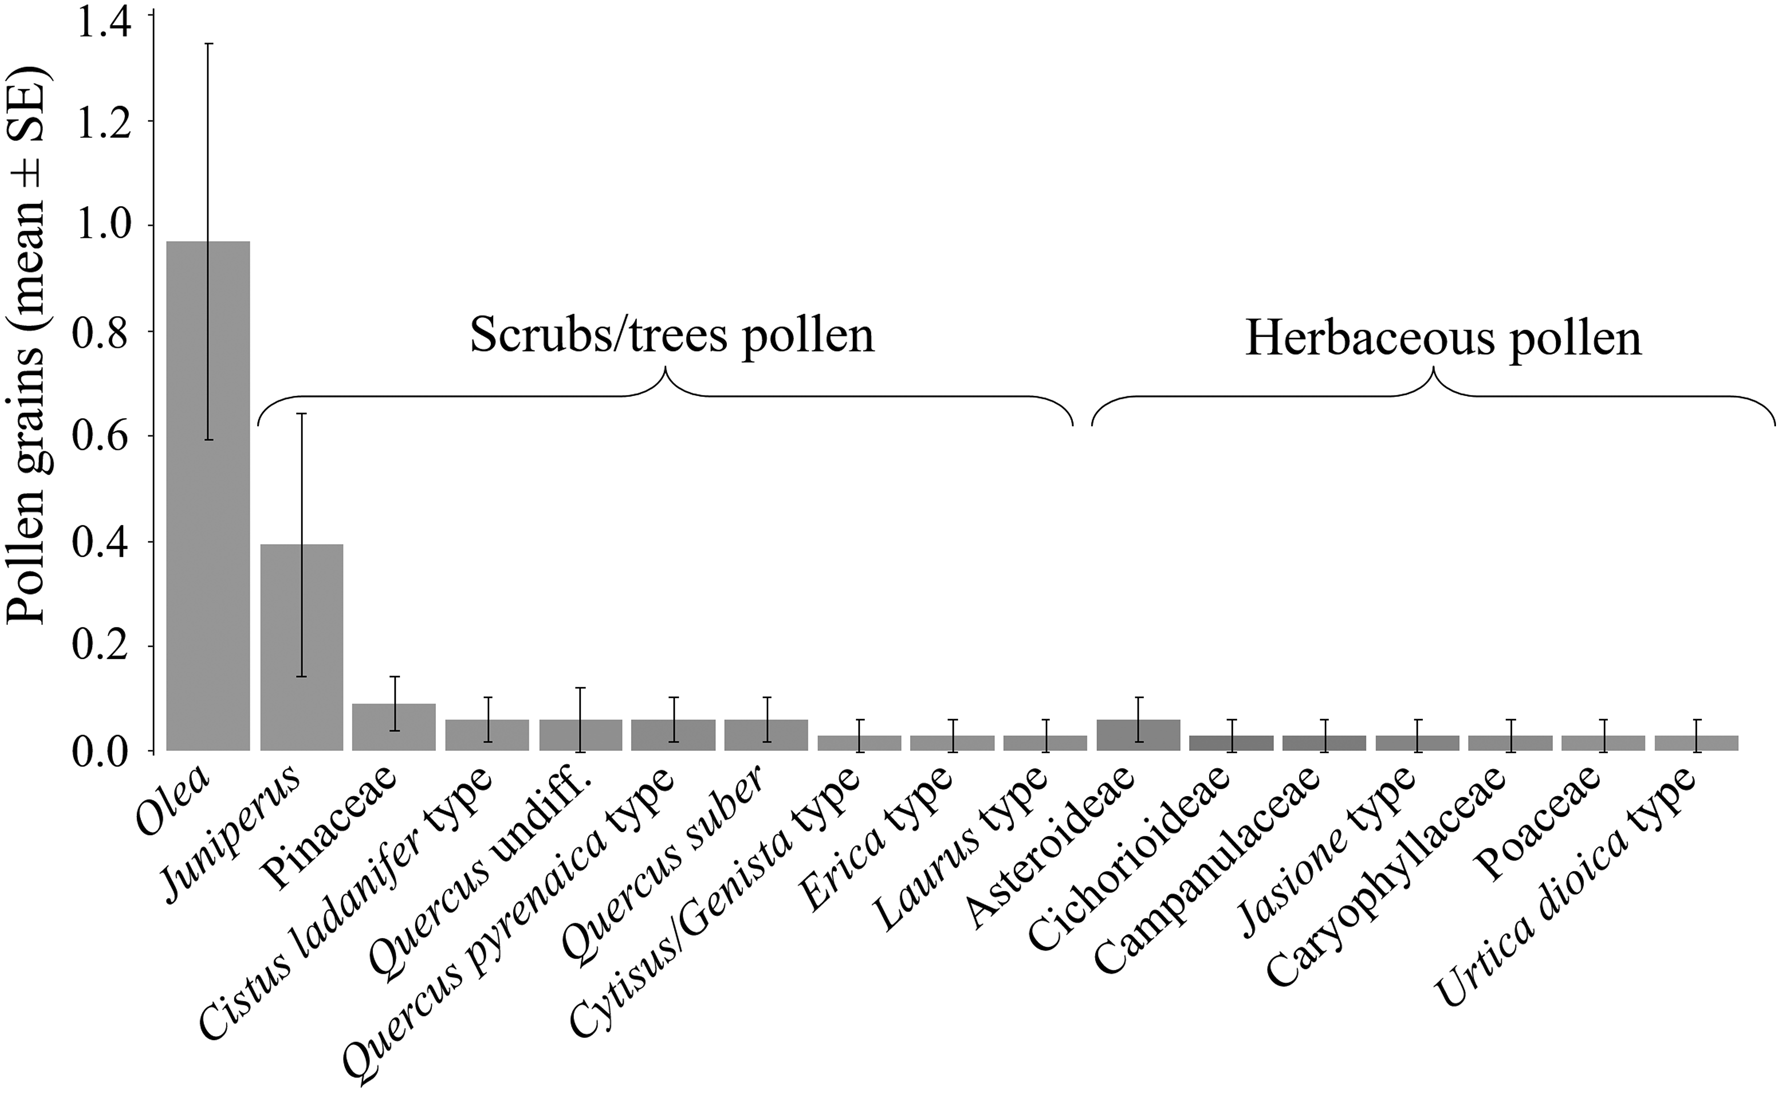
In the carpophagous generation, the total number of pollen types identified was 16 and nine belonged to plants only present in the surrounding scrublands or forests (fig. 3). The most abundant was also the Olea europaea pollen. Among the scrubs/trees pollen the most abundant belonged to Juniperus type followed by Pinaceae family and Quercus sp. The herbaceous pollens were in general low being the most abundant ones belonging to Asteraceae. The number of grains varied between 1 and 13 with a mean of 2 and a median of 1 and the number of pollen types varied between 1 and 3 with a mean and median of 1.
Pollen grains (mean ± SE) identified on adults of the carpophagous Prays oleae in 2013.

Dispersal of P. oleae males throughout the different patches
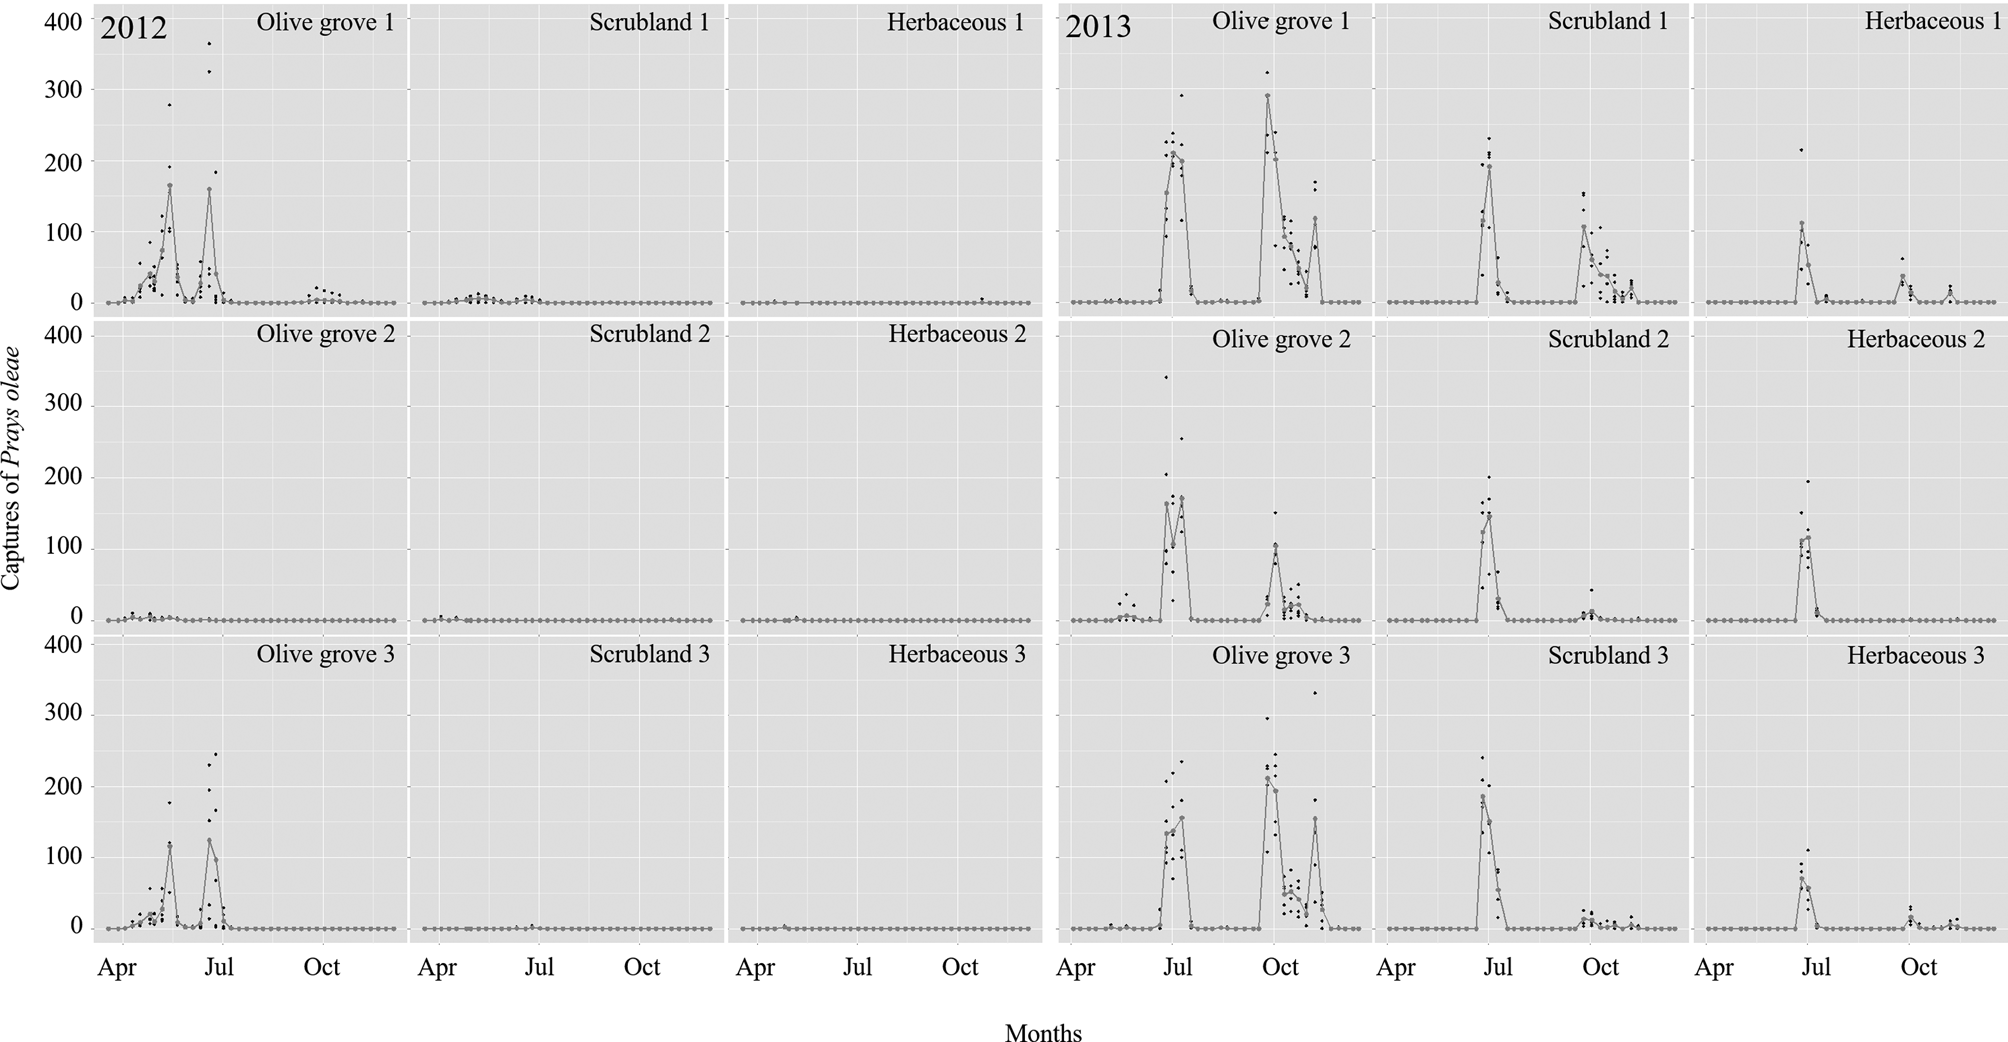
In 2012, the olive groves presented the highest number of captures (a total of 5486 males, with 3006, 2392, and 88 belonging to the phyllophagous, anthophagous and carpophagous generations, respectively) when compared with the other two patches (a total of 39 were captured in herbaceous patches: 30 belonging to the phyllophagous generation, two to the anthophagous generation and seven to the carpophagous generation; and a total of 236 were captured in scrubland patches: zero for the phyllophagous generation, 64 for the anthophagous generation, and five for the carpophagous generation) (fig. 4). The maximum captures in the herbaceous patches and scrublands in all plots were around ten males per trap. Due to the low number of captures (probably due to extreme drought situation that affected Portugal mainland from the winter to summer 2012, being the winter particularly cold in the north, IPMA, 2012), data collected in 2012 was not included in the statistical analysis. The olive grove from plot 1 was the patch with the highest number of captures followed by the groves from plots 3 and 2. In olive groves, the first adults of the phyllophagous generation were captured during April showing a peak in mid-May. The number of captures of males of the anthophagous generation increased during June with a peak at the end of the month. The number of males of the carpophagous generation was very low in all patches (fig. 4).
Number of captures of Prays oleae males in each landscape area (Plots 1, 2, and 3) and patches (olive grove, scrubland and herbaceous vegetation), in 2012 (a) and in 2013 (b). Black points indicate the number of captures of P. oleae males in each delta trap along with the experiment. Grey points indicate the mean number of P. oleae males captured in each date. Grey line represents the flight period of P. oleae males.

In 2013, a total of 16,420 of males were captured in the olive groves (phyllophagous: 153; anthophagous: 7300; carpophagous: 8967), 2814 were captured in herbaceous patches (phyllophagous: 0; anthophagous: 2346; carpophagous: 468) and 6798 in scrublands (phyllophagous: 0, anthophagous: 5071; carpophagous: 1727). The absence of captures for the phyllophagous generation did not allow the statistical analysis. During the anthophagous and carpophagous generations, P. oleae males were captured in all patches (fig. 4). First males of the anthophagous generation were captured at the beginning of June and reached a peak at the beginning of July. The males of the carpophagous generation started to be captured at the end of September and reached a peak at the beginning of October (fig. 4).
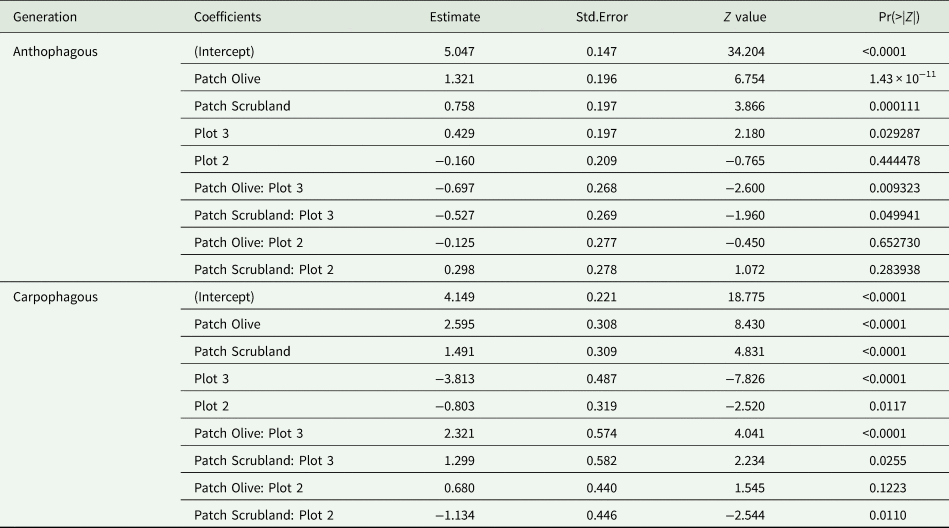
Results for the numerical outputs of the GLM used to fit the anthophagous and carpophagous captures in 2013 as a function of the type of patch and the plot are shown in Table 1.
GLM outputs for the estimated regression parameters and standard errors of captures of the anthophagous and carpophagous generation of Prays oleae in 2013 as a function of the Patch type and the plot

Negative binomial distribution and log-link was used.
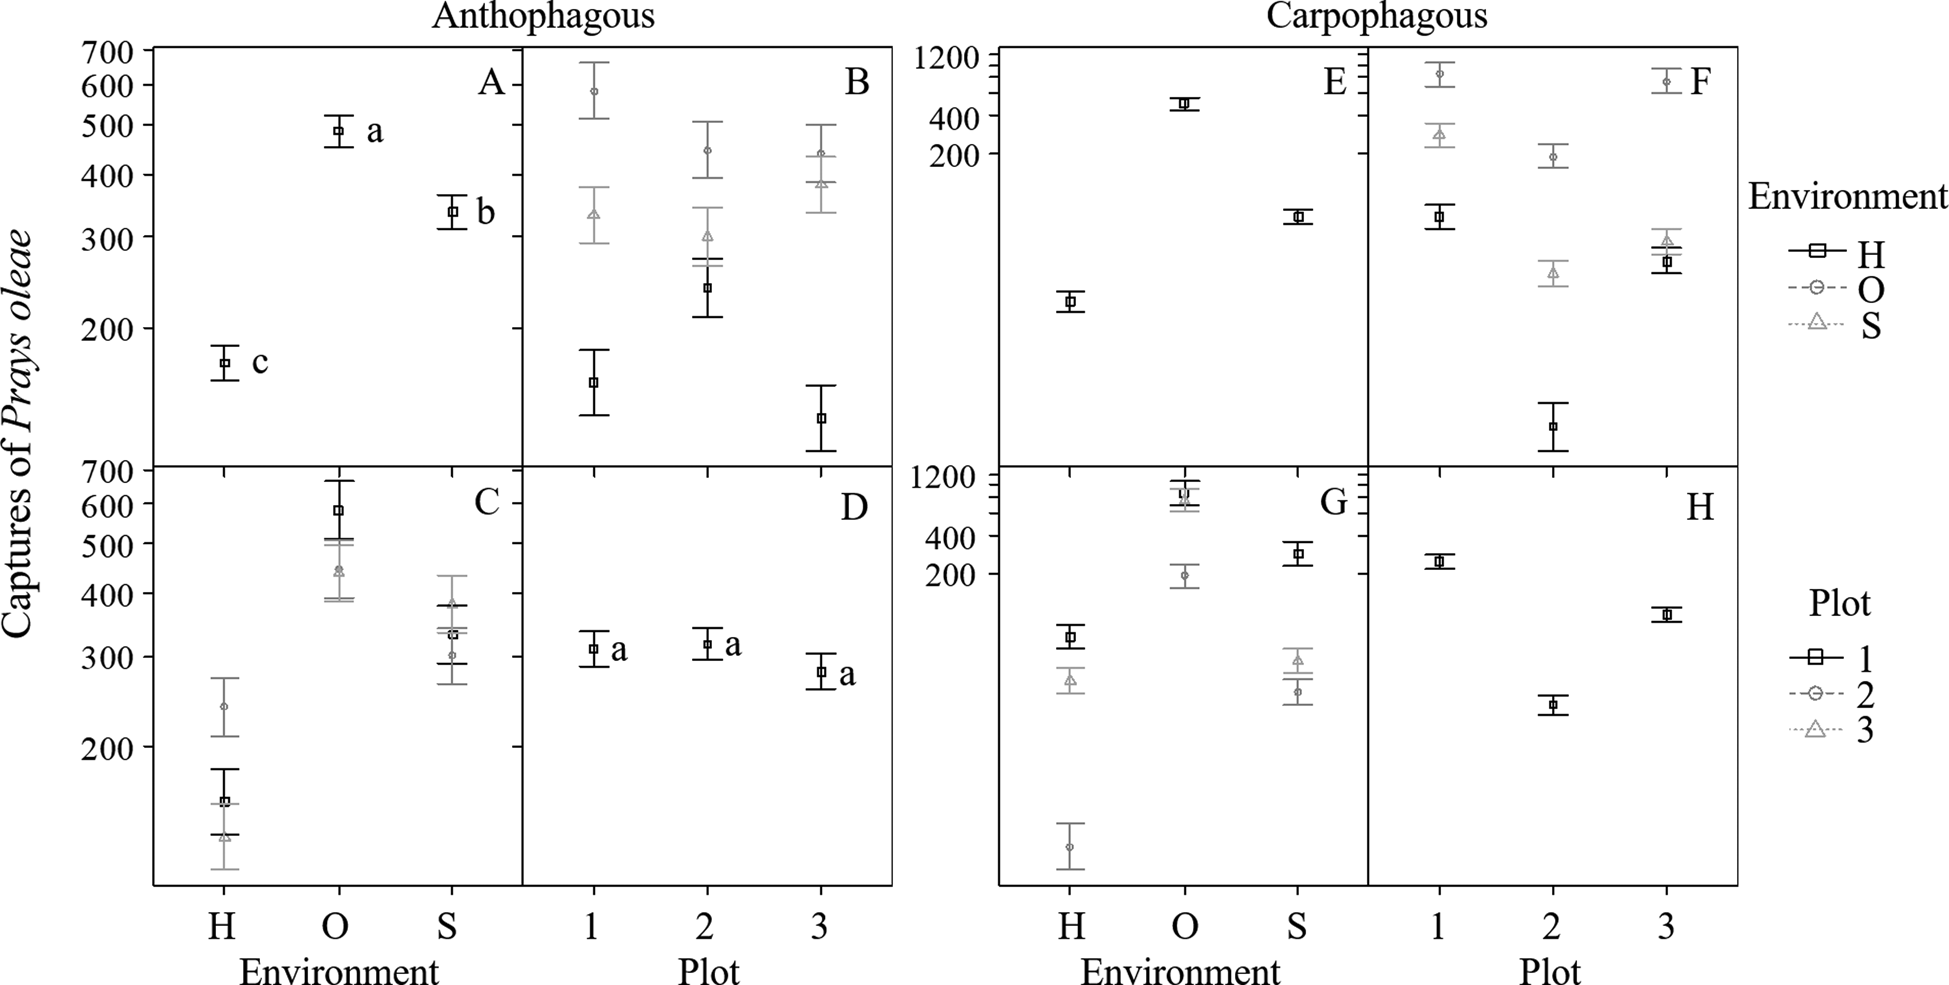
Regarding the captures of the anthophagous generation in 2013, the likelihood ratio test showed that the interaction between patch and plot significantly influenced the abundance of the anthophagous generation of P. oleae (χ2 = 13.709, df = 4, P = 0.008). The differences found between the number of captures in patches with herbaceous vegetation and scrubland were significantly higher in plot 3 than in plot 2, being in both cases lower in herbaceous patches than in scrublands (χ2 = 9.386, df = 1, P = 0.020), but the differences found among patches in the other plots did not significantly differ (χ2 < 6.760, df = 1, P > 0.084 in all cases) (fig. 5). The significance of the interaction was due to one level of the interaction with the value of 0.02, therefore the main effects were also analyzed: the likelihood ratio test showed that the patch (χ2 = 76.999, df = 2, P < 0.0001) significantly influenced the abundance of the anthophagous generation of P. oleae but the plot did not (χ2 = 1.138, df = 2, P = 0.566). The Tukey test for post hoc analysis showed that the number of captures of the anthophagous generation was significantly higher in olive groves, followed by scrublands and herbaceous vegetation patches.
Means (points) and standard errors (bars) for main effects (Patch: A, E/Plot: D, H) and interactions (Patch across Plot: B, F/Plot across Patch: C, G) for the anthophagous (A, B, C, D) and carpophagous (E, F, G, H) generation of Prays oleae in 2013. Different letters in plots for mains effects in the anthophagous generation means significant differences after post-hoc analyses. H: patches with herbaceous vegetation, O: olive groves, S: scrublands.

Regarding the carpophagous generation in 2013, the likelihood ratio test indicated that the interaction between patch and plot significantly affected its abundance (χ2 = 32.555, df = 4, P < 0.0001). The differences between the number of captures were significant: (i) between patches with herbaceous vegetation and olive groves being significantly higher in plot 2 than in plot 1 (χ2 = 16.329, df = 1, P < 0.0001) and plot 3 (χ2 = 8.071, df = 1, P = 0.040), and in all plots higher in olive groves; (ii) between olive groves and scrublands, being significantly higher in plot 3 than in plot 1 (χ2 = 17.407, df = 1, P < 0.0001) and in both plots higher in olive groves; and (iii) between patches with herbaceous vegetation and scrublands, being significantly higher in plot 2 than in plot 3 (χ2 = 17.089, df = 1, P < 0.0001), and in both cases higher in scrublands. The differences found among patches between the other plots were not significant (χ2 < 6.471, df = 1, P > 0.098 in all cases) (fig. 5).
Effect of landscape structure on the abundance of P. oleae males
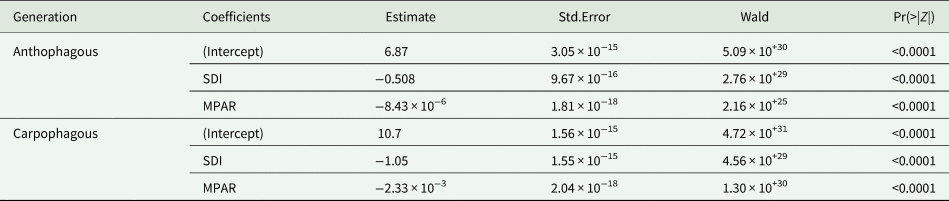
Due to the low number of captures for all generations during 2012 and for the phyllophagous generation during 2013, only the anthophagous and carpophagous generations of 2013 were statistically analyzed. The GEEs fitted for the abundance of P. oleae males as a function of SDI and MPAR showed that the abundance of the pest decreased with the increase of landscape diversity (SDI) and complexity (MPAR) (Table 2).
GEE outputs for the estimated regression parameters and standard errors of captures of the anthophagous and carpophagous generation of Prays oleae as a function of SDI and MPAR

The variance structure Poisson type and the log-link were used. The exchangeable correlation among plot was selected.
Discussion
Results indicated that P. oleae was able to disperse throughout non-crop patches. The GEEs results obtained in 2013 indicated that scrublands and, to a lesser degree, herbaceous patches did not act as physical barriers to the movement of P. oleae males. This was more noticeable during the anthophagous generation, probably due to the favourable weather conditions for P. oleae dispersal during spring. During the carpophagous generation, results depended on the plot, suggesting that other factors related to each site characteristics could influence the dispersal of P. oleae males. The differences found between herbaceous and scrubland patches could be due to several factors such as differences in chemical attraction or resources (shelter sites, food) and further studies should clarify them. The strong differences between years could be possibly related to the weather interannual variations (IPMA, 2012, 2013).
Additionally, the anthophagous generation presented higher amounts of pollen, corresponding with the flowering peak of many plants. The most abundant pollen type belonged to the olive tree, where the adults were captured. The presence of several pollen grains from scrubs and other trees suggested that P. oleae could penetrate into non-crop habitats, in agreement to the results showed by the GEEs. Paredes et al. (Reference Paredes, Cayuela, Gurr and Campos2015) found that the abundance of P. oleae in olive groves decreased with the presence of areas of herbaceous vegetation and areas of woody vegetation within olive groves. However, it is unknown if the capability of P. oleae to penetrate non-olive patches surrounding the groves is positive, negative or null for its dispersal toward other olive groves. Moreover, in this study, males flew into non-crop patches attracted by pheromones in delta traps and they could have been artificially pulled from the border of the grove into the surroundings. In natural conditions, the capability of P. oleae pheromones to spread into non-crop patches from olive groves and of P. oleae males to detect them may influence the direction and size of the effect. Other aspects, such as the mortality risk on landscape elements (patches) (Tischendorf and Fahrig, Reference Tischendorf and Fahrig2000), the chemical attraction performed by other olive groves or the influence of non-crop habitats features, such as size, complexity or composition also needs to be addressed. Importantly, further studies should analyze the potential pollen transfer by the wind from surrounding patches into the olive groves (by analysing pollen grains on olive tree leaves), and their potential presence on the body of olive moths. This will allow to conclude that the olive moth collected in the olive grove could be contaminated with pollen from the surrounding patches.
Within the non-crop patches, the vegetation may affect the pest through different processes: directly, through the disruption of the capability to locate suitable host plants, repelling or trapping it, blocking movements or altering the volatile profile of crop plants, or indirectly through increasing the action of natural enemies (Gurr et al., Reference Gurr, Wratten, Landis and You2017). Prays oleae is a synovigenic species and needs to feed for laying eggs (Villa et al., Reference Villa, Marrão, Mexia, Bento and Pereira2016a) but it is unknown if it can find food in a non-crop patch while dispersing to other olive groves. Additionally, in this study, male captures were used as a proxy of the whole population, therefore it is not demonstrated that females flew across the non-crop patches. This pest could also be attacked by predators in the non-crop patches. Multiple studies described the increase of the action of natural enemies with herbaceous and wooded habitats as well as landscape patchiness (Bianchi et al., Reference Bianchi, Booij and Tscharntke2006 and reference therein). In the olive grove agroecosystem, herbaceous and woody vegetation areas near and within olive groves were found to decrease the abundance of P. oleae and E. olivina (Paredes et al., Reference Paredes, Cayuela, Gurr and Campos2013b). Paredes et al. (Reference Paredes, Cayuela and Campos2013a) showed that herbaceous and large woody vegetation patches adjacent to the crop influence the abundance of natural enemies, and this effect was modulated by the ground cover. Moreover, movements of arthropods across the landscape are related to their ability of dispersal. For example, the olive fruit fly abundance was affected by the landscape structure at scales ranging from 600 m to 2000 m and this was attributed to long-distance flights (Ortega et al., Reference Ortega, Pascual and Rescia2016). To our knowledge, the P. oleae flight has not been characterized yet.
In relation to the effect of landscape structure on the abundance of P. oleae males, the GEEs showed that both composition and configuration affected the pest. The diminution of the abundance of P. oleae males in olive groves in both anthophagous and carpophagous generations at radii of 500 m was related with the increase in the landscape biodiversity (SDI) and complexity (MPAR). A high percentage of studies found lower pest pressure in complex landscapes (Bianchi et al., Reference Bianchi, Booij and Tscharntke2006) and particularly in olive grove agroecosystems, B. oleae captures at short distances were related to several complexity parameters (Ortega and Pascual, Reference Ortega and Pascual2014). Also, soil cover crops strongly improved the diversity of arthropods in olive groves, along with variables such as the diversity of the plant community and Shannon index of the landscape (Carpio et al., Reference Carpio, Castro and Tortosa2019). In contrast, in a meta-analysis, natural enemies were positively related with landscape complexity but pest abundances did not show a significant response (Chaplin-Kramer et al., Reference Chaplin-Kramer, O’ Rourke, Blitzer and Kremen2011), highlighting the need of further research with different organisms and agroecosystems. Different spatial scales could modify P. oleae response to landscape features as well.
The connectivity of a landscape depends on several factors, such as the landscape structural connectivity, the dispersal ability of the species, and the non-habitat restrictions to the species dispersal. Therefore, relationships between landscape structure and connectivity need to be analyzed together (Tischendorf and Fahrig, Reference Tischendorf and Fahrig2000). In this study, despite the fact that P. oleae was able to cross over non-crop patches, the increase of landscape biodiversity and complexity was related to pest reduction. The landscape biodiversity and complexity can be increased through the fragmentation of P. oleae habitat, i.e. a higher number of smaller olive groves. These results indicate that overall management of olive growing areas (e.g. reducing olive grove size and increasing the within groves natural areas) instead of local land management could contribute to the olive moth regulation.
In sum, this study provides new data that contributes to the knowledge about P. oleae dispersal and movement between patches indicating that P. oleae was able to spread over scrublands and herbaceous patches. Additionally, more complex and heterogeneous landscapes, where different interactions among pests, natural enemies and landscape may occur, presented less number of captures, giving new insights for integrated pest management of the olive moth.
Acknowledgements
The authors are grateful to the Portuguese Foundation of Science and Technology for financial support through the project EXCL/AGR-PRO/0591/2012 ‘Olive crop protection in sustainable production under global climatic changes: linking ecological infrastructures to ecosystem functions’, and financial support by national funds FCT/MCTES to CIMO (UIDB/00690/2020). Maria Villa thanks to FCT, POPH-QREN and FSE for the Post-Doc grant (SFRH/BPD/119487/2016).