The increasing discharge of industrial wastewater poses a serious threat to aquatic ecosystems and environmental sustainability (Mu et al., Reference Mu, Liu, Chen, Wang and Yang2020). Among industrial sectors, the textile industry is a major contributor to water pollution due to its extensive use of synthetic dyes that are often toxic, persistent and resistant to biodegradation (Jamee & Siddique, Reference Jamee and Siddique2019; Negi, Reference Negi2025). The release of such contaminants into natural water resources highlights the urgent need for environmentally friendly and sustainable materials capable of interacting effectively with water and dissolved pollutants (Weerasundara et al., Reference Weerasundara, Gabriele, Figoli, Ok and Bundschuh2021; Kumar et al., Reference Kumar, Gusain, Pandey and Ray2023).
Hydrogels are three-dimensional polymeric networks capable of adsorbing and retaining large amounts of water without dissolving owing to their crosslinked structure (Fig. 1; Guo et al., Reference Guo, Bae, Fang, Li, Zhao and Yu2020; Rao et al., Reference Rao, Chvs, Yamini and Prasad2021). This unique swelling behaviour has enabled hydrogels to find widespread applications in diverse fields, including biomedical engineering, agriculture and environmental technologies. In particular, hydrogel-based systems have attracted attention for use in water-related applications because their swelling capacity, porosity and diffusion behaviour can be tailored through polymer selection and crosslinking density (Kaplan & Güner, Reference Kaplan and Güner2000a; Sharma et al., Reference Sharma, Thakur, Naushad, Kumar, Stadler, Alfadul and Mola2018; Guo et al., Reference Guo, Bae, Fang, Li, Zhao and Yu2020; Jayakumar et al., Reference Jayakumar, Jose and Lee2020; Nanda et al., Reference Nanda, Behera, Pattnaik and Behera2025).
Schematic illustration of dextran crosslinking with epichlorohydrin (EPI; Kenari et al., Reference Kenari, Imani, Dashtimoghadam, Maleki, Nyström and Nodehi2013).

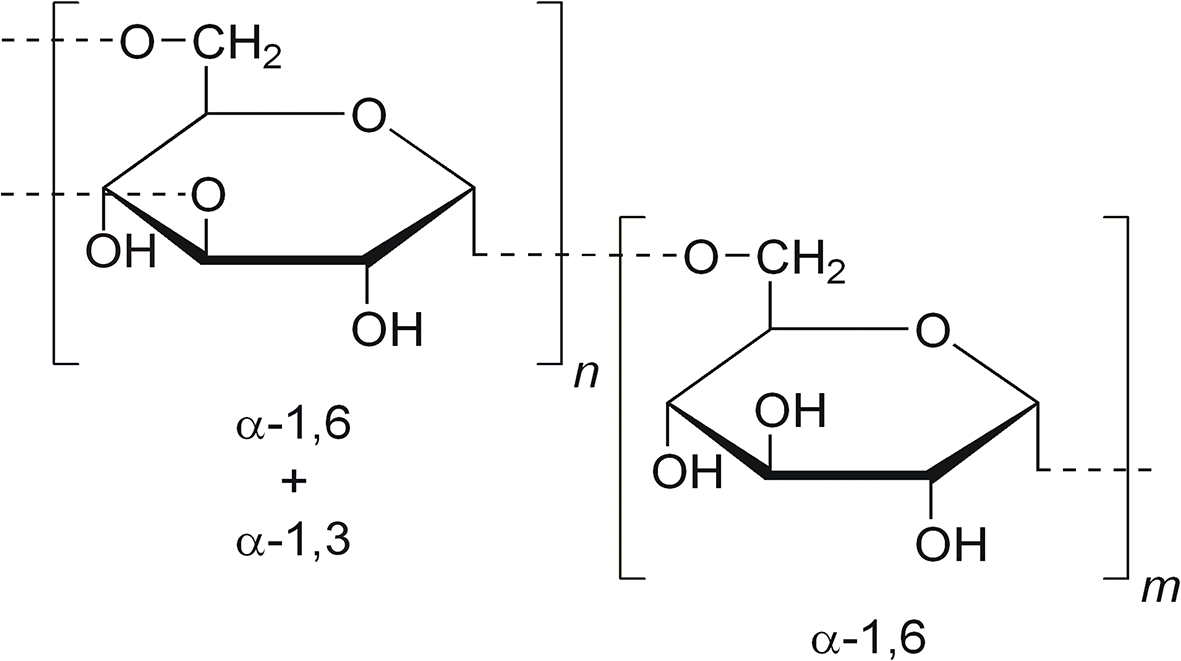
Dextran (DEX) is a naturally derived polysaccharide composed of α-1,6-linked glucose units, and it is known for its biocompatibility, biodegradability and high affinity for water (Fig. 2; Wang et al., Reference Wang, Dijkstra, Karperien, Neves and Reis2016). Owing to these properties, DEX-based hydrogels have been extensively investigated in biomedical applications and, more recently, explored for environmentally oriented systems (Maia et al., Reference Maia, Evangelista, Gil, Ferreira and Gil2014; Stanciu & Teacă, Reference Stanciu and Teacă2024; Wagh et al., Reference Wagh, Bhattacharya and Singh2026). The chemical modification and crosslinking of DEX chains enable the formation of stable hydrogel networks whose physicochemical properties can be systematically controlled (Das & Pal, Reference Das and Pal2015; Muir & Burdick, Reference Muir and Burdick2020). However, the relatively the soft and flexible nature of the hydrogel structure of polysaccharide-based hydrogels may limit their structural stability under certain conditions, necessitating the use of reinforcement strategies (Li & Lin, Reference Li and Lin2021; Berradi et al., Reference Berradi, Aziz, Achaby, Ouazzani and Mandi2023).
Chemical structure of the dextran polymer.

Halloysite is a naturally occurring aluminosilicate clay mineral characterized by a hollow tubular morphology, a high aspect ratio and chemically distinct inner and outer surfaces (halloysite nanotubes, or HNTs; Fig. 3). Their external siloxane surface groups and internal aluminol groups provide abundant interaction sites for polymer chains and dissolved molecules, making HNTs attractive nanofillers for the development of functional polymer–clay nanocomposites (Akar & Kaplan Can, Reference Akar and Kaplan Can2025; Akar et al., Reference Akar, Şahin and Kaplan Can2025). In hydrogel systems, HNT incorporation can improve structural stability, modify pore architecture, increase surface heterogeneity and influence water diffusion pathways within the polymeric network (Nguyen et al., Reference Nguyen, Trang and Kobayashi2019; Abdullah & Dong, Reference Abdullah and Dong2020).
Structural model of halloysite nanotubes (de Oliveira & Beatrice, Reference de Oliveira, Beatrice and Sivasankaran2018).

Figure 3 Long description
The diagram consists of two parts. On the left, a schematic representation of the atomic structure of halloysite nanotubes is shown. It includes layers labeled as inner surface OH, inner OH, Al atoms, Si atoms and H subscript 2 O molecules. The inner surface OH is marked with a red circle, inner OH with a blue circle, Al atoms with an orange circle, Si atoms with a gray circle and H subscript 2 O molecules with a white circle. The layers are arranged vertically, indicating the tubular structure. On the right, an illustration of a halloysite nanotube is depicted as a rolled tubular structure. The external siloxane surface is labeled as Si dash O dash Si and the internal aluminol surface is labeled as Al dash OH. The diagram highlights the distinct chemical surfaces of the nanotube, emphasizing the external siloxane and internal aluminol groups.
Previous studies have demonstrated the potential of HNTs as reinforcing and functional fillers in polymer matrices, particularly for improving mechanical stability, thermal resistance, adsorption behaviour and interaction capacity with organic molecules (Kausar, Reference Kausar2018; Idumah et al., Reference Idumah, Hassan, Ogbu, Ndem and Nwuzor2019; Cheng et al., Reference Cheng, Song, Zhao and Zhang2020). HNT-containing biopolymer systems have also been considered promising for aqueous remediation applications because of their low toxicity, natural origin and environmentally compatible character (Yu et al., Reference Yu, Wang, Zhang, Zhang and Liu2016; Idumah et al., Reference Idumah, Hassan, Ogbu, Ndem and Nwuzor2019; Hamza, Reference Hamza2021). However, most studies have focused either on the effect of inorganic filler incorporation or on polymer network structure separately. A systematic understanding of how crosslinking density and HNT incorporation jointly affect swelling behaviour, diffusion kinetics, pore accessibility and dye adsorption performance in DEX-based hydrogels remains limited.
In this study, DEX-based hydrogels with two different crosslinking densities were synthesized through epichlorohydrin (EPI)-mediated crosslinking and reinforced with HNTs. Accordingly, four hydrogel formulations (2DEX, 2DEX-HNT, 4DEX and 4DEX-HNT) were designed to systematically elucidate the individual and combined influences of crosslinking density and HNT incorporation on hydrogel performance. A comprehensive characterization strategy was employed to assess the chemical structure, morphology, porous characteristics, swelling behaviour, diffusion kinetics and methylene blue adsorption performance of the prepared hydrogel systems. By correlating network architecture, transport behaviour and adsorption capacity, this work aims at providing a clearer structure–property–performance relationship for DEX/HNT nanocomposite hydrogels designed for aqueous dye remediation.
Materials and methods
Materials
DEX (molecular weight = 200,000–225,000 g mol–1) was used as the base polymer for hydrogel synthesis and was purchased from Sigma-Aldrich. EPI, employed as the chemical crosslinking agent, was obtained from Sigma-Aldrich. N,N,N′,N′-Tetramethylethylenediamine (TEMED), used as an accelerator for the crosslinking reaction, and sodium hydroxide (NaOH), utilized to adjust and maintain alkaline reaction conditions, were purchased from Sigma-Aldrich. HNTs, used as inorganic reinforcing fillers for the preparation of nanocomposite hydrogels, were also obtained from Sigma-Aldrich. All chemicals were used as received without further purification.
Hydrogel synthesis
DEX-based hydrogels were synthesized via EPI-mediated crosslinking under alkaline conditions. Briefly, DEX (4 g) was dissolved in 25 mL of 2.8 M NaOH solution and stirred for 24 h to ensure complete dissolution and swelling of the polymer chains. For HNT-containing formulations, HNTs corresponding to 30 wt.% DEX were first dispersed in 4 mL of distilled water by stirring for 3 h and then added to the DEX solution. An additional 3 h stirring period was applied to promote homogeneous dispersion of HNTs within the polymer matrix.
After preparation of the DEX or DEX/HNT mixtures, EPI was added as the crosslinking agent at either 2 or 4 mL depending on the targeted crosslinking density. TEMED (2 mL) was then added to each formulation, and the reaction mixtures were stirred at 50–55°C until gelation occurred, typically within 15–20 min. Subsequent purification was carried out by immersing the hydrogels in distilled water for 24 h to remove unreacted species and residual reagents, followed by drying at room temperature, until constant weight was achieved. Formulation details of the prepared hydrogel samples are summarized in Table 1. The obtained hydrogels, including 2DEX, 2DEX-HNT, 4DEX and 4DEX-HNT, are shown in their synthesized and dried forms in Fig. 4.
Formulation details of DEX-based hydrogel systems.

Table 1 Long description
Formulations are listed by sample name with columns for DEX amount in grams, NaOH solution volume and molarity, HNT content in weight percent, and EPI amount in milliliters. Sample 2DEX has DEX amount 4 g, NaOH solution 25 mL at 2.8 M, HNT content shown as a dash, and EPI amount 2 mL. Sample 2DEX-HNT has DEX amount 4 g, NaOH solution 25 mL at 2.8 M, HNT content 30 wt.%, and EPI amount 2 mL. Sample 4DEX has DEX amount 4 g, NaOH solution 25 mL at 2.8 M, HNT content shown as a dash, and EPI amount 4 mL. Sample 4DEX-HNT has DEX amount 4 g, NaOH solution 25 mL at 2.8 M, HNT content 30 wt.%, and EPI amount 4 mL.
(a) Synthesized and dried form of the low-crosslinked-density hydrogel (2DEX). (b) Synthesized and dried form of the low-crosslink-density DEX/HNT composite hydrogel (2DEX-HNT). (c) Synthesized and dried form of the high-crosslink-density hydrogel (4DEX). (d) Synthesized and dried form of the high-crosslink-density DEX/HNT composite hydrogel (4DEX-HNT).

Methylene blue adsorption experiments
Methylene blue adsorption experiments were conducted to evaluate the dye removal performance of the prepared hydrogel systems. A stock methylene blue solution was prepared by dissolving 1 g of dye in 1 L of distilled water. Standard solutions at concentrations of 10, 20, 30, 40 and 50 mg L–1 were then prepared from this stock solution for calibration. Following 100-fold dilution to maintain absorbance within the linear range, absorbance measurements were recorded at 665 nm using a ultraviolet–visible (UV–Vis) spectrophotometer. A calibration curve was constructed in the form of y = ax + b, where y represents absorbance and x represents methylene blue concentration.
For adsorption experiments, dried hydrogel samples (2DEX, 2DEX-HNT, 4DEX and 4DEX-HNT, 50 mg each) were immersed in 25 mL of methylene blue solution with an initial concentration of 50 mg L–1 and kept under shaking conditions for 24 h. Adsorption equilibrium was verified by monitoring residual methylene blue concentration at various contact times. Time-dependent measurements showed a progressive decrease in concentration during the early adsorption stage, followed by a plateau at later time points. Negligible variation between the final measurements confirmed that equilibrium was reached within 24 h.
After adsorption, aliquots withdrawn from each solution were diluted 100-fold with distilled water prior to analysis. Residual methylene blue concentrations were determined from the calibration curve, and the amount of adsorbed dye was calculated by comparing the initial and final concentrations.
Characterization and swelling studies
Structural and morphological characterization
The structural, morphological and porous characteristics of the synthesized DEX-based hydrogels were investigated with attenuated total reflectance Fourier-transform infrared (ATR-FTIR) spectroscopy, scanning electron microscopy (SEM) and nitrogen adsorption–desorption analysis. Specific surface area and pore-volume and pore-size distribution measurements were also performed for the HNT-containing systems to evaluate the influence of halloysite incorporation and crosslinking density on porous architecture.
ATR-FTIR spectra were recorded using a PerkinElmer Spectrum 400 FTIR spectrometer equipped with an ATR accessory. Measurements were carried out in the wavenumber range of 4000–400 cm–1 with a spectral resolution of 4 cm–1 and 16 scans per sample. The obtained spectra were analysed to confirm chemical crosslinking, functional group interactions and the successful incorporation of HNTs into the DEX hydrogel network.
The surface morphology and microstructural features of the hydrogels were examined using a FEI Quanta 400F field-emission scanning electron microscope (FESEM). Prior to imaging, the hydrogel samples were prepared according to standard SEM sample preparation procedures. SEM images were used to evaluate pore structure, surface roughness and the distribution of HNTs within the polymer matrix.
Nitrogen adsorption–desorption measurements were performed using an AUTOSORB-1C/MS surface characterization analyser. Burnauer–Emmett–Teller (BET) specific surface area and pore-size distribution analyses were carried out for the HNT-containing hydrogel systems. Prior to nitrogen adsorption–desorption analysis, the samples were degassed at 60°C overnight (∼12 h) under vacuum to remove physically adsorbed moisture and volatile species. The obtained adsorption–desorption isotherms were used to evaluate the specific surface area and pore-volume and pore-size distribution characteristics of the hydrogel structures. Specific surface area was determined using the multipoint BET method, while pore-size distribution and pore-volume parameters were evaluated using Barrett–Joyner–Halenda (BJH), Dollimore–Heal (DH), Dubinin–Radushkevich (DR), Horváth–Kawazoe (HK) and Saito–Foley (SF) methods.
Swelling experiments
The swelling behaviour of the hydrogels was evaluated to determine their water absorption capacity and swelling kinetics. Dried hydrogel samples were immersed in distilled water at room temperature. At predetermined time intervals (2, 5, 10, 30 and 60 min and longer durations), the samples were removed from the solution, gently blotted to remove excess surface water and weighed.
These measurements were performed to assess the effects of crosslinking density and HNT incorporation on the swelling capacity of the hydrogels (Kaplan & Güner, Reference Kaplan and Güner2000a). The swelling process was further analysed in terms of diffusion behaviour, which involves water diffusion into the polymer network, relaxation of polymer chains and attainment of equilibrium. Swelling kinetics were interpreted using Fick’s second law of diffusion. Based on the swelling exponent (n) obtained from kinetic analysis, the diffusion mechanism was classified as Fickian (diffusion-controlled, n ≤ 0.5) or non-Fickian (anomalous transport involving simultaneous diffusion and polymer chain relaxation; Schott, Reference Schott1992; Kaplan & Güner, Reference Kaplan and Güner2000a,Reference Kaplan and Günerb). The influence of crosslinking density and HNT content on the diffusion behaviour of the hydrogels was systematically evaluated.
Results and discussion
ATR-FTIR spectroscopy
The proposed crosslinking reaction mechanism between DEX and EPI under alkaline conditions, investigated by ATR-FTIR spectroscopy, is schematically illustrated in Fig. 5. In the presence of NaOH, hydroxyl groups of DEX are deprotonated to form alkoxide ions, which act as nucleophiles and attack the epoxide ring of EPI. This ring-opening reaction results in the formation of ether linkages, and subsequent intermolecular reactions lead to the formation of a three-dimensional crosslinked DEX network. Therefore, the formation of C–O–C ether bridges represents the key structural evidence expected to confirm the proposed mechanism.
Crosslinking reaction of DEX with EPI under alkaline conditions.

Figure 5 Long description
Dextran is shown as a repeating sugar unit with multiple hydroxyl groups and a subscript n. A first reaction line shows dextran plus sodium hydroxide yields a dextran oxygen with a negative charge paired with sodium, plus water. A second reaction line shows this dextran oxygen with a negative charge paired with sodium plus epichlorohydrin, drawn with an epoxide ring and a chloromethyl group, yielding a dextran oxygen bonded to a three carbon chain that includes an opened epoxide and a chlorine substituent. A subsequent reaction line shows formation of a linkage between two dextran chains through an oxygen to carbon bond, with sodium chloride written as a byproduct. The final structure is labeled, crosslinked dextran and shows two dextran repeating units connected by an ether type oxygen bridge through a carbon chain. Reaction coefficients and physical state symbols are not shown.
The characteristic FTIR bands of DEX were clearly observed in all samples (Fig. 6). A broad absorption band centred at ∼3330–3340 cm–1 corresponds to the stretching vibrations of hydroxyl (–OH) groups present in the DEX backbone. Following crosslinking, slight variations in the intensity and width of this band were observed, indicating partial consumption and involvement of hydroxyl groups in the crosslinking reaction, consistent with alkoxide formation and ether bond generation (Fig. 5). Bands observed at ∼2937 cm–1 are attributed to aliphatic C–H stretching vibrations originating from both DEX and EPI segments.
ATR-FTIR spectra of (a) low-crosslink-density DEX hydrogels (2DEX and 2DEX-HNT) and (b) high-crosslink-density DEX hydrogels (4DEX and 4DEX-HNT).

Figure 6 Long description
Four overlaid ATR FTIR transmittance spectra with a legend listing DEX, EPI, HNT and 2DEX HNT. The x-axis is labeled, Wavenumber (centimeter superscript minus 1), with tick labels at 4000, 3500, 3000, 2500, 2000, 1500, 1000 and 500. The y-axis is labeled, Transmittance (percent), with no numeric tick labels visible. Each spectrum contains multiple downward dips. Numeric annotations marking dip positions include 3337, 2937, 1648, 1450, 1154, 1021, 945, 894, 797, 694, 540 and 470. The image B showing four overlaid ATR FTIR transmittance spectra with a legend listing DEX, EPI, HNT and 4DEX HNT. The x-axis is labeled, Wavenumber (centimeter superscript minus 1), with tick labels at 4000, 3500, 3000, 2500, 2000, 1500, 1000 and 500. The y-axis is labeled, Transmittance (percent), with no numeric tick labels visible. Each spectrum contains multiple downward dips. Numeric annotations marking dip positions include 3330, 2937, 1640, 1450, 1077, 1033, 915, 797, 694, 540 and 470.
For the low-crosslinked DEX hydrogel (2DEX), the appearance of bands of increased intensity in the 1200–1000 cm–1 region is associated with C–O and C–O–C stretching vibrations, indicating the formation of ether linkages between DEX chains via EPI (Fig. 6a). In particular, the band observed near 1020 cm–1 is highly indicative of newly formed C–O–C bridges between glucose units, providing direct spectroscopic confirmation of the crosslinking mechanism (Fig. 5). The increased intensity of this band compared to that of pristine DEX reflects successful network formation. A weak band at ∼1750 cm–1 may be attributed to carbonyl-containing structures formed during side-reactions under alkaline conditions or associated with residual species, although its contribution remains limited and does not dominate the reaction pathway. The band near 880–925 cm–1 corresponds to vibrations of anomeric carbon atoms in the DEX structure, confirming the preservation of the polysaccharide backbone after chemical modification.
In addition, the band at ∼1440–1450 cm–1 observed in some hydrogel formulations can be attributed primarily to CH2 bending (scissoring) vibrations associated with the DEX backbone and EPI-derived segments. The relatively high intensity of this band in the crosslinked and HNT-containing hydrogels suggests changes in the local chemical environment of the polymer chains following crosslinking and halloysite incorporation. This observation further supports the successful structural modification of the DEX network.
Upon incorporation of HNTs (2DEX-HNT), additional spectral features appeared in the FTIR spectra (Fig. 6a). The bands observed at ∼1118–1120 cm–1 are assigned to the Si–O–Si stretching vibrations of halloysite, confirming the successful incorporation of HNT into the polymer matrix. Furthermore, the deformation band near 916 cm–1 corresponds to inner-surface hydroxyl groups of the HNTs. The overlap of DEX-derived C–O–C vibrations with the Si–O–Si bands in the 1200–1000 cm–1 region suggests strong spectral superposition and indicates close interfacial contact between the inorganic nanotubes and the organic polymer network. Importantly, the presence of halloysite-specific bands without disruption of ether-related peaks confirms that HNT incorporation occurs without interfering with the fundamental crosslinking mechanism.
In the high-crosslinked hydrogels (4DEX), characteristic aliphatic C–H stretching bands observed at 2939 and 2877 cm–1 and the C–O–C stretching band near 1020 cm–1 confirm the presence of the DEX-based crosslinked network (Fig. 6b). Although direct comparison of band intensities between Fig. 6a and Fig. 6b is limited by spectral scaling and presentation, the retention of ether-related bands in the 1200–1000 cm–1 region supports EPI-mediated crosslink formation. Therefore, the FTIR spectroscopy results indicate successful formation of crosslinked DEX networks without overinterpreting relative intensity differences between separately presented spectra.
The incorporation of HNT into the high-crosslinked system (4DEX-HNT; Fig. 6b) resulted in pronounced Si–O–Si bands at 1118–1120 cm–1 while maintaining the characteristic DEX- and EPI-related vibrations. The simultaneous observation of C–O–C bands and halloysite-specific Si–O–Si vibrations confirms the formation of a chemically crosslinked DEX network reinforced with inorganic nanotubes.
Overall, the ATR-FTIR spectra (Fig. 6) provide strong experimental support for the EPI-mediated crosslinking mechanism (Fig. 5). Formation of ether bridges, the preservation of the DEX backbone and the successful incorporation of HNTs are clearly evidenced by the observed spectral features, validating the proposed structural model of the DEX/HNT nanocomposite hydrogels.
Scanning electron microscopy
SEM was employed to investigate the surface morphologies of the DEX-based hydrogels prepared with different crosslinking densities (2DEX and 4DEX) and their corresponding nanocomposite hydrogels containing 30 wt.% HNTs. SEM analysis was performed to evaluate the effects of crosslinking degree and HNT incorporation on surface homogeneity, porous architecture, morphological variations and matrix–filler interactions.
SEM images of the 2DEX sample (Fig. 7a) show a distinct porous morphology that was formed because of chemical crosslinking. EPI promoted the formation of crosslinks between DEX chains, leading to a porous network with a relatively uniform pore distribution. The observed structural regularity suggests effective network formation and overall structural integrity. No pronounced surface defects or large-scale roughness were detected; instead, only mild micro-scale roughness accompanied by a porous texture was observed, indicating that the 2DEX hydrogel exhibits a smooth and comparatively homogeneous surface.
SEM images of the 2DEX-HNT nanocomposite hydrogel (Fig. 7b) demonstrate that HNT addition induces pronounced changes in surface morphology. Incorporation of HNTs increased surface roughness and formed more complex microstructures. HNTs appeared to form localized aggregates within the matrix, creating micro-hierarchical arrangements. This morphological evolution suggests a reinforcing effect of the nanotubular filler and indicates increased structural robustness of the hydrogel network.
For the 4DEX hydrogel (Fig. 8a), a higher crosslinking density is expected due to the increased EPI content. Increasing the crosslinker amount led to the formation of a tighter and more ordered network structure, resulting in a more compact porous architecture (Fig. 8a). Compared to the 2DEX hydrogel, the 4DEX sample exhibited smaller pores that were distributed more uniformly. Increased crosslinking density is therefore associated with improved structural integrity and potentially greater mechanical stability. A slight increase in surface roughness was also observed, consistent with the formation of a denser polymer network.
SEM images of (a) the 2DEX hydrogel and (b) the 2DEX-HNT hydrogel.

SEM images of (a) the 4DEX hydrogel and (b) the 4DEX-HNT hydrogel.

SEM images of the 4DEX-HNT nanocomposite hydrogel (Fig. 8b) reveal that the combined effects of increased crosslinking density and HNT incorporation substantially reduced pore visibility and pore size at the surface. Increased surface roughness, attributed to the presence of HNTs, contributes to the formation of a more heterogeneous and complex microstructure. With intensified EPI-driven crosslinking, the polymeric network becomes more compact, a structural feature commonly associated with improved mechanical stability. Consequently, the synergistic effect of crosslinking and HNT reinforcement indicates that the 4DEX-HNT hydrogel exhibits a more stable and mechanically robust architecture compared to non-filled and/or less-crosslinked systems. The SEM images also suggest the presence of localized HNT agglomerations within the hydrogel matrix. Such aggregation behaviour is commonly observed in nanocomposite systems due to interparticle interactions between nanotubes. While partial agglomeration may reduce the effective dispersion of HNTs, it can also contribute to the formation of heterogeneous microdomains within the polymeric network. These microstructural heterogeneities may influence both mechanical stability and adsorption performance. From a mechanical perspective, HNT agglomerates can act as localized reinforcement domains, potentially enhancing stiffness in specific regions. From an adsorption standpoint, the presence of clustered nanotubes may create regions with increased local surface functionality, which can facilitate dye retention through combined surface adsorption and confinement effects. However, excessive aggregation might limit the accessibility of active sites and reduce the overall efficiency of the system. Therefore, the adsorption behaviour observed in the present study is probably governed by a balance between HNT dispersion and localized aggregation within the hydrogel network.
Nitrogen adsorption–desorption (BET) analysis
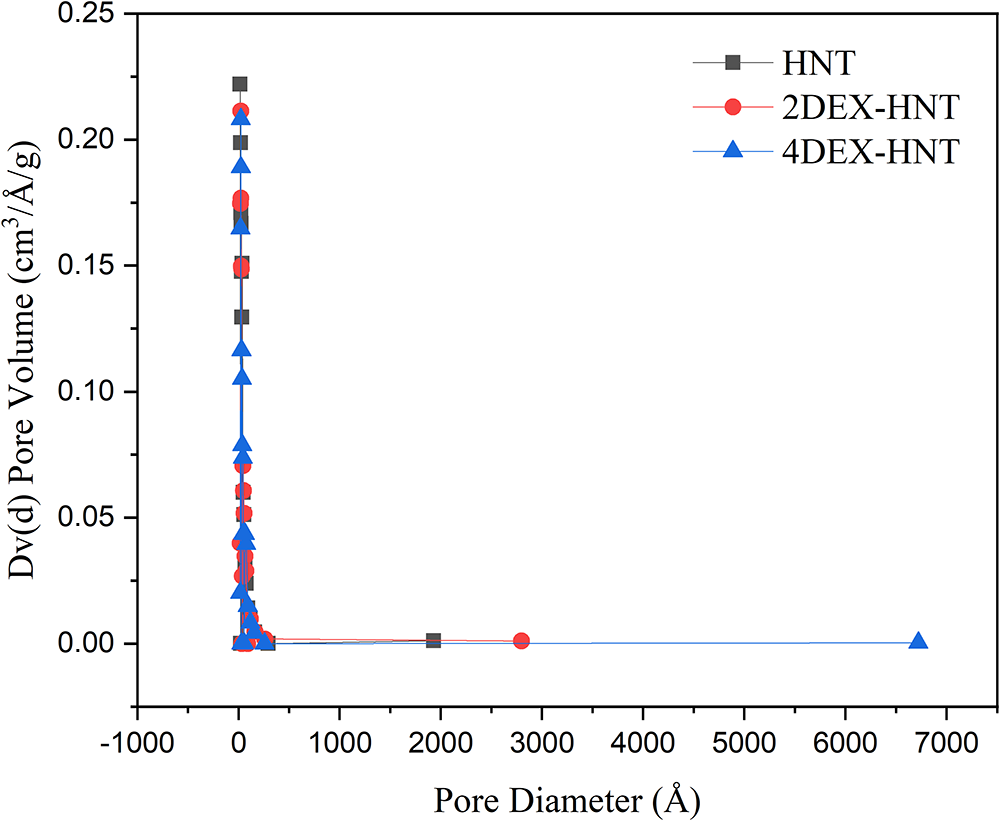
To further investigate the influence of HNT incorporation and crosslinking density on the porous characteristics of the DEX-based hydrogel systems, nitrogen adsorption–desorption analyses were performed. The nitrogen adsorption–desorption isotherms of pristine HNT, 2DEX-HNT and 4DEX-HNT are presented separately in Fig. 9a–c. Figure 10 presents the corresponding pore-size distribution curves, whereas specific surface area, pore-volume and pore-size parameters are summarized in Tables S4–S6.
Nitrogen adsorption–desorption isotherms of (a) pristine HNT, (b) 2DEX-HNT nanocomposite hydrogel and (c) 4DEX-HNT nanocomposite hydrogel samples. STP = standard temperature and pressure.

Figure 9 Long description
Line graph in image A with the legend text, HNT. The horizontal axis label is, Relative Pressure, P over P subscript 0, with tick labels 0.0, 0.2, 0.4, 0.6, 0.8, 1.0. The vertical axis label is, Volume at STP, cc g superscript minus 1, with tick labels 0, 1, 2, 3, 4. Two plotted traces are shown with square markers. One trace rises from about 0.2 at relative pressure about 0.1 to about 1.9 at about 0.5, then to about 2.6 at about 0.9, then drops to about 2.0 near about 0.95, then rises to about 4.0 at 1.0. The other trace rises from about 0.1 at about 0.1 to about 0.4 at about 0.4, then to about 1.0 at about 0.5, then stays near about 1.0 to about 0.7, then rises to about 1.8 at about 0.8 and to about 2.0 at 1.0. Line graph in image B with the legend text, 2DEX HNT. The horizontal axis label is, Relative Pressure, P over P subscript 0, with tick labels 0.0, 0.2, 0.4, 0.6, 0.8, 1.0. The vertical axis label is, Volume at STP, cc g superscript minus 1, with tick labels 0, 1, 2, 3, 4, 5, 6. Two plotted traces are shown with circular markers. One trace rises from about 0.1 at relative pressure about 0.1 to about 1.0 at about 0.4, then to about 1.8 at about 0.7, then to about 2.0 at about 0.9, then rises to about 5.4 at 1.0. The other trace rises from about 0.0 at about 0.1 to about 0.6 at about 0.4, then to about 1.0 at about 0.7, then to about 1.6 at about 0.9 and to about 2.0 at 1.0. Line graph in image C with the legend text, 4DEX HNT. The horizontal axis label is, Relative Pressure, P over P subscript 0, with tick labels 0.0, 0.2, 0.4, 0.6, 0.8, 1.0. The vertical axis label is, Volume at STP, cc g superscript minus 1, with tick labels 0, 1, 2, 3, 4, 5. Two plotted traces are shown with triangle markers. One trace rises from about 0.1 at relative pressure about 0.1 to about 0.9 at about 0.3, then to about 1.6 at about 0.7, then to about 2.0 at about 0.9, then rises to about 4.7 at 1.0. The other trace rises from about 0.0 at about 0.1 to about 0.4 at about 0.3, then to about 0.9 at about 0.7, then to about 1.0 at about 0.9 and to about 1.8 at 1.0.
Pore-size distribution curves of HNT, 2DEX-HNT and 4DEX-HNT samples determined from nitrogen adsorption–desorption analysis.

The adsorption–desorption isotherms obtained for all investigated samples displayed mesoporous characteristics with hysteresis behaviour, suggesting restricted pore structures and interconnected diffusion pathways within the hydrogel matrices. The pristine HNT displayed a typical adsorption–desorption profile associated with its tubular morphology and accessible lumen structure (Fig. 9a). In comparison, the 2DEX-HNT and 4DEX-HNT nanocomposite hydrogels (Fig. 9b,c) exhibited modified isotherm profiles, suggesting that incorporation of HNT into the crosslinked DEX network altered pore accessibility and nitrogen diffusion within the hydrogel architecture. The presence of hysteresis loops further indicates that nitrogen adsorption was influenced not only by external surface adsorption but also by diffusion limitations within partially accessible porous domains.
The BET specific surface areas of 2DEX-HNT and 4DEX-HNT were 1.572 and 1.618 m2 g–1, respectively. For comparison, pristine HNT exhibited a BET specific surface area of 1.586 m2 g–1. Hence, the HNT-containing hydrogel systems exhibited highly comparable accessible surface areas. Therefore, the incorporation of HNT into the DEX network did not affect the total BET specific surface area. However, notable differences were observed in pore-volume and pore-size distribution parameters, demonstrating the significant influence of crosslinking density on pore accessibility and internal network structure.
Pristine HNT showed relatively broad pore-width characteristics, with DH and BJH adsorption pore diameters centred at ∼31 Å. This behaviour is consistent with the intrinsic tubular morphology and accessible lumen structure of HNTs. In contrast, both 2DEX-HNT and 4DEX-HNT hydrogels showed reduced pore diameters, generally clustered at ∼22 Å, indicating partial confinement of porous domains within the polymeric network. Reduced pore accessibility after hydrogel formation suggests that DEX crosslinking partially covered the HNT surfaces or restricted access to nanotubular cavities.
Crosslinking density exerted a more evident influence in the highly crosslinked 4DEX-HNT system. Compared with 2DEX-HNT, the 4DEX-HNT hydrogel exhibited lower micropore area and lower cumulative pore-volume values as determined using the DR, HK and SF methods. This reduction indicates that increasing EPI content resulted in a denser and more compact polymeric network, limiting gas diffusion pathways and decreasing the accessibility of porous regions within the hydrogel matrix. These findings are consistent with the SEM observations, in which the highly crosslinked hydrogels displayed more compact and less visible porous architectures.
Furthermore, the relatively restricted pore accessibility observed in 4DEX-HNT may contribute to increased structural stability and stronger confinement of dye molecules during adsorption. This interpretation is consistent with the methylene blue adsorption results, for which the highly crosslinked HNT-containing hydrogel showed the greatest adsorption capacity despite its comparatively low swelling capacity. Therefore, the BET results suggest that adsorption performance in these systems is controlled not only by swelling behaviour, but also by the combined effects of pore architecture, diffusion pathways and matrix compactness.
Overall, the nitrogen adsorption–desorption analysis showed that HNT incorporation and crosslinking density influenced the porous architecture of DEX-based hydrogels. While the BET specific surface area values remained highly comparable, the pore-size and pore-volume parameters revealed differences in pore accessibility and network compactness. These findings provide additional insight into the structure–transport–adsorption relationships governing the performance of DEX/HNT nanocomposite hydrogels.
Swelling behaviour of the hydrogels
Hydrogels are polymeric materials capable of absorbing and retaining large amounts of water, which makes them highly relevant for a wide range of industrial and environmental applications (Kaplan & Güner, Reference Kaplan and Güner2000a; Guo et al., Reference Guo, Bae, Fang, Li, Zhao and Yu2020). The swelling ratio is a key parameter that reflects the water-uptake capacity of hydrogels and their response to environmental conditions (Kaplan & Güner, Reference Kaplan and Güner2000b; Ganji et al., Reference Ganji, Vasheghani and Vasheghani2010; Lv et al., Reference Lv, Wu and Shen2019).
In this study, the swelling behaviours of four different hydrogel formulations were investigated as a function of crosslinking density and HNT incorporation. The percentage swelling ratios of the hydrogels were calculated and presented graphically to compare the effects of crosslinking and HNT in addition to swelling performance.
Gravimetric swelling data recorded at various immersion times are provided in Table S1. These data provide a quantitative comparison of water absorption behaviour for all hydrogel formulations over extended swelling durations.
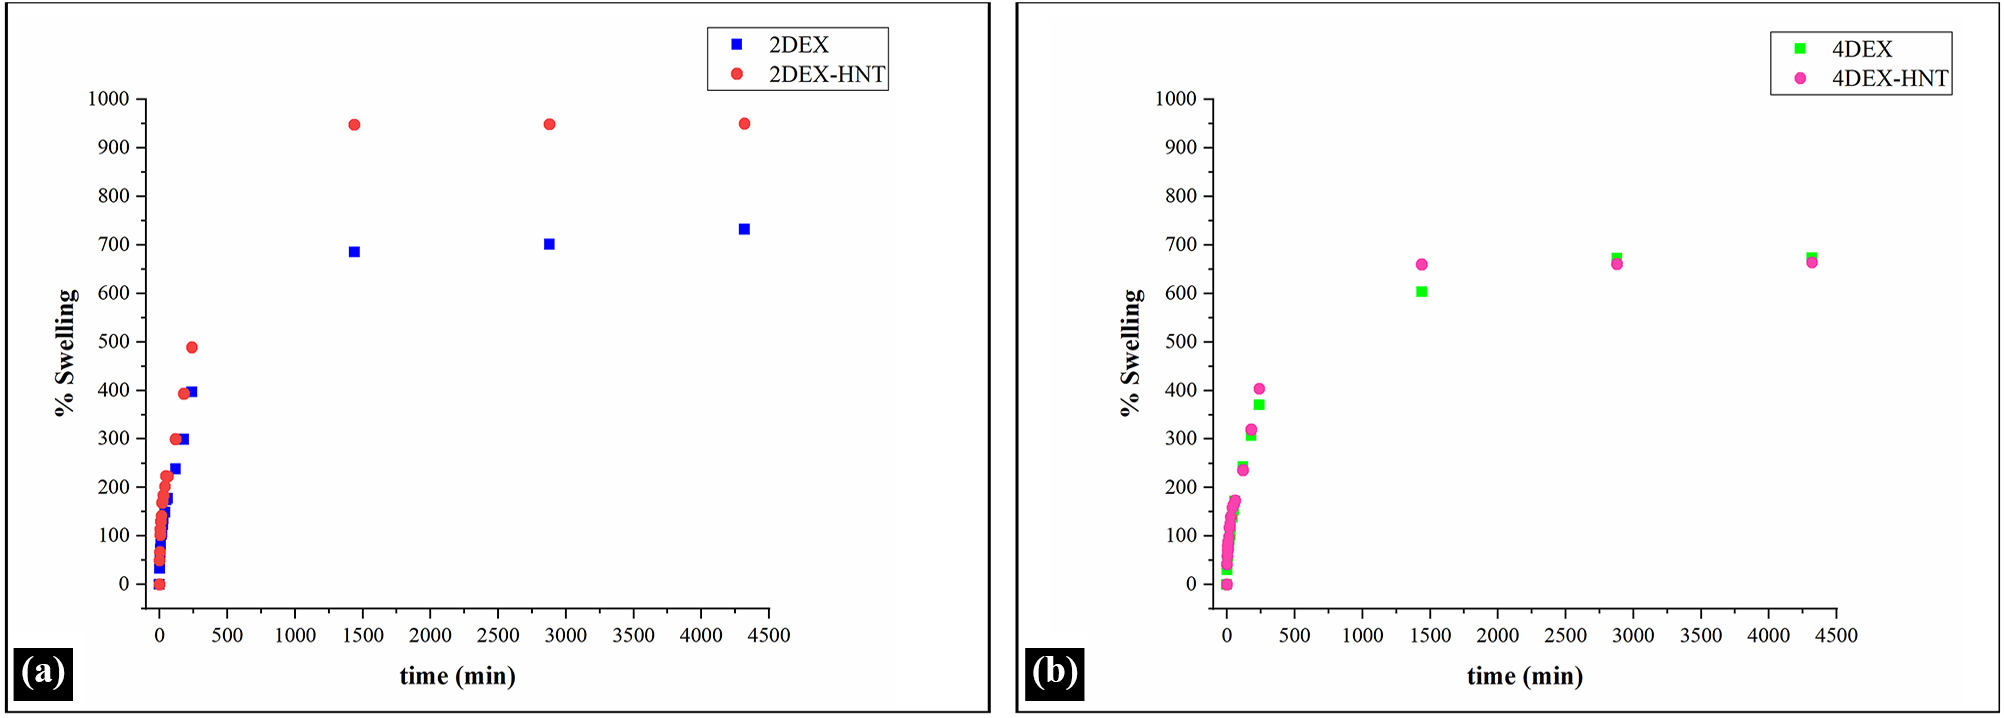
Figure 11a presents the time-dependent swelling behaviours of the low-crosslinked hydrogels (2DEX and 2DEX-HNT), and Fig. 11b shows the swelling profiles of the highly crosslinked hydrogels (4DEX and 4DEX-HNT).
(a) Swelling behaviour (% swelling vs time) of the 2DEX and 2DEX-HNT hydrogels and (b) swelling behaviour (% swelling vs time) of the 4DEX and 4DEX-HNT hydrogels.

The swelling ratio of the low-crosslinked hydrogel (2DEX) was higher than that of the high-crosslinked hydrogel (4DEX), which can be attributed to the lower crosslinking density and higher chain mobility of the polymer network (Fig. 11). The maximum swelling ratios were ∼685% for 2DEX and ∼603% for 4DEX, indicating that increased crosslinking density restricted polymer chain expansion and reduced water-uptake capacity.
Comparison of 2DEX-HNT and 4DEX-HNT suggests that the influence of HNT incorporation on swelling was more evident in the less densely crosslinked matrix, resulting in higher overall water uptake for 2DEX-HNT. These findings indicate that crosslink density and inorganic filler incorporation significantly influence solvent transport behaviour by altering network tightness and chain mobility. Similar diffusion-controlled swelling behaviour in crosslinked polymer systems has been previously reported in the literature (Kaplan & Güner, Reference Kaplan and Güner2000a; Can et al., Reference Can, Kavlak, Kırcı and Güner2003).
Diffusion kinetics analysis
To further elucidate the swelling mechanism, diffusion kinetics were evaluated using the empirical power-law model applied to the initial swelling region, as given in Equation 1:
 \begin{equation}\frac{{M_t}}{{M_\infty }} = {\text{k}}{t^n}\end{equation}
where  ${M_t}$ represents the amount of water absorbed at time
 $t$,
 ${M_\infty }$ corresponds to the equilibrium swelling amount,
 ${\text{k}}$ is the swelling rate constant and
 $n$ is the diffusion exponent that characterizes the solvent transport mechanism within the polymer network.
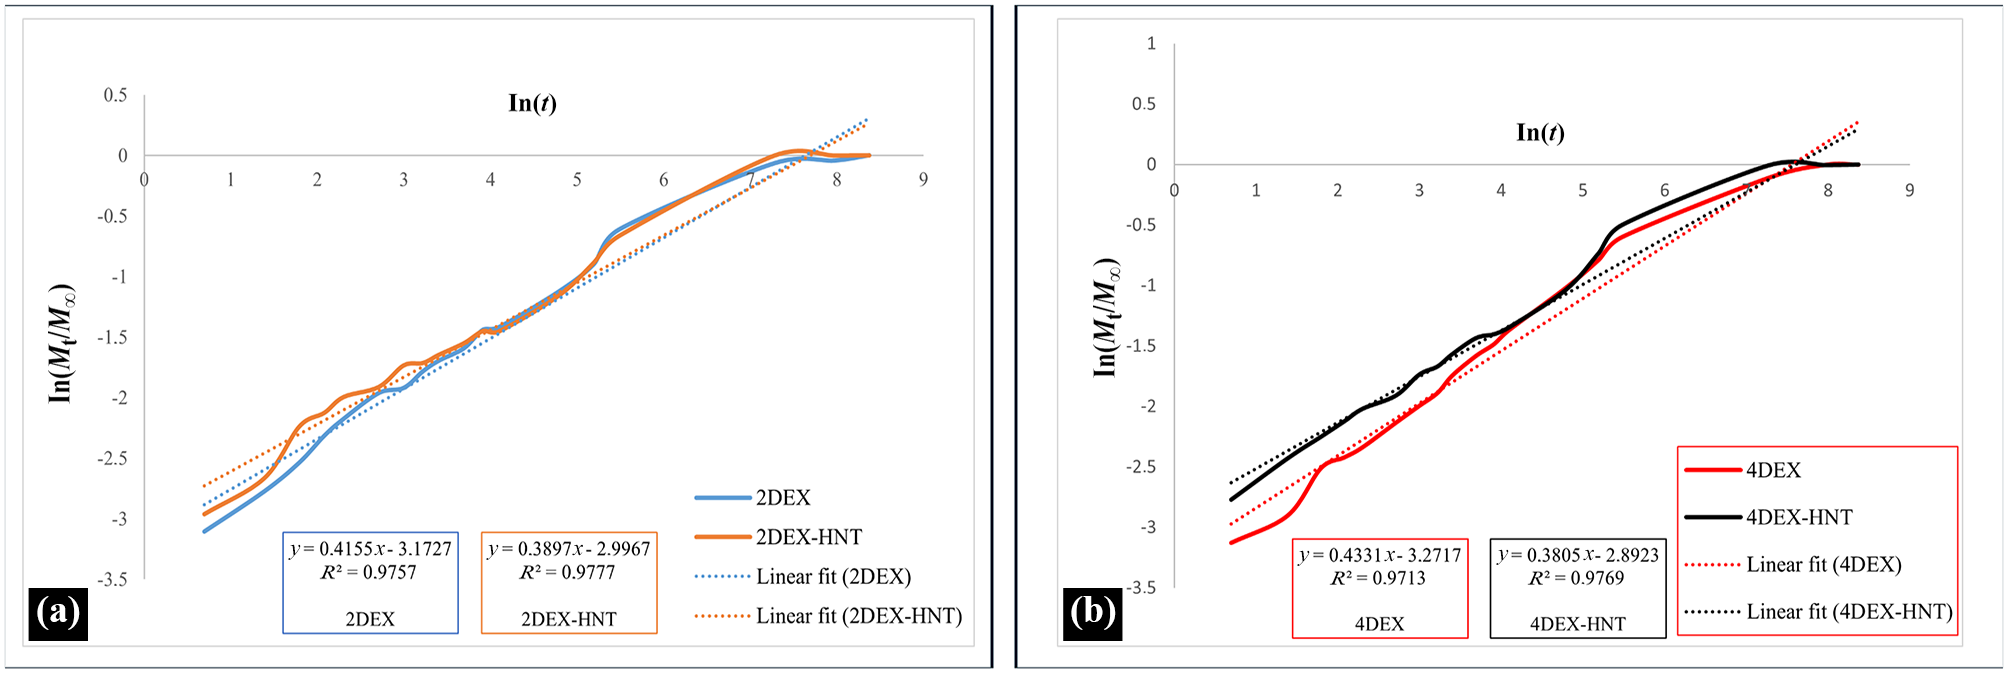
The diffusion exponent  $(n)$ was obtained from the slope of the linear plot of ln
 $({M_t}/{M_\infty })$ vs ln
 $(t)$ using the initial 60% swelling data (Fig. 12).
(a) Diffusion analysis of 2DEX and 2DEX-HNT hydrogels using ln  $({M_t}/{M_\infty })$ vs ln
 $(t)$ plots. (b) Diffusion analysis of 4DEX and 4DEX-HNT hydrogels using ln
 $({M_t}/{M_\infty })$ vs ln
 $(t)$ plots.

Figure 12 Long description
A line graph with the title text, ln(t). The horizontal axis has tick labels 0, 1, 2, 3, 4, 5, 6, 7, 8, 9. The vertical axis label reads, ln(M subscript t over M subscript infinity). The vertical axis tick labels read 0.5, 0, minus 0.5, minus 1, minus 1.5, minus 2, minus 2.5, minus 3, minus 3.5. A legend lists, 2DEX, 2DEX-HNT, Linear fit (2DEX), Linear fit (2DEX-HNT). Two curved lines rise from about minus 3.2 near t equals 0 to about 0.1 near t equals 8. Two straight fitted lines run diagonally upward across the plot. Two text boxes near the bottom show line equations and R superscript 2 values; the text is too small to read accurately. The image B showing a line graph with the title text, ln(t). The horizontal axis has tick labels 0, 1, 2, 3, 4, 5, 6, 7, 8, 9. The vertical axis label reads, ln(M subscript t over M subscript infinity). The vertical axis tick labels read 1, 0.5, 0, minus 0.5, minus 1, minus 1.5, minus 2, minus 2.5, minus 3, minus 3.5. A legend lists, 4DEX, 4DEX-HNT, Linear fit (4DEX), Linear fit (4DEX-HNT). Two curved lines rise from about minus 3.2 near t equals 0 to about 0.2 near t equals 8. Two straight fitted lines run diagonally upward across the plot. Two text boxes near the bottom show line equations and R superscript 2 values; the text is too small to read accurately.
The diffusion exponent  $(n)$ values obtained from the slope of the diffusion plots were 0.416 for 2DEX, 0.390 for 2DEX-HNT, 0.433 for 4DEX and 0.381 for 4DEX-HNT. The diffusion exponent
 $(n)$ was calculated from the slope of the linear plot of ln
 $({M_t}/{M_\infty })$ vs ln
 $(t)$ using the initial 60% swelling data. This approach allows determination of the dominant transport mechanism governing water uptake in crosslinked polymer networks (Kaplan & Güner, Reference Kaplan and Güner2000a). All
 $n$ values fall within the range of
 $n$ ≤ 0.5, indicating that the swelling behaviour of all hydrogel formulations follows Fickian diffusion (Kaplan & Güner, Reference Kaplan and Güner2000b). In this diffusion regime, water transport within the polymer network occurs faster than polymer chain relaxation. The calculated diffusion parameters are summarized in Table 2.
Diffusion kinetic parameters (n, k and R 2) obtained from power-law analysis of the swelling behaviour of DEX-based hydrogels.

Table 2 Long description
Diffusion kinetic parameters are listed for four samples, 2DEX, 2DEX-HNT, 4DEX, and 4DEX-HNT, with columns for n, k, R2, and diffusion type. For 2DEX, n is 0.416, k is 0.042, and R2 is 0.976, with diffusion type, Fickian. For 2DEX-HNT, n is 0.390, k is 0.050, and R2 is 0.978, with diffusion type, Fickian. For 4DEX, n is 0.433, k is 0.038, and R2 is 0.971, with diffusion type, Fickian. For 4DEX-HNT, n is 0.381, k is 0.055, and R2 is 0.977, with diffusion type, Fickian.
The coefficients of determination (R 2 = 0.971–0.978) indicate that the power-law model adequately describes the early-stage swelling behaviour of the prepared hydrogels. In the absence of HNT, increasing crosslinking density resulted in a slight increase in the diffusion exponent, from 0.416 for 2DEX to 0.433 for 4DEX. By contrast, in the presence of HNT, increasing crosslinking density led to a slight decrease in  $n$, from 0.390 for 2DEX-HNT to 0.381 for 4DEX-HNT. Moreover, the lower
 $n$ values observed for HNT-containing hydrogels compared with their corresponding non-filled systems suggest that HNTs increase diffusion tortuosity within the polymer matrix. Comparable diffusion-controlled swelling behaviour in crosslinked polymer systems has been widely reported in the literature (Kaplan & Güner, Reference Kaplan and Güner2000a; Can et al., Reference Can, Kavlak, Kırcı and Güner2003).
The observed Fickian diffusion behaviour indicates that water transport within the prepared hydrogels was predominantly governed by concentration-driven diffusion rather than polymer chain relaxation. This finding is consistent with the compact crosslinked network structure formed through EPI-mediated crosslinking. The lower  $n$ values obtained for the HNT-containing systems further suggest that HNTs increased the tortuosity of diffusion pathways within the hydrogel matrix. Accordingly, the diffusion behaviour in these hydrogels appears to be influenced by the combined effects of network architecture and HNT incorporation.
Methylene blue adsorption performance
The methylene blue adsorption performance of the prepared hydrogel systems was evaluated to investigate the effects of crosslinking density and HNT incorporation on dye removal efficiency. Removal efficiency (%) was additionally calculated to provide a clearer comparison of dye adsorption performance among the hydrogel systems. The adsorption results are summarized in Table 3, including the final methylene blue concentration, the amount of adsorbed dye and the removal efficiency after 24 h of contact time.
Methylene blue adsorption performance of DEX-based hydrogels after 24 h.

Table 3 Long description
Measurements are reported for four samples, 2DEX, 2DEX-HNT, 4DEX, and 4DEX-HNT, across absorbance, final methylene blue concentration in milligrams per liter, amount of adsorbed dye in milligrams, and removal efficiency in percent. For 2DEX, absorbance is 0.050, final concentration 0.383, adsorbed dye 0.293, and removal efficiency 99.2. For 2DEX-HNT, absorbance is 0.025, final concentration 0.199, adsorbed dye 0.756, and removal efficiency 99.6. For 4DEX, absorbance is 0.048, final concentration 0.368, adsorbed dye 0.330, and removal efficiency 99.2. For 4DEX-HNT, absorbance is 0.021, final concentration 0.169, adsorbed dye 0.830, and removal efficiency 99.6.
Removal efficiency for methylene blue was calculated according to Equation 2:
 \begin{equation}{\text{Removal efficiency }}\left( \% \right){\text{ }} = {\text{ }}\left( {\left( {{C_0} - {C_{\text{e}}}} \right)/{C_0}} \right){\text{ }} \times {\text{ }}100\end{equation}
where C 0 is the initial methylene blue concentration and C e is the equilibrium methylene blue concentration after 24 h of adsorption.
The HNT-containing hydrogels exhibited higher methylene blue adsorption capacities than the corresponding non-filled hydrogels (Table 3). Among all samples, 4DEX-HNT showed the highest adsorbed dye amount (0.830 mg), followed by 2DEX-HNT (0.756 mg). By contrast, the non-filled hydrogels showed lower adsorption values, with 4DEX and 2DEX adsorbing 0.330 and 0.293 mg of methylene blue, respectively. These results indicate that HNT incorporation plays an important role in improving the adsorption performance of DEX-based hydrogels.
Increased dye retention in HNT-containing hydrogels may arise from the hollow tubular morphology and dual-surface chemistry of HNTs, which provide additional interaction sites for cationic methylene blue molecules. Electrostatic interactions, hydrogen bonding and physical confinement within the nanotubular structure may contribute to dye retention within the hydrogel matrix.
Interestingly, although lower-crosslinked hydrogels exhibited higher swelling capacities, the highly crosslinked HNT-containing hydrogel showed the highest methylene blue adsorption performance. This result suggests that adsorption performance was not governed solely by swelling capacity. Instead, the combined effects of network compactness, pore architecture, diffusion pathways and HNT-derived interaction sites played a decisive role in dye retention. Therefore, the superior performance of 4DEX-HNT can be attributed to an optimized balance between crosslinking density and HNT incorporation.
Overall, these findings demonstrate that the adsorption behaviour of DEX/HNT nanocomposite hydrogels is controlled by the combined influence of crosslinking density and inorganic filler incorporation. While crosslinking density regulates network compactness and solvent transport, HNTs contribute additional interaction sites and nanotubular domains for methylene blue retention. This structure–property–performance relationship highlights the potential of DEX/HNT nanocomposite hydrogels as tuneable materials for aqueous dye remediation.
Conclusions
DEX-based hydrogels with different crosslinking densities and levels of HNT incorporation were successfully synthesized and systematically evaluated in terms of their structural, morphological, porous, swelling, diffusion and methylene blue adsorption properties. EPI-mediated crosslinking enabled the formation of stable polymeric networks, while HNT incorporation produced nanocomposite hydrogel systems with modified morphology, pore characteristics and adsorption performance.
ATR-FTIR analysis confirmed the formation of ether linkages within the DEX network and the successful incorporation of HNTs. SEM observations showed that increasing crosslinking density resulted in more compact hydrogel structures, whereas HNT addition increased surface roughness and microstructural heterogeneity. Nitrogen adsorption–desorption analysis indicated that the BET specific surface area values of HNT, 2DEX-HNT and 4DEX-HNT were highly comparable, whereas differences in the pore-size and pore-volume parameters suggested changes in pore accessibility and internal network architecture.
Swelling experiments demonstrated that lower crosslinking density resulted in higher water uptake due to increased network flexibility and free volume, whereas higher crosslinking density restricted swelling by limiting polymer chain mobility. Diffusion analysis showed that all hydrogel systems followed Fickian diffusion behaviour, indicating diffusion-controlled water uptake within the polymer network.
Methylene blue adsorption results revealed that HNT-containing hydrogels exhibited higher adsorption performance than non-filled systems. Among the investigated formulations, 4DEX-HNT showed the highest adsorption capacity, indicating that the combination of higher crosslinking density and HNT incorporation provided a favourable balance between network compactness, pore architecture, diffusion pathways and available interaction sites. These findings suggest that adsorption performance was not governed solely by swelling capacity but by the combined effects of hydrogel network structure and HNT-derived functionality.
Overall, this study demonstrates a clear relationship between network structure, porous characteristics, transport behaviour and adsorption performance in DEX/HNT nanocomposite hydrogels. Crosslinking density and halloysite incorporation act together to determine hydrogel functionality. Therefore, the developed DEX/HNT nanocomposite hydrogels can be considered promising tuneable adsorbent materials for the removal of cationic dyes from aqueous environments. These findings may also guide future studies on adsorption kinetics, isotherm modelling and application-oriented evaluation in more complex aqueous systems.
Supplementary material
The supplementary material for this article can be found at https://doi.org/10.1180/clm.2026.10063.
Competing interests
The authors of the manuscript declare that they have no scientific and/or financial conflicts of interest with other people or institutions.
Declaration on the use of artificial intelligence tools
AI-based tools were used only for minor language editing. The authors take full responsibility for the content of the manuscript.