



INTRODUCTION
Obligate intracellular parasites have co-evolved with hosts to be able to invade their cells and flourish. To be successful they need to establish specific molecular parasite-host cell interactions, and then manipulate the host cell structures, mechanisms and pathways in order to replicate and grow. These events are strictly required for the completion of their life cycles and are the basis of their pathogenesis. Therefore, the understanding of the molecular mechanisms underlying host cell invasion is a crucial step for defining therapeutic strategies.
Apicomplexan parasites are a unique and diverse group of protozoa characterized by having a structure called the apical complex, which is involved in host-cell invasion. Besnoitia besnoiti and Toxoplasma gondii are both apicomplexan parasites, belonging to the family Sarcocystidae, and are phylogenetically closely related (Ellis et al. Reference Ellis, Holmdahl, Ryce, Njenga, Harper and Morrison2000; Marcelino et al. Reference Marcelino, Martins, Morais, Nolasco, Cortes, Hemphill, Leitão and Novo2011). Besnoitia besnoiti has received little attention until recently. Members of the Bovidae are the only known intermediate hosts and its definitive host remains unknown. Cattle that survive the acute phase of infection (characterized by nasal and ocular discharges, anorexia and generalized weakness) retain low body condition and have chronic scleroderma, pronounced thickening of the limbs and difficult and painful locomotion (Pols, Reference Pols1960). Bovine besnoitiosis causes significant economic losses in the cattle industry of Africa and Middle East, having been considered by EFSA an emerging disease in the EU due to its increased prevalence and geographic expansion (EFSA, 2010). Toxoplasma gondii infects warm-blooded vertebrates, including humans, and can be found in most regions of the world. Infection can result in a wide spectrum of clinical signs depending on the host animal species. Congenital infection is common, resulting in one of the major causes of abortion in sheep (Innes, Reference Innes2010). In humans, most infections generate few or no symptoms, but acute infections are a concern, particularly during pregnancy and in immunocompromised individuals.
Toxoplasma gondii is one of the most studied apicomplexan parasites and, therefore, is a good comparative model for studies on B. besnoiti. The molecular mechanisms involved in host-cell invasion by T. gondii parasites have been extensively studied, and some similarities were found with other apicomplexan parasites, as for example Plasmodium. However, nothing is known about the host cell invasion strategies used by B. besnoiti.
We have previously shown that the microtubule cytoskeleton of the host cell has an active role during the first steps of B. besnoiti host cell invasion, because the host cell microtubule cytoskeleton is rearranged in order to surround the parasite during the first steps of cell entrance (Reis et al. Reference Reis, Cortes, Viseu Melo, Fazendeiro, Leitão and Soares2006). Also, for T. gondii-infected host cells, the microtubule cytoskeleton surrounds the parasitophorous vacuole (PV) soon after invasion (Walker et al. Reference Walker, Hjort, Smith, Tripathi, Hornick, Hinchcliffe, Archer and Hager2008; Sweeney et al. Reference Sweeney, Morrissette, LaChapelle and Blader2010) which is accompanied by the detachment of the centrosome, the major microtubule-organizing centre (MTOC) of animal cells, from the nuclear envelope, and further association with the PV (Coppens et al. Reference Coppens, Dunn, Romano, Pypaert, Zhang, Boothroyd and Joiner2006; Walker et al. Reference Walker, Hjort, Smith, Tripathi, Hornick, Hinchcliffe, Archer and Hager2008; Wang et al. Reference Wang, Weiss and Orlofsky2010). Interestingly, it is now known that the alteration of centrosome positioning is involved in the repositioning of the pericentrosomal Golgi ribbon (Bornens, Reference Bornens2012), and that the Golgi apparatus and centrosome are functionally linked (Sütterlin and Colanzi, Reference Sütterlin and Colanzi2010). For example, Golgi proteins like GM130, Cdc42 and Tuba regulate centrosome morphology and function (Kodani and Sütterlin, Reference Kodani and Sütterlin2008; Kodani et al. Reference Kodani, Kristensen, Huang and Sütterlin2009); and a centrosomal protein, like AKAP450, is an important linker between the centrosome and the Golgi apparatus (Rivero et al. Reference Rivero, Cardenas, Bornens and Rios2009). Additionally, the correct morphology and positioning of the Golgi apparatus is achieved by the organized cooperation of microtubules growing from both the centrosome and the Golgi apparatus (Hurtado et al. Reference Hurtado, Caballero, Gavilan, Cardenas, Bornens and Rios2011). Also, it has been demonstrated that the Golgi apparatus nucleates microtubules in different epithelial cell lines (Efimov et al. Reference Efimov, Kharitonov, Efimova, Loncarek, Miller, Andreyeva, Gleeson, Galjart, Maia, McLeod, Maiato, Khodjakov, Akhmanova and Kaverina2007; Rivero et al. Reference Rivero, Cardenas, Bornens and Rios2009). In fact, the nucleus-centrosome-Golgi defines an intrinsic polarity axis (Bornens, Reference Bornens2008; Dupin et al. Reference Dupin, Camand and Etienne-Manneville2009; Luxton and Gundersen, Reference Luxton and Gundersen2011) that has been shown to be essential for several cellular functions, and that can be remodelled during cell-stage transitions. For example, the centrosome is repositioned and microtubule arrays reoriented during cell migration (Yvon et al. Reference Yvon, Walker, Danowski, Fagerstrom, Khodjakov and Wadsworth2002; Luxton and Gundersen, Reference Luxton and Gundersen2011).
To gain new insights about the cellular mechanisms underlying B. besnoiti host cell invasion we decided to go further, studying the role of the host microtubule cytoskeleton, centrosome and the intrinsic cell polarity axis in B. besnoiti host invasion. For this we have profited from the fact that we recently described the human TBCC-domain containing 1 (TBCCD1), a protein that localizes at the centrosome and is involved in centrosome–nucleus connection (Gonçalves et al. Reference Gonçalves, Nolasco, Nascimento, Fanarraga, Zabala and Soares2010a ). The knockdown of TBCCD1 causes the dissociation of the centrosome from the nucleus and disorganization and spreading of the Golgi apparatus throughout the cytoplasm, suggesting that TBCCD1 is a key regulator of centrosome positioning and consequently of internal cell organization (Gonçalves et al. Reference Gonçalves, Nolasco, Nascimento, Fanarraga, Zabala and Soares2010a ). Therefore, we have investigated the impact of over-expressing or depleting TBCCD1 from host cells in the ability of B. besnoiti to recruit the centrosome and invade and replicate in these cells. We extended these studies to T. gondii to investigate the differences and similarities between the two apicomplexan parasites and if, during host invasion, the cellular mechanisms are conserved.
Here we show that both B. besnoiti and T. gondii parasitophorous vacuoles (PVs) cross-talk with the host microtubule cytoskeleton, but each parasite promotes distinct arrangements of these polymers independently of the host cell type. Moreover, only T. gondii consistently displaces the centrosome from the host cell nucleus to the PV membrane which is accompanied by Golgi apparatus disorganization. In fact, although both parasites seem to preferentially establish the PV close to the host cell Golgi apparatus, B. besnoiti causes Golgi compaction even under conditions where this structure was dispersed prior to invasion, e.g. TBCCD1 depletion. Results from invasion and replication assays for both parasites in a host background of TBCCD1 over-expression or depletion, point to the idea that successful establishment of PVs in the host cell requires modulation of Golgi apparatus. The mechanisms underlying this modulation seem to be different for T. gondii and B. besnoiti, but probably rely on the microtubule cytoskeleton exploitation by both parasites. The differences found between these two Apicomplexa parasites are most likely a result of two distinct evolutionary mechanisms that might reflect the parasites’ distinct tissue tropism and pathogeny.
MATERIALS AND METHODS
Cell culture and parasite culture
Vero cells were grown in Dulbecco's modified Eagle's medium (DMEM) with Glutamax (Invitrogen), whereas hTERT-RPE-1, hTERT-RPE-1-centrin–GFP and hTERT-RPE-1 overexpressing TBCCD1-GFP were grown in DMEM/F12 with Glutamax (Invitrogen), both supplemented with 10% foetal bovine serum (Invitrogen) and non-essential amino acids (Invitrogen). These cell lines were cultured in a 5% CO2 humidified atmosphere at 37 °C as exponentially growing sub-confluent monolayers.
Besnoitia besnoiti Bb1Evora03 strain (Cortes et al. Reference Cortes, Reis, Waap, Vidal, Soares, Marques, Pereira da Fonseca, Fazendeiro, Ferreira, Caeiro, Shkap, Hemphill and Leitão2006) and T. gondii (ME49 strain SAG1-Luciferase-BAG1-GFP, a kind gift from Andrea Crisanti, Imperial College London, UK) tachyzoites were grown in Vero cells and maintained in DMEM with Glutamax (Invitrogen), supplemented with 10% foetal bovine serum and non-essential amino acids (Invitrogen). Tachyzoites were harvested from the supernatant by centrifugation at 770 g for 10 min.
Generation of viral particles and stable cell lines
To produce viral particles carrying the TBCCD1-GFP transgene, HEK293T cells were co-transfected with the plasmids pHR-SIN-TBCCD1-GFP, pCMVR8.9 and pMDG using Lipofectamine 2000 (Invitrogen) according to the manufacturer's protocol. The viral particles present in the culture medium were collected at 48 and 72 h post-transfection and used to infect hTERT-RPE-1 cells. GFP-positive cells were selected by cell sorting using a FacsAria Multicolor cell sorter. Single cells were isolated in 96-well plates, from which individual clonal cell lines were derived.
Immunofluorescence
For immunofluorescence, the cells were fixed with cold methanol (10 min at −20 °C), blocked with 3% bovine serum albumin (20 min), incubated 1 h with the primary antibodies (anti α-tubulin, Sigma, clone DM1A; anti γ-tubulin, Sigma, clone GTU88; anti-Golgin 97, Molecular Probes, clone CDF4; rat anti-α-tubulin, AbD Serotec, clone YL1/2; rabbit anti-B. besnoiti (Marcelino et al. Reference Marcelino, Martins, Morais, Nolasco, Cortes, Hemphill, Leitão and Novo2011); cat anti-T. gondii (kindly supplied by Helga Waap, LNIV, INIAV, Portugal); washed and incubated 1 h with secondary antibodies (anti-mouse Alexa 488, Molecular Probes; anti-mouse Alexa 594, Molecular Probes; anti-rabbit Alexa 488, Molecular Probes; anti-rabbit Alexa 594, Molecular Probes; anti-rat Alexa 546, Molecular Probes; anti-cat FITC F-4262 SIGMA). DNA was stained with DAPI (1 μg μL−1; Sigma) in PBS for 2 min. The preparations were washed in PBS and mounted in MOWIOL 4-88 (Calbiochem) mounting medium supplemented with 2·5% (w/v) DABCO (Sigma). Cells were examined with a fluorescence microscope (Leica DMRA2) and image acquisition was performed with a cooled CCD camera and MetaMorph Imaging Software (Universal Imaging Corporation). The image processing was carried out with ImageJ Software.
Transfection of hTERT-RPE-1 and hTERT-RPE-1 centrin-GFP cell lines with small interference RNAs
Cells (2×10⁴ cells seeded in 12-well plates) were transfected using Oligofectamine (Invitrogen) with 100 nm of a mixture of four siRNAs from Dharmacon (ON-TARGETplus Duplex; Lafayette, CO, USA) and Ambion (Silencer Select siRNAs; Austin, TX, USA) that silences the expression of human TBCCD1 gene. After either 54 or 66 h of transfection (for the 18 or 6 h post-invasion time points, respectively), purified tachyzoites of B. besnoiti or T. gondii were added to the transfected cells, both at a multiplicity of infection of 10 parasites cell−1. The experiment was stopped at 72 h of transfection, and coverslips where then processed by immunofluorescence.
Statistical analyses
Statistical analyses were performed using student's t-test and one way ANOVA. The software programs SPSS Statistics version 19 and Microsoft Excel 2007 were used.
Invasion and replication assays
For the replication assay, 1·5×104 cells of hTERT-RPE-1, hTERT-RPE-1 over-expressing TBCCD1-GFP and hTERT-RPE-1 transfected with siRNA for TBCCD1, were invaded with 1·5×105 parasites. 18 h after invasion the cells were processed for immunofluorescence with the polyclonal antibodies against B. besnoiti and T. gondii. The parasite number in each vacuole was counted.
For the invasion assay, 1·5×104 cells of hTERT-RPE-1, hTERT-RPE-1 over-expressing TBCCD1-GFP and hTERT-RPE-1 transfected with siRNA for TBCCD1, were invaded with 1·5×105 parasites. After 1 h, the cells were washed twice with PBS 1× to eliminate non-invaded parasites. After 17 h the cells were processed for immunofluorescence with the polyclonal antibodies against B. besnoiti and T. gondii. The number of invaded cells vs the number of non-invaded cells was counted.
Wound healing assay
hTERT-RPE-1 cells were invaded with B. besnoiti and T. gondii (10 parasites cell−1). After 18 h of parasite invasion, confluent cells were wounded with a 0·1–10 μL pipette tip, and live image frames from 120, 360 and 500 min of recovery were analysed.
RESULTS
Host microtubule cytoskeleton is differentially rearranged around the PV of B. besnoiti and T. gondii during parasite invasion and replication
We have previously shown that during the first steps of B. besnoiti host cell invasion, the microtubule cytoskeleton of the host cell is playing an active role. From the first minutes of invasion, the host cell microtubules start to interact with the entering parasite to finally surround the entire PV (Reis et al. Reference Reis, Cortes, Viseu Melo, Fazendeiro, Leitão and Soares2006). Similarly, it was also described for T. gondii that infected host cells form circular, basket-like structures of microtubules that surround the PV, as soon as 30 min after invasion (Walker et al. Reference Walker, Hjort, Smith, Tripathi, Hornick, Hinchcliffe, Archer and Hager2008). To further investigate the involvement of the host microtubule cytoskeleton during B. besnoiti host cell invasion in comparison to what was observed for T. gondii invasion, a time-course study of the rearrangements of the microtubules of host cells in response to B. besnoiti and T. gondii invasion was performed by immunofluorescence microscopy (IF). For this, we used RPE-1 and Vero cells, and collected samples of invaded cells at different time points. These invaded cells were then processed for IF using a monoclonal antibody against α-tubulin (Fig. 1A and B), whereas parasites inside the host cells were stained with a polyclonal sera against B. besnoiti or T. gondii. We observed host cell microtubules around the B. besnoiti PV after 15 min of invasion (Fig. 1A), suggesting an interaction established early after invasion. As the invasion proceeds and parasites start to replicate, the microtubules progressively present a more complex arrangement around the PV (Fig. 1A). In fact, as the number of parasites increases inside the PV, the microtubules create an alveolus-like structure surrounding each parasite, which finally originates a microtubule rosette with an organization resembling that of the parasites inside the vacuole. These structures are clearly seen at 24 h and 30 h after invasion (see zoomed detail of 24 h and 30 h in Fig. 1). The alterations of the host microtubule cytoskeleton during B. besnoiti invasion are slightly different from those observed when host cells are invaded by T. gondii (Fig. 1B). In fact, and according to what was already described in the literature (Coppens et al. Reference Coppens, Dunn, Romano, Pypaert, Zhang, Boothroyd and Joiner2006; Walker et al. Reference Walker, Hjort, Smith, Tripathi, Hornick, Hinchcliffe, Archer and Hager2008), microtubules originate a basket-like structure of microtubules around the PV, but even for longer times of invasion and higher number of parasites inside the PV (see zoomed detail for 24 and 30 h in Fig. 1B), this microtubule structure does not show the characteristic alveolar arrangement of the microtubules surrounding individual B. besnoiti inside the PV (Fig. 1A). This suggests that throughout invasion, the PV of both apicomplexan parasites interacts with the host microtubule cytoskeleton, but each of them promote distinct arrangements of these polymers. It is also important to mention that microtubule rearrangements underlying B. besnoiti and T. gondii host cell invasion, and parasite replication, are not a cell-type specific process because they were also observed in Vero cells (supplementary Fig. S1).
Host microtubule cytoskeleton rearrangement around the parasitophorous vacuole of B. besnoiti or T. gondii. Indirect immunolocalization of host cell α-tubulin during invasion by B. besnoiti and T. gondii. Different time points from 15 min to 30 h of invasion are shown. On the left side, in grey, α-tubulin shows the structure of host cell microtubules, and its organization surrounding the parasitophorous vacuoles (PV). Zoomed areas correspond to detailed views of the close interaction between host cell microtubules and PVs. On the right side α-tubulin is shown in red, parasites in green (polyclonal antibodies against B. besnoiti and T. gondii were used), and blue for DNA staining with DAPI. (A) B. besnoiti invading RPE-1 cells. (B) T. gondii invading RPE-1 cells. Scale bars = 7 μm.

Host cell centrosome is recruited by T. gondii but not by B. besnoiti
The fact that B. besnoiti and T. gondii host cell invasion and establishment of the PV trigger a response of the host cell microtubules surrounding the PV, led us to investigate if the PV membrane has the ability to nucleate/organize microtubules, being therefore involved in the remodelling of the host microtubule cytoskeleton. Previous studies reported that T. gondii infection increases the number of γ-tubulin staining foci within the host cell (Walker et al. Reference Walker, Hjort, Smith, Tripathi, Hornick, Hinchcliffe, Archer and Hager2008). These foci were described to mainly localize at the PV membrane and were consistent with the normal size of the host MTOC. Due to the differences observed between T. gondii and B. besnoiti in rearranging the host microtubule cytoskeleton, we investigated if B. besnoiti host cell invasion also originates γ-tubulin foci in the host cell, able to nucleate microtubules. For this we invaded RPE-1 cells constitutively expressing GFP-centrin, a centriolar marker, with B. besnoiti (Fig. 2A1 and A2) and T. gondii (Fig. 2B1 and B2) for 18 h, and then we depolymerized host cell microtubules by treating cells with nocodazole (30 μ m). After this period, nocodazole was removed by washing the cells with fresh medium and microtubules were allowed to recover for 5 and 15 min in order to localize microtubule nucleation sites. Then, these cells were processed for IF using a monoclonal antibody against γ-tubulin in order to localize all the sites with ability to nucleate microtubules; and with a monoclonal antibody against α-tubulin to label the recovering microtubule cytoskeleton. Either, in the case of T. gondii or B. besnoiti invaded cells, we were not able to observe the described additional foci of γ-tubulin nucleating microtubules at the PV membrane (Walker et al. Reference Walker, Hjort, Smith, Tripathi, Hornick, Hinchcliffe, Archer and Hager2008), or in their vicinity (Fig. 2).
Investigating the presence of γ-tubulin staining foci additional to the host centrosome in RPE-1 cells invaded by B. besnoiti or T. gondii. Indirect immunolocalization of B. besnoiti and T. gondii in RPE-1 cells at 18 h post-invasion and after nocodazole treatment (15 min recovery). (A1 and A2) RPE-1 cells invaded with B. besnoiti. (B1 and B2) RPE-1 cells invaded with T. gondii. Antibodies against γ-tubulin (red) and α-tubulin (green) were used. RPE-1 cells constitutively express centrin-GFP (green). DNA was stained with DAPI (blue). White circles represent the limits of each parasitophorous vacuole, which can be confirmed by the DAPI staining of the parasites’ nuclei. White arrowheads point to the host cell centrosome, which can be seen either by centrin-GFP (green), or in γ-tubulin staining (red). No other γ-tubulin foci were detected neither in B. besnoiti nor in T. gondii invaded cells. Scale bars = 7 μm.

The fact that, under our conditions, we did not observe that the PV membrane has the ability to recruit γ-tubulin and nucleate/polymerize microtubules, but B. besnoiti and T. gondii invasion provokes host microtubule rearrangements during the first steps of host cell invasion (Reis et al. Reference Reis, Cortes, Viseu Melo, Fazendeiro, Leitão and Soares2006; Walker et al. Reference Walker, Hjort, Smith, Tripathi, Hornick, Hinchcliffe, Archer and Hager2008; Sweeney et al. Reference Sweeney, Morrissette, LaChapelle and Blader2010) and during PV establishment (current work), led us to study the impact of both parasites in the centrosome. In fact, it was conceivable that the manipulation of the centrosome by the parasites could explain the observed microtubule rearrangements during host invasion. Supporting this hypothesis were the data showing that T. gondii invasion promotes the detachment of the centrosome from the nuclear envelope, which further localizes close to the PV (Coppens et al. Reference Coppens, Dunn, Romano, Pypaert, Zhang, Boothroyd and Joiner2006; Walker et al. Reference Walker, Hjort, Smith, Tripathi, Hornick, Hinchcliffe, Archer and Hager2008; Wang et al. Reference Wang, Weiss and Orlofsky2010).
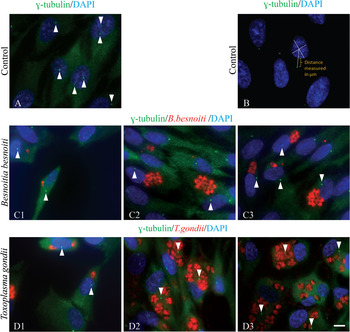
To study the impact of B. besnoiti on the host cell centrosome we used RPE-1 cells invaded for 6 and 18 h and processed the cells by IF using an antibody against γ-tubulin (to allow the identification of the microtubule nucleating centres, including centrosomes), and the polyclonal antibodies against the parasites. The referred invasion time points were selected due to the fact that they correspond to the stage in which microtubules were found to surround a well-established PV, but replication of the parasite has not occurred yet (6 h, see Fig. 1A); and a more advanced stage of microtubule reorganization, where the microtubule rosette-like structures start to be evident in B. besnoiti-invaded cells (18 h, see Fig. 1A). The results obtained are shown in Fig. 3 and a graphical view is presented in supplementary Fig. S2. In comparison with control, non-invaded RPE-1 cells, we found that RPE-1 cells invaded with B. besnoiti for 6 h do not present significant alterations, in respect to γ-tubulin staining or altered localization of the centrosomes. In fact, in a series of three independent experiments we observed that the number of invaded cells with mislocated centrosomes is similar (about 32±2·6%, n = 230) to the non-invaded RPE-1 cells (30±7·7%, n = 354). At a later stage (18 h post-invasion) there was only a slight increase of mislocated centrosomes (from 30±7·7%, n = 354, in non-invaded RPE-1 cells, to 40±1·2%, n = 452, in RPE-1 invaded by B. besnoiti), and this mislocation represents a slight increase in the average nucleus-centrosome distance, from 2±1·2 μm (n = 307) to 2·3±1·7 μm (n = 167), which is not statistically significant (student's t test; measurement exemplified in Fig. 3B). Again γ-tubulin staining was observed only at the centrosomes (Fig. 3). Therefore, and contrary to T. gondii (Coppens et al. Reference Coppens, Dunn, Romano, Pypaert, Zhang, Boothroyd and Joiner2006; Walker et al. Reference Walker, Hjort, Smith, Tripathi, Hornick, Hinchcliffe, Archer and Hager2008; Wang et al. Reference Wang, Weiss and Orlofsky2010), host cell invasion by B. besnoiti does not seem to require any significant alteration of the localization of the host cell centrosome. In this context, and to withdraw any hypothesis that the results obtained for B. besnoiti invasion were a consequence of our experimental design or manipulation, we also investigated if in our host cell invasion experimental conditions T. gondii was able to recruit the centrosome towards the PV. These experiments confirmed that RPE-1 cells at 18 h post-invasion with T. gondii present a clear increase of mislocated centrosomes (far from the nucleus – 70±2·8%, n = 727), without affecting centrosomal γ-tubulin staining, in comparison to non-invaded RPE-1 cells (control cells; 30±7·7%, n = 354). Moreover, the distance of nucleus–centrosome increases from 2±1·2 μm (n = 307) in non-invaded RPE-1 cells to 5±3·2 μm (n = 405) in invaded cells, a statistically significant difference (student's t test, P<0·005), in agreement with the results described by others (Coppens et al. Reference Coppens, Dunn, Romano, Pypaert, Zhang, Boothroyd and Joiner2006; Walker et al. Reference Walker, Hjort, Smith, Tripathi, Hornick, Hinchcliffe, Archer and Hager2008; Wang et al. Reference Wang, Weiss and Orlofsky2010). Analysis of the data obtained for 6 h after T. gondii host cell invasion shows that the recruitment of the centrosome by this parasite has not been established yet (Fig. S2A). This suggests that the phenomenon is more relevant during PV development and parasite replication than in the first steps of invasion. Additionally, the results obtained validate our experimental system for B. besnoiti, showing that, despite the fact that both parasites recruit host cell microtubules to the PV, only T. gondii consistently displaces the centrosome from the host cell nucleus to the PV membrane.
Host centrosome–nucleus position in RPE-1 host cells invaded with T. gondii or B. besnoiti. Indirect immunolocalization of T. gondii and B. besnoiti invading RPE-1 cells. Antibodies against γ-tubulin, B. besnoiti (polyclonal antibody) and T. gondii (polyclonal antibody) were used. DNA was stained with DAPI. The position of the centrosomes can be seen in green (γ-tubulin staining), in relation to the position of parasites in each parasitophorous vacuole (red) and host cell nucleus (blue). Arrowheads indicate the host centrosome positioning. (A) RPE-1 cells, non-invaded control. (B) IF imaging showing how the distance between the host cell nucleus and centrosome was measured using ImageJ software (centrosome-green; nucleus-blue). (C1) B. besnoiti, 6 h post-invasion. (C2 and C3) B. besnoiti, 18 h post-invasion – the position of the centrosome is maintained close to the host cell nucleus. (D1) T. gondii, 6 h post-invasion. (D2 and D3) T. gondii, 18 h post-invasion – note the displacement of the centrosomes away from the nuclei and closer to the parasitophorous vacuoles. Scale bar=7 μm.
Golgi recruitment in RPE-1 cells invaded by B. besnoiti and T. gondii
It is now well established that centrosome/microtubules are involved in the organization and positioning of the pericentrosomal Golgi ribbon (Bornens, Reference Bornens2012), and that the Golgi apparatus and centrosome are functionally linked (Sütterlin and Colanzi, Reference Sütterlin and Colanzi2010). Also, it has already been demonstrated that Golgi membranes are able to nucleate microtubules (Efimov et al. Reference Efimov, Kharitonov, Efimova, Loncarek, Miller, Andreyeva, Gleeson, Galjart, Maia, McLeod, Maiato, Khodjakov, Akhmanova and Kaverina2007; Rivero et al. Reference Rivero, Cardenas, Bornens and Rios2009). The fact that only T. gondii recruits the centrosome to the PV, but both parasites cause the reorganization of the host microtubule cytoskeleton, leads us to hypothesize that this could also be related to different strategies for Golgi apparatus recruitment during host infection. To test this hypothesis, RPE-1 and RPE-1 cells constitutively expressing GFP-centrin were invaded for 6 h (Fig. 4C1 and D1) and 18 h (Fig. 4C2, C3, D2 and D3) by B. besnoiti and T. gondii. The cells were processed for IF to assess the position and integrity of the Golgi apparatus in relation to the PV. For this we have used a monoclonal antibody against Golgin-97, a Golgi marker, and polyclonal antibodies against B. besnoiti and T. gondii. The position of the Golgi apparatus in relation to the centrosome was determined through GFP-centrin (Fig. 4C1 and D1).
Besnoitia besnoiti and T. gondii recruit Golgi apparatus in invaded RPE-1 cells. Indirect immunolocalization of the Golgi complex in B. besnoiti- and T. gondii-invaded RPE-1 cells. Antibodies used were B. besnoiti polyclonal antibody (green), T. gondii polyclonal antibody (green) and anti-Golgin 97 (red). DNA was stained with DAPI (blue). (A) RPE-1 cells constitutively expressing centrin-GFP, non-invaded control. (B) IF imaging showing how the measurement of Golgi diameter was performed in non-invaded RPE-1 host cells using ImageJ software (Golgi-red; centrosome-green; nucleus-blue). (C1) B. besnoiti, 6 h post-invasion. (C2 and C3) B. besnoiti, 18 h post-invasion. (D1) T. gondii, 6 h post-invasion. (D2 and D3) T. gondii, 18 h post-invasion. The relative position of the Golgi apparatus to the centrosome can be seen in A, C1 and D1, through centrin-GFP (green – white arrowheads). In red, Golgi apparatus of the invaded host cells is consistently close and around the parasitophorous vacuole of both parasites. During T. gondii invasion the Golgi ribbon is completely fragmented. Scale bar=7 μm.

Notably, and contrary to what was observed for the centrosome recruitment, both parasites seem to preferentially establish the PV close to the host cell Golgi apparatus, which was consistently found close/around the PV in invaded RPE-1 cells (Fig. 4). However, a more detailed observation revealed that both parasites affect Golgi apparatus organization differently. The establishment of the PV by B. besnoiti parasites close to the Golgi apparatus, in the majority of the cases, does not seem to cause fragmentation/disorganization, but instead to induce Golgi apparatus compaction (Fig. 4C1–C3). On the contrary, T. gondii tends to cause fragmentation and dispersion of the Golgi apparatus (Fig. 4D1–D3) which is in agreement with the data in the literature (Coppens et al. Reference Coppens, Dunn, Romano, Pypaert, Zhang, Boothroyd and Joiner2006; Walker et al. Reference Walker, Hjort, Smith, Tripathi, Hornick, Hinchcliffe, Archer and Hager2008). Indeed, in two independent experiments, at 18 h post-invasion by T. gondii, 57·1±2·5% (n = 298) of the invaded cells present a fragmented Golgi apparatus, while only 15·9±4·1% (n = 302) of cells invaded with B. besnoiti show a dispersed Golgi (value close to RPE-1 non-invaded control cells – 14·8±2·4%, n = 366) (Fig. S3B). To better analyse and quantify these observations we measured the Golgi apparatus diameter, as shown in Fig. 4B. We observed that at 18 h of invasion the Golgi diameter for cells invaded by T. gondii (11·3±4·9 μm, n = 168) was not significantly different from that of non-invaded cells (9·8±4·6 μm, n = 264), while in cells invaded by B. besnoiti the Golgi diameter (7·4±3·2 μm, n = 162) shows a statistically significant decrease in comparison to the value found in control cells (9·8±4·6 μm; one way ANOVA, P<0·05) (Fig. S3D).
It is also important to note that while there is no obvious recruitment of the centrosome by any of the parasites at 6 h of invasion (Fig. 3), in what refers to the Golgi apparatus, at 6 h of invasion it is already detected in the proximity of the T. gondii and B. besnoiti PVs (Fig. 4C1 and D1). Also, in the case of T. gondii, 33·6±1·6% (n = 283) of invaded cells already showed a fragmented Golgi apparatus (Fig. S3A).
The impact of B. besnoiti and T. gondii invasion on host cell centrosome and Golgi apparatus recruitment in cells depleted of the centrosomal protein TBCCD1
Because both T. gondii and B. besnoiti parasites recruit the Golgi apparatus during host cell invasion, but only T. gondii associates this with the simultaneous recruitment of the centrosome, we decided to investigate if in this case both events were linked. If this was so, then B. besnoiti should have a different mechanism to recruit the Golgi apparatus that does not require the recruitment of the centrosome. For this we studied the ability of T. gondii and B. besnoiti to invade and replicate in RPE-1 cells in the background of the depletion of the centrosomal protein TBCC-domain containing 1 (TBCCD1). We have recently reported that the knockdown of TBCCD1, a protein related to tubulin cofactor C involved in the tubulin folding pathway, in RPE-1 cells, causes the displacement of the centrosome from the nucleus and disorganization of the Golgi apparatus (Gonçalves et al. Reference Gonçalves, Nolasco, Nascimento, Fanarraga, Zabala and Soares2010a ). However, the major microtubule nucleating activity of the centrosome is not affected by TBCCD1 silencing. Therefore, we also investigated the ability of both parasites to recruit the centrosome and Golgi apparatus in a host cell that already has mispositioned centrosomes and disorganized Golgi apparatus.
Despite the misplacement of the centrosome caused by the TBCCD1 siRNA treatment, the PV of B. besnoiti is in close association to the nucleus, and continues to be surrounded by host microtubules (Fig. S4) in a similar way to that observed in invaded RPE-1 WT cells (Fig. 1A). Additionally, no obvious association to the mislocated centrosome was observed (Fig. 5B1–B3). In the case of T. gondii the recruitment of the centrosome is no longer obvious, as it was in invaded RPE-1 WT cells (Fig. 5C1–C3). Notably, the mispositioning of the centrosome in these cells does not affect the efficiency of invasion (data not shown), nor replication (Fig. 6A and B) of B. besnoiti and T. gondii, as shown by the results of a series of two independent assays.
Mislocated host centrosomes caused by TBCCD1 knockdown are not recruited neither by B. besnoiti nor by T. gondii. Indirect immunolocalization of T. gondii and B. besnoiti invading TBCCD1 siRNA RPE-1 cells. Antibodies were used against γ-tubulin, B. besnoiti (polyclonal antibody), and T. gondii (polyclonal antibody). DNA was stained with DAPI. The position of the centrosomes can be seen in green (γ-tubulin staining – white arrowheads), in relation to the position of each parasitophorous vacuole (red) and host cell nucleus (blue). (A) TBCCD1 siRNA RPE-1 cells, non-invaded control. (B1) B. besnoiti, 6 h post-invasion. (B2 and B3) B. besnoiti, 18 h post-invasion. (C1) T. gondii, 6 h post-invasion. (C2 and C3) T. gondii, 18 h post-invasion. In RPE-1 cells depleted of TBCCD1 the parasitophorous vacuoles of both parasites are not associated with host cell centrosomes. Scale bar=7 μm.

(A) Graphic representing B. besnoiti replication assays in cells RPE-1 RNAi for TBCCD1. (B) Graphic representing T. gondii replication assays in cells RPE-1 RNAi for TBCCD1. (C) Graphic representing B. besnoiti replication assays in cells RPE-1 over-expressing TBCCD1. (D) Graphic representing T. gondii replication assays in cells RPE-1 over-expressing TBCCD1. The mean percentage of cells (±s.d.) in two independent experiments is shown (527<n<794).

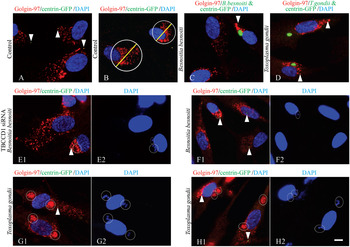
Concerning the Golgi apparatus organization and recruitment by the two parasites, we observed that in TBCCD1 siRNA-treated RPE-1 cells invaded for 6 h (Fig. 7C and D) and 18 h (Fig. 7E–H) by B. besnoiti and T. gondii, the PVs are in close association with Golgi elements that sometimes completely surround the PV. Unexpectedly, in B. besnoiti-invaded cells, after 18 h of invasion, there was an accentuated decrease in the percentage of cells presenting Golgi apparatus fragmentation/dispersion (36·4±1·9%, n = 168) in comparison to control cells (78·1±4%, n = 220). These scores were obtained from two independent experiments (see Fig. 7B for the measurement approach). This is an early phenomenon, as it can already be detected at 6 h post-invasion. Although in these cells the Golgi diameter is greatly increased since it is dispersed throughout the cytoplasm, at 18 h of invasion we can find a statistically significant difference (one way ANOVA, P<0·05) between Golgi diameter in siRNA non-invaded cells (29·9±7·4 μm, n = 138) and siRNA cells invaded by B. besnoiti (19·4±7·3 μm, n = 109). No difference is found in terms of Golgi diameter for TBCCD1 siRNA treated cells invaded by T. gondii, neither for 6 h of invasion (29±6·8 μm, n = 163) nor for 18 h of invasion (28·8±7·5 μm, n = 117). These results (summarized in Fig. S3) show that, contrary to what is observed in T. gondii invaded cells, B. besnoiti invasion causes the compaction of the Golgi apparatus, which is already observable in RPE-1 WT cells (Fig. 4), and becomes more obvious in TBCCD1 siRNA cells. Consequently, B. besnoiti invasion seems to rescue Golgi from the disorganization and dispersion provoked by TBCCD1 depletion.
Golgi apparatus organization in RPE-1 cells depleted of TBCCD1 and invaded by B. besnoiti or T. gondii. Indirect immunolocalization of host cell Golgi complex in B. besnoiti and T. gondii invaded TBCCD1 siRNA RPE-1 cells constitutively expressing centrin-GFP. Antibodies used were anti-Golgin 97 (red), B. besnoiti polyclonal antibody (in image C-green); and T. gondii polyclonal antibody (in image D-green). DNA was stained with DAPI (blue). The relative position of the Golgi apparatus to the centrosome can be determined by centrin-GFP labelling (green – white arrowheads). In images E1, F1, G1 and H1, white circles represent the limits of each parasitophorous vacuole, which can be confirmed by the DAPI staining of parasites nuclei on the right image (E2, F2, G2 and H2), and by the red staining of the parasite Golgi apparatus with anti-Golgin 97. (A) TBCCD1 siRNA RPE-1 cells constitutively expressing GFP-centrin, non-invaded control. In these cells the Golgi ribbon is fragmented and dispersed throughout the cytoplasm. (B) IF imaging showing how the measurement of Golgi diameter was performed in non-invaded RPE-1 host cells treated with siRNA TBCCD1 using ImageJ software (Golgi-red; centrosome-green; nucleus-blue). (C) B. besnoiti, 6 h post-invasion. Golgi apparatus is close to the parasitophorous vacuole, and shows less fragmentation than in the non-invaded control cells. (D) T. gondii, 6 h post-invasion. Golgi apparatus is fragmented and close to T. gondii parasitophorous vacuoles. (E and F) B. besnoiti, 18 h post-invasion. Golgi apparatus of the invaded host cells is consistently more compact (when compared with the control cells, in (A)) and close to the parasitophorous vacuoles. (G and H) T. gondii, 18 h post-invasion. Note that Golgi apparatus is completely fragmented throughout the host cell cytoplasm. Scale bar=7 μm.
Host cell centrosome recruitment in RPE-1 cells over-expressing TBCCD1 by B. besnoiti and T. gondii
Taking into account the role of TBCCD1 in nucleus-centrosome connection, and the results observed during B. besnoiti and T. gondii invasion of RPE-1 cells with decreased TBCCD1 levels, we addressed the capability of the two parasites to recruit the centrosome in RPE-1 over-expressing TBCCD1 at 6 h (Fig. 8B1 and C1) and 18 h (Fig. 8B2, B3, C2 and C3) of host cell invasion. RPE-1 cells over-expressing TBCCD1 do not present an obvious phenotype related to centrosome positioning (Fig. 8A). In the case of B. besnoiti, in what concerns host centrosome recruitment, the invasion of RPE-1 cells in the background of TBCCD1 over-expression does not significantly differ from that of WT RPE-1 invasion (Fig. 8B1–B3). In fact, in three independent experiments (Fig. S2), there is only a small increase of mislocated centrosomes, at 18 h of host cell invasion, from 23±12% (n = 445) in non-invaded RPE-1 cells over-expressing TBCCD1, to 39±12% (n = 350) when these cells are invaded by B. besnoiti. As for the distance between the nucleus and the mislocated centrosomes at 18 h of invasion, the difference is not statistically significant (student's t test), from 1·4±0·8 μm (n = 199) in non-invaded cells to 1·7±1 μm (n = 129) in invaded cells. As expected from these results, B. besnoiti shows similar rates of invasion (data not shown) and replication (Fig. 6C) in WT and over-expressing TBCCD1 RPE-1 cell lines.
Host centrosome–nucleus position in RPE-1 host cells over-expressing TBCCD1-GFP invaded with T. gondii or B. besnoiti. Indirect immunolocalization of T. gondii and B. besnoiti invading RPE-1 cells over-expressing TBCCD1-GFP. Antibodies against B. besnoiti (polyclonal antibody) and T. gondii (polyclonal antibody) were used. DNA was stained with DAPI. The position of the centrosomes is identified by TBCCD1-GFP (green – white arrowheads), in relation to the position of each parasitophorous vacuole (red) and host cell nucleus (blue). (A) RPE-1 cells, non-invaded control. (B1) B. besnoiti, 6 h post-invasion. (B2 and B3) B. besnoiti, 18 h post-invasion. (C1) T. gondii, 6 h post-invasion. (C2 and C3) T. gondii, 18 h post-invasion. Scale bar=7 μm.

Interestingly, we observed that after 18 h of invasion, the distance between the nucleus and mislocated centrosomes in T. gondii-invaded RPE-1 cells over-expressing TBCCD1 (1·6±1·2 μm, n = 167) is reduced in comparison to that measured in WT-invaded RPE-1 cells (5±3·2 μm, n = 405), and the value is very similar to that found in RPE-1 WT non-invaded cells (2·1±1·3 μm, n = 307). Additionally, the proportion of T. gondii-invaded RPE-1 cells over-expressing TBCCD1 presenting mislocation of the centrosome decreases to 40±8·2% (n = 518), in comparison to the percentage values found in RPE-1 WT cells invaded for the same period of time (70±2·8%, n = 727). These results (summarized in Fig. S2) show that T. gondii parasites have a greater difficulty to recruit the host cell centrosome in RPE-1 cells over-expressing TBCCD1 than in RPE-1 WT cells. This suggests that normally T. gondii directly/indirectly manipulates the host cell system of factors involved in centrosome–nucleus connection, as for example TBCCD1. The question, still, is why T. gondii invasion/infection requires the recruitment of the host centrosome towards the PV. Therefore, we investigated the ability of T. gondii to invade and replicate in RPE-1 cells over-expressing TBCCD1. The results of the replication assay, and the number of parasites in each PV, are presented in Fig. 6D. Notably, T. gondii replication is delayed in RPE-1 cells over-expressing TBCCD1 when compared with WT RPE-1 cells. This observation indicates that T. gondii replication requires an efficient recruitment of the host centrosome, and that it is able to manipulate the molecular mechanisms involved in the nucleus–centrosome connection. In the case of the invasion assay, no significant differences were found between T. gondii invasion of RPE-1 WT cells and RPE-1 cells over-expressing TBCCD1 (data not shown). Altogether the results show again that B. besnoiti and T. gondii parasites control different host molecular pathways during the establishment of invasion.
Golgi recruitment and organization in RPE-1 cells over-expressing TBCCD1 invaded by B. besnoiti and T. gondii
The overall appearance of Golgi apparatus in RPE-1 cells over-expressing TBCCD1 (Fig. 9A) is similar to that of RPE-1 WT cells (Fig. 4A). However, since we observed that T. gondii has an increased difficulty in recruiting the centrosome in these cells, it was interesting to investigate if this would also reflect any differences in the relationship between the Golgi apparatus organization and localization, and the PV, in comparison to RPE-1 WT-invaded cells. Thus, RPE-1 cells over-expressing TBCCD1 were invaded with T. gondii and B. besnoiti, and the invasion was stopped at 6 h (Fig. 9B1 and C1) and 18 h (Fig. 9B2, B3, C2 and C3). Comparing the results shown in Figs 4 and 9 it is clear that over-expressing TBCCD1 does not cause any difference in Golgi recruitment by T. gondii or by B. besnoiti. In a series of two independent experiments (Fig. S3A, B), we observed that at 18 h of invasion by T. gondii, RPE-1 cells over-expressing TBCCD1 present 43·9±4·1% (n = 253) of the invaded cells with a fragmented Golgi apparatus, in comparison to the 57·1±2·5% (n = 298) of the invaded cells with a fragmented Golgi apparatus in WT RPE-1 cells, and the non-invaded RPE-1 cells over-expressing TBCCD1 (15±2·5%, n = 261). The observed small decrease in the percentage of T. gondii-invaded RPE-1 cells over-expressing TBCCD1 that contain a fragmented Golgi apparatus, may be related with a more stable pericentrosomal region provided by higher levels of TBCCD1. In the case of RPE-1 cells over-expressing TBCCD1 invaded by B. besnoiti, a percentage of 14·5±3·7% (n = 257), similar to that in non-invaded RPE-1 cells over-expressing TBCCD1 (15·2±2·5%, n = 261), and to that in invaded RPE-1 WT cells (15·9±4·1%, n = 302), was found.
Golgi apparatus organization in RPE-1 cells over-expressing TBCCD1-GFP and invaded by B. besnoiti or T. gondii. Indirect immunolocalization of the Golgi complex in B. besnoiti and T. gondii invaded RPE-1 cells over-expressing TBCCD1-GFP. Antibodies used were B. besnoiti polyclonal antibody (green), T. gondii polyclonal antibody (green), and anti-Golgin 97 (red). DNA was stained with DAPI (blue). (A) RPE-1 cells over-expressing TBCCD1-GFP (green – white arrowheads), non-invaded control. (B1) B. besnoiti, 6 h post-invasion. (B2 and B3) B. besnoiti, 18 h post-invasion. (C1) T. gondii, 6 h post-invasion. (C2 and C3) T. gondii, 18 h post-invasion. In red, Golgi apparatus of the invaded host cells is consistently close and around the parasitophorous vacuole of both parasites. In B. besnoiti invaded cells, the Golgi ribbon seems to be more compact, whereas in T. gondii invasion is fragmented, when compared with non-invaded cells. Scale bar=7 μm.

The Golgi diameter parameter was also evaluated in the background of TBCCD1 over-expression during invasion by both parasites (Fig. S3C, D). In RPE-1 over-expressing TBCCD1 cells, in two independent experiments, at 18 h, cells invaded by B. besnoiti have a statistically significant decrease in Golgi apparatus diameter (6·9±3 μm, n = 149), when compared with non-invaded cells over-expressing TBCCD1 (10·3±4 μm, n = 168; one-way ANOVA, P<0·05). In the case of cells invaded by T. gondii, the Golgi apparatus diameter does not differ (10±4 μm, n = 153) from that of non-invaded cells (10·3±4 μm, n = 168).
The impact of B. besnoiti and T. gondii invasion in RPE-1 cells migration
Considering the differences described above in the recruitment of the host cell centrosome by the PVs of the two parasites, and the known involvement of the centrosome in cell motility, we compared the effects of T. gondii and B. besnoiti in the ability of cells to migrate, by performing wound-healing assays.
For this purpose RPE-1 WT cells were grown in glass coverslips and then invaded for 18 h by either T. gondii or B. besnoiti. Confluent RPE-1 WT cells were then wounded with a micropipette tip, and the wound closing was followed. At minute 0, the proportion of invaded cells in the monolayer was similar in both experiments for the two parasites: 17·85±4·5% in the experiments with B. besnoiti, and 16·55±2% in the experiments with T. gondii. Images were then captured at 120, 360 and 500 min of recovery and showed that cells invaded with T. gondii, in contrast to those invaded with B. besnoiti, present a significant delay in wound closing in comparison to control cells. The difference is visible at 500 min when control cells almost closed the wound, which in the case of cells invaded by T. gondii is still visible (Fig. 10).
Wound-healing assay in RPE-1 WT cells invaded by T. gondii and B. besnoiti. Non-invaded and invaded RPE-1 were grown to confluence, wounded and imaged for 600 min. Frames from 120, 360 and 500 min are shown. In this picture we can see that cells invaded with T. gondii show a significant delay in wound closing in comparison to control cells. This delay is not observed in cells invaded with B. besnoiti. Scale bar=50 μm.

To try to establish a relationship between the delay of wound closing in invaded cells and the ability of T. gondii to recruit the centrosome to the vicinity of the PV, we studied the orientation of the centrosome and Golgi apparatus in invaded and non-invaded cells at the leading edge of a closing wound. In fact, it has been described in several different cell types that the centrosome reorients towards the leading edge when cells are stimulated to migrate (Gomes et al. Reference Gomes, Jani and Gundersen2005; Etienne-Manneville, Reference Etienne-Manneville2008; Schmoranzer et al. Reference Schmoranzer, Fawcett, Segura, Tan, Vallee, Pawson and Gundersen2009; Vinogradova et al. Reference Vinogradova, Miller and Kaverina2009). Therefore, we observed by IF invaded and non-invaded RPE-1 cells in the periphery of the wound edge stained with an antibody against γ-tubulin (Fig. 11A1, B1, B2, C1 and C2) and Golgin-97 (Fig. 11A2, B3, B4, C3 and C4) and we found no obvious difference between the orientation of the centrosome in invaded and non-invaded cells. In two independent assays, we measured the angle between the direction of the wound and the axis connecting the centrosome and nuclear centre, in infected and non-infected WT RPE-1 cells (as exemplified in Fig. 12C) and, surprisingly, we observed that the mean angle of the centrosome towards the wound is quite similar in WT RPE-1 non-invaded cells (68±1·5, n = 587), invaded by B. besnoiti (76·7±2, n = 101) and invaded by T. gondii (70·5±2·5, n = 183), Fig. 12A. Concerning Golgi apparatus positioning, we counted the number of cells in the leading edge with a Golgi apparatus located within the 90° angle facing the wound (as shown in Fig. 12D; Hurtado et al. Reference Hurtado, Caballero, Gavilan, Cardenas, Bornens and Rios2011). The results are summarized in Fig. 12B and show that migrating cells invaded by T. gondii present a similar localization of Golgi apparatus relative to the leading-edge in comparison to those non-invaded (which is consistent with the observations in Fig. 11C3 and C4). This suggests that the delay in wound heal closing of invaded cells cannot be ascribed to problems of centrosome or Golgi apparatus positioning but must be related to other factors. In the case of RPE-1 cells invaded by B. besnoiti we found the lowest value for Golgi reorientation (62±3·9%, n = 101; Fig. 12B), andnon-invaded RPE-1 WT cells had 74±3·3% (n = 587) of cells with an oriented Golgi towards the leading edge. Interestingly, the images presented in Fig. 11C3 and C4 show that in migrating cells invaded by T. gondii the Golgi apparatus is less disorganized (non-fragmented), similar to the non-invaded cells (compare Fig. 11A2).
Indirect immunolocalization of centrosome and Golgi complex in B. besnoiti or T. gondii invaded RPE-1 cells, during wound closure migration. Antibodies used were B. besnoiti polyclonal antibody (green), T. gondii polyclonal antibody (green), anti-Golgin 97 (red) and anti-γ-tubulin (red). DNA was stained with DAPI (blue). White lines indicate the position of the wound edge. In A1, B1, B2, C1 and C2, the orientation of the host cell centrosomes towards the wound edge can be seen in red. (A1) RPE-1 cells, non-invaded control. (B1 and B2) B. besnoiti, 18 h post-invasion. (C1 and C2) T. gondii, 18 h post-invasion. In A2, B3, B4, C3 and C4 the orientation of the host cell Golgi complex can be visualized (red). (A2) RPE-1 cells, non-invaded control. (B3 and B4) B. besnoiti, 18 h post-invasion. (C3 and C4) T. gondii, 18 h post-invasion. Scale bar=20 μm.

(A) Graphic representing the angle of centrosome reorientation towards the wound leading edge, in non-invaded RPE-1 cells, and in invaded RPE-1 cells by B. besnoiti or T. gondii. (B) Graphic representing the percentage of cells with a Golgi complex reoriented towards the wound leading edge, in non-invaded RPE-1 cells, and in RPE-1 cells invaded by B. besnoiti and T. gondii. (C) Schematic IF of how the measurement of the angle of the centrosome in relation to the leading edge (white line) was performed using ImageJ software (centrosome – green; nucleus – blue). (D) Schematic IF of how the reorientation of the Golgi towards the leading edge (white line) was determined, with an example of a cell with an oriented Golgi, and another with a non-oriented Golgi. ImageJ software was used (Golgi – red; nucleus – blue). The mean angle of reorientation of the centrosome (±s.d.) and the mean percentage of cells with a reoriented Golgi (±s.d.) in two independent experiments are shown (101<n<587). Scale bars=3 μm.

DISCUSSION
Previous work by our group demonstrated that B. besnoiti invasion induces a host cell microtubule rearrangement, as microtubules start to surround the parasite upon the first minutes of invasion and originate a cone-shaped microtubule network (Reis et al. Reference Reis, Cortes, Viseu Melo, Fazendeiro, Leitão and Soares2006). In the present study we show that this rearrangement of host microtubules occurs, not only in the initial steps of host cell invasion, but also during PV establishment and parasite replication, supporting the idea that invasion requires a clear cross-talk between the host microtubule cytoskeleton and the B. besnoiti PV. This interaction was also observed during T. gondii invasion and is in accordance with what has already been described by other authors (Sehgal et al. Reference Sehgal, Bettiol, Pypaert, Wenk, Kaasch, Blader, Joiner and Coppens2005; Coppens et al. Reference Coppens, Dunn, Romano, Pypaert, Zhang, Boothroyd and Joiner2006; Walker et al. Reference Walker, Hjort, Smith, Tripathi, Hornick, Hinchcliffe, Archer and Hager2008; Sweeney et al. Reference Sweeney, Morrissette, LaChapelle and Blader2010). In fact, it is now known that host microtubules affect T. gondii invasion by hastening the time to parasites’ initiation of host cell invasion (Sweeney et al. Reference Sweeney, Morrissette, LaChapelle and Blader2010). Altogether these data support the idea that B. besnoiti and T. gondii require the establishment of an interaction with the host cell microtubule cytoskeleton from the initial to advanced steps of infection. However, this requirement does not seem to be a universal feature for the apicomplexan parasites because it was reported that the closely related Neospora caninum does not cause any alterations in the microtubule host cell cytoskeleton organization (Coppens et al. Reference Coppens, Dunn, Romano, Pypaert, Zhang, Boothroyd and Joiner2006).
Differences between distinct members of the phylum Apicomplexa in terms of how they interact with and modulate mechanisms and pathways of the host cell, can also be extended to the interaction of these parasites with the host centrosome. In general, the centrosome has a central cellular localization in close connection with the nucleus. In the majority of cell types the Golgi apparatus also adopts an organization around the centrosome, microtubules being involved in its organization and, in turn, the Golgi apparatus is also involved in microtubule nucleation (Efimov et al. Reference Efimov, Kharitonov, Efimova, Loncarek, Miller, Andreyeva, Gleeson, Galjart, Maia, McLeod, Maiato, Khodjakov, Akhmanova and Kaverina2007; Rivero et al. Reference Rivero, Cardenas, Bornens and Rios2009; Vinogradova et al. Reference Vinogradova, Miller and Kaverina2009). This internal organization of the cytoplasm creates an intrinsic polarity axis that is required for different cell activities such as formation of immune synapses, wound healing, cell migration, cell growth and differentiation (Yvon et al. Reference Yvon, Walker, Danowski, Fagerstrom, Khodjakov and Wadsworth2002; De Anda et al. Reference De Anda, Pollarolo, Da Silva, Camoletto, Feiguin and Dotti2005) and cilia assembly (Gonçalves et al. Reference Gonçalves, Tavares, Carvalhal and Soares2010b ). Having this in mind, we hypothesized that B. besnoiti and T. gondii may differentially explore this intrinsic polarity axis during host invasion, PV establishment and parasite replication. To test this hypothesis we have also investigated the position and state of organization of Golgi apparatus in cells invaded with either B. besnoiti or T. gondii. In accordance with the literature (Coppens et al. Reference Coppens, Dunn, Romano, Pypaert, Zhang, Boothroyd and Joiner2006; Walker et al. Reference Walker, Hjort, Smith, Tripathi, Hornick, Hinchcliffe, Archer and Hager2008), we observed that T. gondii invasion consistently causes the fragmentation of the host cell Golgi apparatus, and the association of this cellular compartment with T. gondii PV. Interestingly, B. besnoiti, although it does not recruit the centrosome, is also engaged in the localization of the host cell Golgi complex close to the PV. But this relocalization is not accompanied by Golgi apparatus fragmentation. It is possible that both parasites strictly require the localization of Golgi apparatus close to the PV to achieve a successful invasion. In the case of the Golgi fragmentation observed during T. gondii invasion, this may be a second effect directly caused by centrosome recruitment. In fact, loss of microtubules by depolymerizing agents causes the movement of the centrosome away from the nucleus, accompanied by Golgi disorganization (Salpingidou et al. Reference Salpingidou, Smertenko, Hausmanowa-Petrucewicz, Hussey and Hutchison2007). Also, centrosomes delocalized to positions far from the centre of the cell due to depletion of the centrosomal protein TBCCD1 cause a dramatic Golgi apparatus disorganization (Gonçalves et al. Reference Gonçalves, Nolasco, Nascimento, Fanarraga, Zabala and Soares2010a ). However, it seems that Golgi structure integrity and positioning are not critical for protein modification or global secretion (Thyberg and Moskalewski, Reference Thyberg and Moskalewski1999; Miller et al. Reference Miller, Folkmann, Maia, Efimova, Efimov and Kaverina2009; Yadav et al. Reference Yadav, Puri and Linstedt2009; Hurtado et al. Reference Hurtado, Caballero, Gavilan, Cardenas, Bornens and Rios2011), thus the fragmented Golgi in T. gondii-invaded cells could maintain its global functions. In fact, it has been shown that in the presence of a disassembled host cell Golgi, parasites are able to grow and replicate normally (Shaw et al. Reference Shaw, Compton, Roos and Tilney2000).
To try to explain the differences found between B. besnoiti and T. gondii in recruiting the host centrosome, we have studied the ability of both parasites to replicate in cells where the positioning of the centrosome and the organization of Golgi apparatus had been manipulated through changes in the expression levels of TBCCD1, a putative regulator of nucleus–centrosome connection (Gonçalves et al. Reference Gonçalves, Nolasco, Nascimento, Fanarraga, Zabala and Soares2010a ). Toxoplasma gondii presents an increased difficulty in the recruitment of the centrosome in host cells over-expressing TBCCD1, accompanied by a delay in replication. However, this delay is not observed in cells treated with TBCCD1 targeting siRNAs, where the Golgi apparatus is already disorganized. Over-expression or depletion of TBCCD1 does not affect B. besnoiti replication. Notably, in RPE-1 TBCCD1 depleted cells invaded by B. besnoiti there is a reorganization of the Golgi ribbon previously fragmented due to TBCCD1 depletion. Together, these results strongly suggest that ultimately, during host invasion, both parasites require the manipulation of Golgi apparatus organization which, in T. gondii, is achieved through Golgi disorganization and in B. besnoiti by Golgi apparatus condensation observed in wild type RPE-1 cells and more prominently in TBCCD1 RPE-1 siRNA treated cells. This would explain why, in TBCCD1-depleted cells, where Golgi is already fragmented, T. gondii presents normal rates of replication. We suggest that T. gondii achieves this disorganization by a mechanism that involves manipulation of the host centrosome that is more relevant during PV development and parasite replication. In the case of B. besnoiti it seems that this parasite developed the ability to reorganize the Golgi apparatus even if it is completely disorganized, as in the case of cells depleted of TBCCD1.
It is known that perturbing Golgi apparatus positioning, by disconnecting it from the centrosome, has a more dramatic effect on directional cell migration than disrupting the Golgi apparatus itself (Hurtado et al. Reference Hurtado, Caballero, Gavilan, Cardenas, Bornens and Rios2011). Indeed, it was described for T. gondii that the parasite is able to manipulate the migratory response of dendritic cells and macrophages, which present a hypermigratory phenotype that may facilitate parasite dissemination (Lambert et al. Reference Lambert, Hitziger, Dellacasa, Svensson and Barragan2006, Reference Lambert, Dellacasa-Lindberg and Barragan2010; Weidner et al. Reference Weidner, Kanatani, Hernández-Castañeda, Fuks, Rethi, Wallin and Barragan2013). Also, it was reported that T. gondii suppresses both centrosome reorientation and migratory response in host fibroblasts (Wang et al. Reference Wang, Weiss and Orlofsky2010). In our wound-healing assays, we observed a delay in closing the wound by cells invaded with T. gondii, but most of the cells in the edge of the wound showed an oriented centrosome and Golgi towards the leading edge, supporting the fact that the delay does not seem to be due to an altered orientation of these organelles. The discrepancy between ours and the above-mentioned published results may be explained by the use of different cell lines in the two studies. In fact, although several studies reported centrosome reorientation towards the leading edge in migrating cells (Yvon et al. Reference Yvon, Walker, Danowski, Fagerstrom, Khodjakov and Wadsworth2002), this is not true for all cell types, as positioning of the centrosome and cytoplasmic organization are highly dependent on geometrical constraints imposed by both the substratum/cellular matrix and cell–cell interactions (Pouthas et al. Reference Pouthas, Girard, Lecaudey, Gilmour, Boulin, Pepperkok and Reynaud2008; Dupin et al. Reference Dupin, Camand and Etienne-Manneville2009). Consequently, the relevance of centrosome reorientation for cell migration is still open to debate (Yvon et al. Reference Yvon, Walker, Danowski, Fagerstrom, Khodjakov and Wadsworth2002).
In conclusion, we show that B. besnoiti and T. gondii require the manipulation of the organization of Golgi apparatus, which probably creates better conditions for their replication inside the cell. However, the mechanism (or mechanisms) underlying this modulation is distinct for both parasites but probably linked to the interaction with the host cell microtubule cytoskeleton, including those microtubules nucleating from the Golgi.
SUPPLEMENTARY MATERIAL
To view supplementary material for this article, please visit http://dx.doi.org/10.1017/S0031182014000493.
ACKNOWLEDGEMENTS
We are in debt to A. Khodjakov (Wadsworth Center, USA) and I. Cheeseman (University of California, USA) for providing us with the hTERT-RPE-1-centrin–GFP cell line and the mammalian expression vectors pIC111, pIC112 and pIC113, respectively. We are also thankful to Andrea Crisanti (Imperial College London, UK, and University of Perugia, Italy) for providing us with the T. gondii ME49 SAG1-Luciferase-BAG1-GFP strain, and to Helga Waap (LNIV, Instituto Nacional de Investigação Agrária e Veterinária, Portugal) for providing us with the cat serum anti-T. gondii.
FINANCIAL SUPPORT
This study was supported by Fundação para a Ciência e a Tecnologia (FCT), Portugal: project grants PTDC/CVT/71630/2006, PTDC/CVT/105470/2008 and R.C.'s fellowship SFRH/BD/38122/2007.



