Introduction
Rhodium and selenium are rare elements with a different geochemical fate and, as a consequence, have a low probability to be combined into rhodium selenide minerals. Platinum-group elements (PGE) are constituents of more than 20 selenides from different localities worldwide (e.g. Johan et al., Reference Johan, Picot and Pierrot1970; Davis et al., Reference Davis, Clark and Criddle1977; Jebwab et al., Reference Jebwab, Cervelle, Gouet, Hubaut and Piret1992; Cook et al., Reference Cook, Wood, Gebert, Bernhardt and Medenbach1994; Polekhovskiy et al., Reference Polekhovskiy, Tarasova, Nesterov, Pakhomovskiy and Bakhchisaraitsev1997; Paar et al., Reference Paar, Roberts, Criddle and Topa1998; Roberts et al., Reference Roberts, Paar, Cooper, Topa, Criddle and Jedwab2002; Vymazalová et al., Reference Vymazalová, Laufek, Drábek, Cabral, Haloda, Sidorinová, Lehmann, Galbiatti and Drahokoupil2012; Zaykov et al., Reference Zaykov, Melekestseva, Zaykova, Kotlyarov and Kraynev2017; Barkov et al., Reference Barkov, Nikiforov, Tolstykh, Shvedov and Korolyuk2017, Reference Barkov, Nikiforov, Barkova, Korolyuk and Martin2021; Krivovichev, Reference Krivovichev2021). However, the only natural rhodium selenide reported to date is a poorly defined phase with an inferred formula (Rh,Cu)9(Se,S)11, described from chromitites of the Luobusa ophiolite deposit, Tibet, China (Bai et al., Reference Bai, Tao, Yang, Fang, Shi and Li2007).
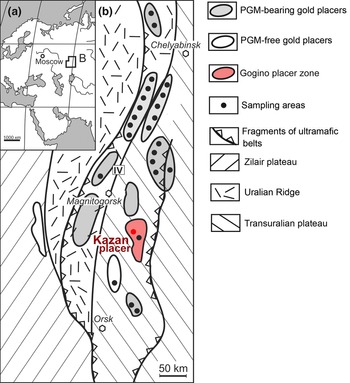
The high abundance of rhodium minerals in the platinum-group mineral (PGM)-bearing gold placers of South Urals, Russia, was established at the end of the last Century, upon the discovery of polkanovite, Rh12As7, palladodymite, (Pd,Rh)2As, and miassite, Rh17S15 (Britvin et al., Reference Britvin, Rudashevsky, Bogdanova and Shcherbachev1998, Reference Britvin, Rudashevsky, Bogdanova and Shcherbachev1999, Reference Britvin, Rudashevsky, Bogdanova and Shcherbachev2001). The PGE mineralogy of ultramafic rocks and placers of the Uralian Platinum Belt located along the Main Uralian Fault, mainly in the Middle Urals, is well studied (e.g. Stepanov et al., Reference Stepanov, Palamarchuk, Kozlov, Khanin, Varlamov and Kiseleva2019, Reference Stepanov, Palamarchuk, Antonov, Kozlov, Varlamov, Khanin and Zolotarev2020) (Fig. 1). The Rh-bearing species are represented by minerals of the kashinite–bowieite series and Ir–Rh–Pt thiospinels related to the cuproiridsite–cuprorhodsite–malanite series (Tolstykh et al., Reference Tolstykh, Telegin and Kozlov2011, Reference Tolstykh, Kozlov and Telegin2015; Malich et al., Reference Malitch, Stepanov, Badanina and Khiller2015; Stepanov et al., Reference Stepanov, Palamarchuk, Kozlov, Khanin, Varlamov and Kiseleva2019, Reference Stepanov, Palamarchuk, Antonov, Kozlov, Varlamov, Khanin and Zolotarev2020; Palamarchuk et al., Reference Palamarchuk, Stepanov, Kozlov, Khanin, Varlamov, Zolotarev, Kiseleva and Shilovskikh2020). Hollingworthite is known as a secondary mineral developed after primary Pt–Fe alloys in the Nizhny Tagil and Kamenushensky massifs (Tolstykh et al., Reference Tolstykh, Telegin and Kozlov2011, Reference Tolstykh, Kozlov and Telegin2015). Cuprorhodsite occurs among platinum-group minerals of the Nizhny Tagil and the Veresovy Bor massifs (Begizov and Zav'yalov, Reference Begizov and Zav'yalov2016). Rhodplumsite Rh3Pb2S2 and an unnamed telluride (Pb,Bi)Rh2Te3 were described from the Veresovy Bor (Stepanov et al., Reference Stepanov, Palamarchuk, Antonov, Kozlov, Varlamov, Khanin and Zolotarev2020). However, neither selenide mineralisation nor even selenium impurities in PGM of the primary and placer associations have previously been reported in the deposits belonging to the Uralian Platinum Belt (Stepanov et al., Reference Stepanov, Palamarchuk, Antonov, Kozlov, Varlamov, Khanin and Zolotarev2020).
(a) Geographic setting in the South Urals and (b) location of the main placer zones and placers with data on the placer mineral assemblages (simplified after Zaykov et al., Reference Zaykov, Melekestseva, Zaykova, Kotlyarov and Kraynev2017). The Gogino placer zone and the Kazan placer within it are marked.

The PGE mineralogy of the South Urals is much less studied (Saveliev et al., Reference Saveliev, Zaykov, Kotlyarov, Zaykova and Kraynev2017; Zaykov et al., Reference Zaykov, Samoilova, Yuminov and Belogub2011, Reference Zaykov, Savel'ev, Kotlyarov, Yuminov, Zherebtcov, Galimov and Sudarikov2012, Reference Zaykov, Melekestseva, Zaykova, Kotlyarov and Kraynev2017; Zaykova et al., Reference Zaykova, Blinov and Kotlyarov2020; Rakhimov et al., Reference Rakhimov, Saveliev, Salikhov, Vishnevskiy and Vladimirov2021a, Reference Rakhimov, Saveliev and Vishnevskiy2021b). Along with Rh minerals from the Miass river placers (Britvin et al., Reference Britvin, Rudashevsky, Bogdanova and Shcherbachev1998, Reference Britvin, Rudashevsky, Bogdanova and Shcherbachev1999, Reference Britvin, Rudashevsky, Bogdanova and Shcherbachev2001), only kashinite with traces of Rh was described in chromitite from the Vladimir deposit of the Varshav ultramafic massif (Ankushev et al., Reference Ankushev, Zaykov, Kotlyarov and Romanenko2016). Selenium-bearing PGM were first discovered by Victor Zaykov (Zaykov et al., Reference Zaykov, Melekestseva, Zaykova, Kotlyarov and Kraynev2017) as micro-inclusions of sulfides and sulfoarsenides hosted by native platinum and Ir–Os alloys from the Kazan, Malo-Iremel and Bayramgulov gold placers (the Ingul placer area) (Zaykov et al., Reference Zaykov, Melekestseva, Zaykova, Kotlyarov and Kraynev2017; Belogub et al., Reference Belogub, Zaykova, Kotlyarov, Shilovskikh, Britvin and Pautov2019).
The Kazan placer was found to be most enriched in Se–PGE minerals. In the course of ongoing research on the Kazan PGE assemblages, a new rhodium selenide, ideally Rh3Se4, was discovered in this placer. The mineral is named zaykovite, in honour of Victor Vladimirovich Zaykov (1938–2017), Russian geologist and geoarchaeologist, for his contributions to the study of PGE minerals from gold placers of the Urals and other regions (Ankushev et al., Reference Ankushev, Zaykov, Kotlyarov and Romanenko2016; Zaykov et al., Reference Zaykov, Melekestseva, Zaykova, Kotlyarov and Kraynev2017; Artem'ev and Zaykov, Reference Artem'ev and Zaykov2018). Both the mineral and its name (symbol Zay) have been approved by the Commission on New Minerals, Nomenclature and Classification of the International Mineralogical Association (IMA2019-084, Belogub et al., Reference Belogub, Britvin, Shilovskikh, Pautov, Kotlyarov and Zaykova2020). Type material is deposited in the collections of the Fersman Mineralogical Museum, Russian Academy of Sciences, Leninskiy Prospekt 18-2, Moscow 119071, Russia, registration number 5395/1.
Materials and methods
Heavy mineral concentrates enriched with PGM were given to Victor Zaikov by A.Yu. Ivanov and B.Ya. Hismatullin (OOO (limited company) “Miasskiy priisk”). The sample was collected in open pit No.3 of the Kazan placer in July, 2017.
The chemical composition of zaykovite was determined using an Oxford link REMMA 2M scanning electron microscope (SEM) with energy-dispersive spectroscopy (EDS). Operating conditions were: acceleration voltage = 20 kV, beam current = 6 nA and beam diameter = 2 μm. Reference materials were metallic Rh, Pt, Os, Ir, Ru, Pd, Au, Ag for respective metals, chalcopyrite (for S, Fe and Cu), CdSe and Bi2Se3 (for Se) using the NERMA.GEOL.25.10.74, Kyiv, 2005 standards at the South Urals Federal Research Center of Mineralogy and Geoecology. Electron microprobe analysis was done using a JEOL JCXA-733 with a wavelength dispersive spectrometer (WDS) at the Fersman Mineralogical Museum using an acceleration voltage of 20 kV, a beam current of 20 nA and a beam diameter of 2 μm. Reference materials were metallic Rh, Pt, Ir, Ru, Pd for respective metals, pyrite (for S and Fe), Bi2Se3 (for Se) and HgTe (for Te).
The formulae were calculated for 7 atoms per formula unit for the kingstonite–zaykovite series minerals, 15 atoms for the Pd–Sb–Te phase, and 1 atom for the Pt–Fe and Au–Pd alloys.
Element-distribution maps and additional data on composition were obtained at the Geomodel Resource Center (Saint Petersburg State University (SPbU), St Petersburg, Russia) on a Hitachi S-3400N SEM equipped with an Oxford Instruments X-Max 20 EDA at an accelerating voltage of 10 kV and a beam current of 1 nA spatial resolution. The spectrometer was calibrated against a set of standard natural and synthetic samples, (Micro-Analysis Consultants Ltd (MAC) standards).
The electron back-scattered diffraction (EBSD) maps were obtained using an Oxford Instruments HKL NordlysNano detector (Geomodel Resource Center, Scientific Park, SPbU) mounted on the abovementioned SEM. The acquisition conditions were as follows: 30 kV and 1.5 nA, an exposition of 0.5 s per pattern, averaging 5–10 images (when mapping) or 20 images (to obtain individual patterns), and their subsequent processing using the Channel5 software package from Oxford Instruments. Kingstonite crystal structure data (AMCSDFootnote 1 № 0014575) was used for the comparison, isoferroplatinum (ICSDFootnote 2 56275), platinum (ICSD 76153) and mertieite-II (Karimova et al., Reference Karimova, Zolotarev, Evstigneeva and Johanson2018) structure data were used as references for EBSD mapping.
Data on the orientation of the individual crystals of zaykovite are shown in Euler colour schemes, pole figures and orientation distribution density heatmaps (Mason and Schuh, Reference Mason, Schuh, Schwartz, Kumar, Adams and Field2009).
To obtain a mechanically undistorted surface, the sample for EBSD analysis was treated with a direct beam of Ar plasma using an Oxford Instruments Ionfab300 etcher, an exposition of 10 min, an angle of 45, an accelerating voltage of 500 V, a current of 200 mA and a beam diameter of 10 cm (Nanophotonics Resource Center, Scientific Park, SPbU).
Reflectance data for zaykovite were obtained using a microscope-spectrophotometer LOMO MSP-R equipped with a spectrophotometric attachment PEI “R928” (Hamamatsu, Japan) at the South Urals Federal Research Center of Mineralogy and Geoecology, Miass, Russia. The measurements were done in air using a ×40 objective with a 0.65 numerical aperture: a photometric diaphragm of 0.3 mm; an analysing area of 0.007 × 0.007 mm; a diffraction grating of 600 grooves/mm; a spectral interval of 6 nm; a voltage of 450 V and elemental silicon as a standard. The measurements were provided for the 400–700 nm range.
The zaykovite grain used for the single-crystal study was extracted from the Pt–Fe alloy matrix manually, by gentle indentation of the adjacent metal with a tungsten carbide needle. Single-crystal data were collected by means of a Bruker Kappa APEX DUO CCD diffractometer using MoKα radiation. Data collection and integration procedures were performed using Bruker APEX2 and Bruker SAINT software (Bruker Inc., Wisconsin, USA). The crystal structure of zaykovite was solved using the dual space method and refined to R 1 = 0.0158 with the SHELX-2014 set of programs (Sheldrick, Reference Sheldrick2015) via Olex2 v.1.2.8 graphical user interface (Dolomanov et al., Reference Dolomanov, Bourhis, Gildea, Howard and Puschmann2009). For mixed site occupancies, we used scattering factors of neutral atoms for Rh and Pt (sites M1–M4) and Se and S (sites X1–X4). Data collection and structure refinement details can be retrieved from the crystallographic information file (CIF) deposited with the Principal Editor of Mineralogical Magazine and available as Supplementary material (see below).
Powder X-ray diffraction data were obtained using a Rigaku R-AXIS Rapid II diffractometer with a curved (cylindrical) imaging plate detector (r = 127.4 mm). Conditions were: CoKα radiation (λ = 1.79021 Å), rotating anode (40 kV, 15 mA) with microfocus optics and a Gandolfi method with an exposure time of 60 min. The image-to-profile data conversion was completed using the osc2xrd program (Britvin et al., Reference Britvin, Dolivo-Dobrovolsky and Krzhizhanovskaya2017). The theoretical pattern was calculated on the basis of atomic coordinates obtained from the structure refinement and unit-cell parameters refined from the powder diffraction data, by means of WinXPOW software (Stoe & Cie GmbH, Darmstadt, Germany). Calculated lines having the intensity < 2 have been omitted.
Geological background for the Kazan gold placer
Zaykovite was found in a heavy mineral concentrate obtained from the Kazan gold-bearing placer, which is a part of the Gogino placer zone (Zaykov et al., Reference Zaykov, Melekestseva, Zaykova, Kotlyarov and Kraynev2017), 52°42’00”N, 60°26’27”E, located 100–150 km to the SSE from the city of Magnitogorsk in the Chelyabinsk region, Russia (Fig. 1) and includes ~20 placers, represented by the Mesozoic and Miocene karst and eluvial placers, 1.0–3.0 km long and 80–200 m wide. The most productive karst placers produced more than 2 t of gold during the period 1851–2004 with 925–901‰ fineness (Ivanishchev et al., Reference Ivanishchev, Sazonov, Savelieva and Barannikov2005). Native gold grains are mostly small and poorly rounded, which indicates proximity to the source (Zaykov et al., Reference Zaykov, Melekestseva, Zaykova, Kotlyarov and Kraynev2017).
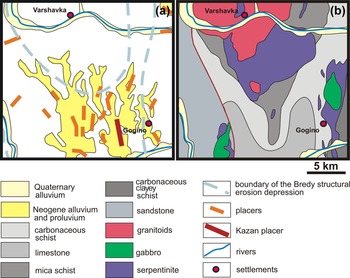
The Kazan placer is in the Bredy erosion-structural depression of Cenomanian–Upper Pleistocene age (Fig. 2a). It is located at the confluence of the Karagayly-Ayat and Kamyshly-Ayat rivers. The length of the placer exceeds 4 km with a highly variable width and a complex nesting stream-like morphology. There are no permanent watercourses in close proximity to the placer. The thickness of peat is from 1.5 to 35 m, sands from 0.2 to 4.3 m. The underlying rock is represented by karst Lower Carboniferous limestone (Fig. 2b). The Varshavka and Gogino ultramafic massifs are the nearest potential sources for platinum-group minerals (PGM) in the placer.
(a) Position of the Kazan placer on the geological map of the Gogino placer zone within the Bredy structural erosion depression and (b) geological map of the underlying Palaeozoic basement.

The placer was exploited during 1851–1910. In 1996, exploitation was restarted (unpublished report of the Geological Survey of Chelyabinsk Geological Committee).
It was previously established that the heavy mineral concentrate of the Kazan placer mainly consists of chromite, platinum alloy (min-max-mean, wt.%): Pt 76–93–90.3, Fe 2.6–9.8–7.4, Cu 0.2–4.0 and gold alloy with a fineness of 780–1000, mean ~890–900 (Zaykova et al., Reference Zaykova, Blinov and Kotlyarov2020). Pt–Fe alloy grains constitute up to 73% of all PGM in the heavy-mineral concentrate. Native metals (gold alloys and alloys of the system Os–Ir–Ru, laurite–erlichmanite, sulfarsenides (irarsite, hollingworthite), stibiopalladinite and some unnamed phases enriched with Rh, Ru and Se form inclusions within grains of Pt–Fe alloys (Zaykova et al., Reference Zaykova, Blinov and Kotlyarov2020).
The grains of Pt–Fe alloys are angular with relics of growth sculpture and imprints of other minerals, probably indicating short distances from their primary source (Zaykova et al., Reference Zaykova, Blinov and Kotlyarov2020). Laser ablation inductively-coupled plasma mass spectrometry (LA-ICP-MS) analysis of 5 grains of Pt–Fe alloy from the Kazan placer showed elevated contents of (ppm, mean) As (113), Sb (845), Au (2455), Hg (150), Rh (4640), Pd (460), Os (6890), Ir (6890), Te (1.9), Ag (2.2), Mo (4.2) and elements characteristic of chromite (Cr, Mn and V). Selenium contents were below the limit of detection of ~1 ppm (Artem'ev and Zaykov, Reference Artem'ev and Zaykov2018).
Results
Morphology, association and physical properties
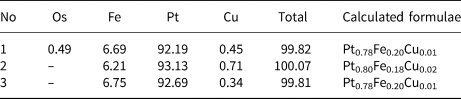
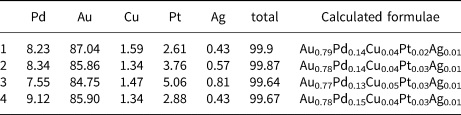
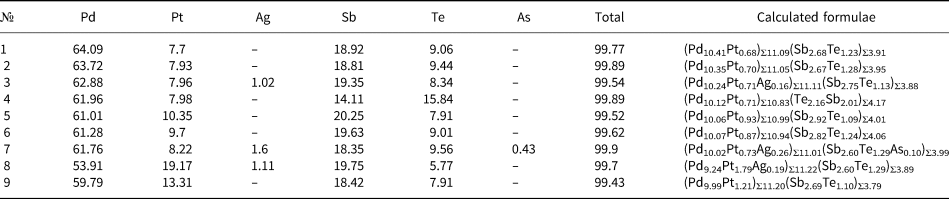
The heavy concentrate studied consisted of chromite, platinum and gold alloys. Fe–Pt alloy grains with zaykovite inclusions are ~1 mm in size and contain some Cu (Table 1). According to EBSD data the Pt–Fe alloys have a good conformity with isoferroplatinum (ICSD 56275) with mean angle deviation (MAD) of 0.20–0.28° and with platinum (ICSD 76153) with MAD of 0.23–0.4°. The EBSD patterns of isoferroplatinum and platinum are very similar and can not be reliably distinguished purely on EBSD basis, thus we use ‘Pt–Fe alloys’ as the mineral name according to Cabri and Feather (Reference Cabri and Feather1975) and Cabri et al. (Reference Cabri, Oberthur and Schumann2022). Micrometre-size inclusions of Au–Pd alloy (Table 2) and the Pd–Sb–Te phase (Table 3, Supplementary material C) occur within the grain hosting the zaykovite studied. According to EBSD the structure of Pd–Sb–Te phase is close to mertieite-II with the MAD of 0.48°.
Chemical composition of a Pt–Fe alloy grain with zaykovite inclusions (wt.%, EDS).

Notes. Dash – below limit of detection
Chemical composition of the Au–Pd alloy (wt.%, EDS).

Chemical composition of the Pd–Sb–Te phase (wt.%, EDS).

Notes. Dash – below limit of detection.
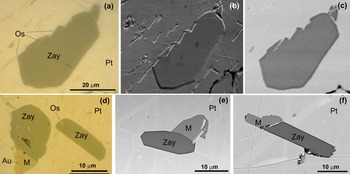
Zaykovite was found as elongated idiomorphic crystals up 40 μm in size (Fig. 3). Zaykovite forms intergrowths with a Pd–Sb–Te phase (Fig. 3d–f) and Au–Pd alloy (Fig. 3d).
Morphology of zaykovite (Zay) inclusions in the Pt–Fe alloy (Pt). (a–c) Holotype zaykovite (5395/1), single crystal with thin osmium lamellae (Os); (d) intergrowth with Pd–Sb–Te phase (M) and Pd-rich gold (Au); (e, f) intergrowth with a Pd–Sb–Te phase (M). (a, d) Photo in reflected light (oil immersion); (b) SE image tilted to 70° of the same area, after argon plasma etching; and (c, e, f) back-scattered electron (BSE) images.

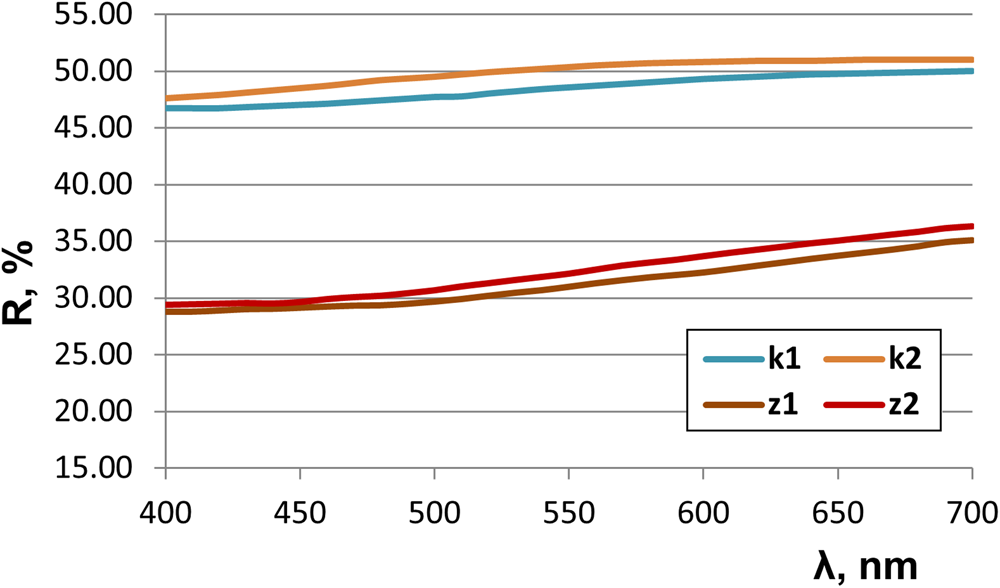
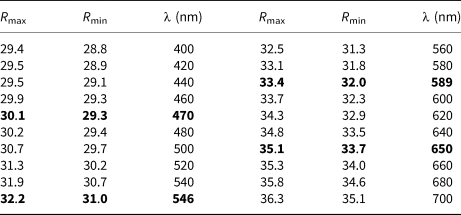
Under reflected light, zaykovite is grey with a bluish-greenish tint in comparison with the Pt–Fe alloy. It has a yellow-greenish tint in oil immersion (Figs 3a, d). Zaykovite has a metallic lustre and black streak. Polarised light reveals its weak bireflectance and anisotropy, but no internal reflexions. Reflectance values are shown in Table 4. Zaykovite has significantly lower reflectance than kingstonite (Fig. 4).
Reflection spectra of zaykovite (z1 and z2) in comparison with kingstonite (k1 and k2) (Stanley et al., Reference Stanley, Criddle, Spratt, Roberts, Szymanski and Welch2005).

Reflectance values measured in air versus Si reference standard.

The reference wavelengths required by the Commission on Ore Mineralogy (COM) are given in bold.
Zaykovite is slightly harder than the Pt–Fe alloy and softer than native osmium. Mohs hardness is estimated as 5½. Micro-indentation could not be measured because of the small size of all grains excluding the holotype which was preserved for the museum collection. Cleavage was not observed. When preparing a microsample for single-crystal diffractometry, brittle tenacity was observed. Density was calculated on the basis of structural formula and unit cell parameters, and refined from single-crystal data resulting in a value of 8.318 g⋅cm–3. Because of the small grain size the density was not measured directly. Zaykovite is non-magnetic.
Chemical composition
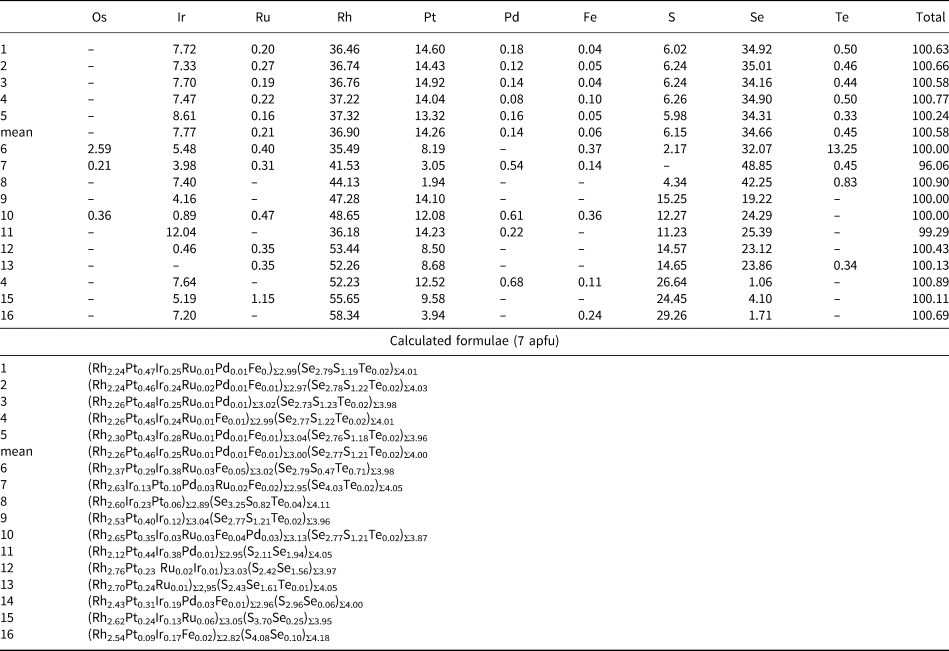
The chemical composition of the zaykovite is shown in Table 5. The empirical formula calculated on the basis of 7 atoms per formula unit is (Rh2.26Pt0.46Ir0.25Ru0.01Pd0.01Fe0.01)Σ3.00(Se2.77S1.21Te0.02)Σ4.00. The simplified formula is (Rh,Pt,Ir)3(Se,S)4. The ideal formula is Rh3Se4, which requires (wt.%): Rh 49.44 and Se 50.56.
Chemical composition of the zaykovite holotype (1–5, WDS) and minerals of kingstonite–zaykovite series from the Kazan placer (6–18, EDS) (wt.%).

Note. 1–5 – (WDA of holotype), 6–16 EDA. Dash, As, Sb – below limit of detection.
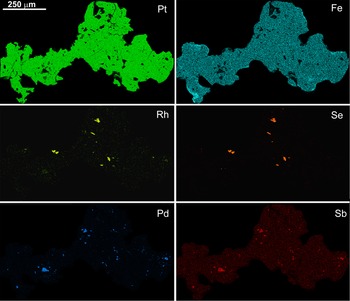
The distribution of the main elements in the Pt–Fe alloy grain studied shows that zaykovite is the only compound with Rh and Se (Fig. 5).
Elemental distribution EDS maps of Pt–Fe alloy with zaykovite and Pd–Sb–Te phase inclusions.

Crystal structure and powder X-ray diffraction
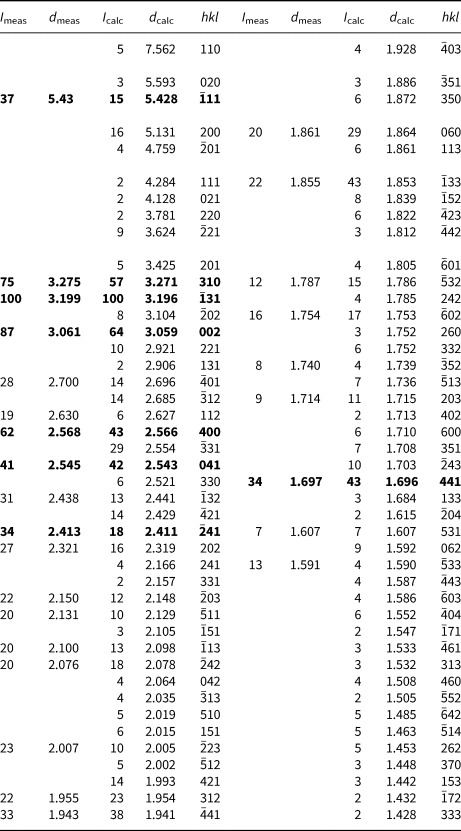
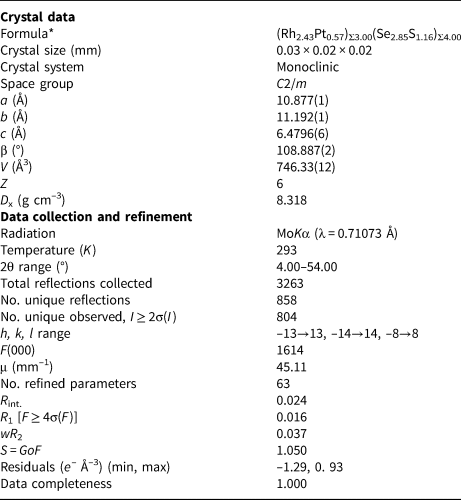
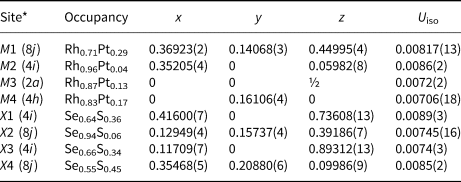
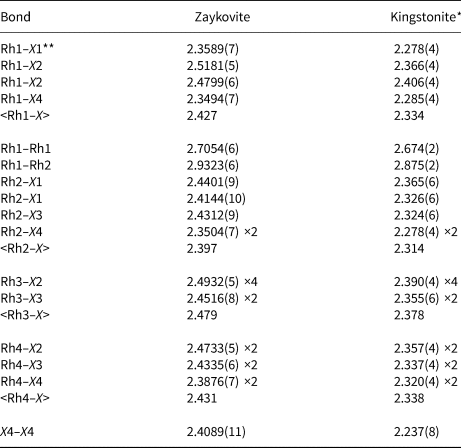
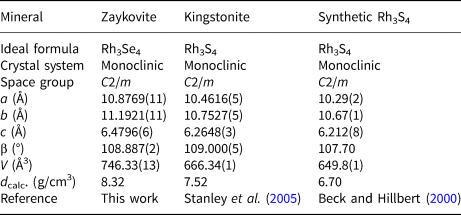
Zaykovite crystallises in the monoclinic system in space group C2/m (#12). Unit-cell parameters refined from the single-crystal X-ray data are: a = 10.8769(11), b = 11.1921(11), c = 6.4796(6) Å, β = 108.887(2)°, V = 746.33(13) Å3 and Z = 6. Unit-cell parameters obtained by the refinement of the powder X-ray diffraction data (Table 6) are: a = 10.842(13), b = 11.185(11), c = 6.463(7) Å; β = 108.81(6)°, V = 741.9(2) Å3 and Z = 6. Single-crystal X-ray data collection and structure refinement details for zaykovite are summarised in Table 7. Fractional atomic coordinates and displacement parameters in the crystal structure of the mineral are given in Table 8. Selected interatomic bond lengths are presented in Table 9. Zaykovite is a selenium-dominant analogue of kingstonite, Rh3S4 (Stanley et al., Reference Stanley, Criddle, Spratt, Roberts, Szymanski and Welch2005), and the synthetic kingstonite counterpart (Beck and Hillbert, Reference Beck and Hillbert2000) (Table 10). Despite the Rh–Se system being characterised with a wide range of compositions (Rummery and Heyding, Reference Rummery and Heyding1967), the synthetic analogue of zaykovite, Rh3Se4 has not yet been reported. Therefore, the discovery of zaykovite is a contribution to the crystal chemistry of the Rh–Se system, which now includes six structurally confirmed phases (Table 11). As expected, the compounds in this system have many structural analogues in the closely related Rh–S join (Table 11), however the selenide part is more diverse. The pyrite-type RhX 2 phases (X = Se or S) are known in both systems (Thomassen, Reference Thomassen1929; Rummery and Heyding, Reference Rummery and Heyding1967; Kjekshus et al., Reference Kjekshus, Rakke and Andresen1979), whereas Rh3Se8, with a rhombohedrally distorted pyrite structure (Kjekshus et al., Reference Kjekshus, Rakke and Andresen1979), has no sulfide analogue. The same is true for RhSe, which adopts a hexagonal close-packed nickeline structure (Rummery and Heyding, Reference Rummery and Heyding1967), but its sulfide analogue has not been reported.
Powder X-ray diffraction data (d in Å) for zaykovite.*

* The strongest lines are given in bold.
Crystal parameters, data collection and structure refinement details for zaykovite.

* Determined via site occupancy refinement.
Fractional atomic coordinates and isotropic displacement parameters (Å2) for zaykovite.

* Site multiplicities and Wyckoff symbols are given in parentheses.
Selected bond lengths (Å) for zaykovite and kingstonite.

*Stanley et al. (Reference Stanley, Criddle, Spratt, Roberts, Szymanski and Welch2005) **X = Se (zaykovite), S (kingstonite).
Comparative crystallographic data for zaykovite, kingstonite and synthetic Rh3S4.

Minerals and structurally confirmed synthetic compounds in the systems Rh–Se and Rh–S.

* Atomic ratios; X = Se or S.
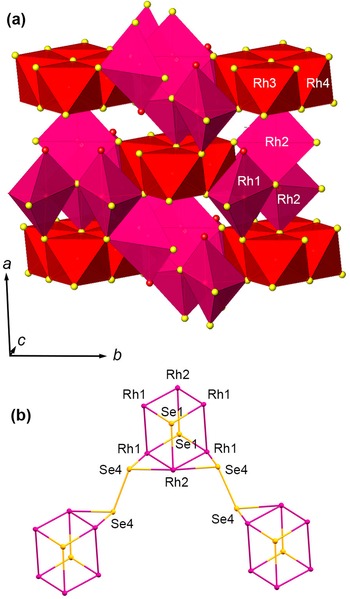
Zaykovite, as well as kingstonite, have an X:Rh ratio intermediate between that of bowieite, Rh2S3, and miassite, Rh17S15 (Table 11). Beck and Hillbert (Reference Beck and Hillbert2000), who provided a detailed description of the crystal structure of synthetic Rh3S4 (a kingstonite analogue), showed that it has similarities to the structures of Rh2S3 and Rh17S15. We highlight the main features of the zaykovite structure, which has the same topology as Rh3S4 and kingstonite, except for the longer Rh–X bond distances due to the domination of Se in the X sites (Table 9). Of four symmetrically independent Rh sites, Rh3 and Rh4 are each coordinated by 6 Se atoms to form distorted octahedra [RhSe6], similar to those in synthetic Rh2Se3 (Parthe et al., Reference Parthe, Hohnke and Hulliger1967). The [RhSe6] octahedra are connected via common edges to form 6-membered rings (Fig. 6a). The coordination of Rh1 and Rh2 sites is more complex – besides Se atoms, each of them is bonded to another Rh atom to form Rh–Rh bonds (Table 9), that results in the creation of the [Rh6] puckered rings with chair-like conformation (Fig. 6b). It is noteworthy that the domains formed by metallic-type Rh–Rh bonds similar to those in zaykovite were reported in Rh17S15 – a synthetic analogue of miassite (Schubert, Reference Schubert1977; Britvin et al., Reference Britvin, Rudashevsky, Bogdanova and Shcherbachev2001). The [Rh6] puckered rings in the zaykovite structure are arranged into the infinite framework via Se4–Se4 diselenide (pyrite-type) ‘dumbbell’ bridges (Fig. 6b). The Se4–Se4 distance in the ‘zaykovite dumbbell’ is 2.409 Å, which is, taking into account partial substitution of Se for S, almost the same as 2.499 Å in pyrite-type RhSe2 (Kjekshus et al., Reference Kjekshus, Rakke and Andresen1979).
The crystal structure of zaykovite. (a) Polyhedral representation; a three-dimensional framework composed of two cluster types: (1) Clusters of corner-sharing [Rh(RhSe4)] and [RhSe5] distorted square pyramids (coordination around Rh1 and Rh2 atoms) and (2) Clusters of edge-sharing octahedra [RhSe6] (around Rh3 and Rh4 atoms). (b) Ball-and-stick representation of six-membered Rh1-Rh2 clusters, which form pseudo-cubic cages together with Se1 atoms. These clusters are connected in a framework via Se4–Se4 diselenide (pyrite-type) dumbbells. The scale and orientation of structural fragments is the same in (a) and (b).

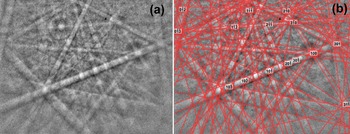
The EBSD pattern of zaykovite (Fig. 7a) is well resolved by the theoretical structure of kingstonite (AMCSD 0014575) with a MAD of 0.37° on the basis of maximum of 12 bands (Fig. 7b).
EBSD pattern of (a) zaykovite and (b) the theoretical kingstonite solution fitted over the pattern.

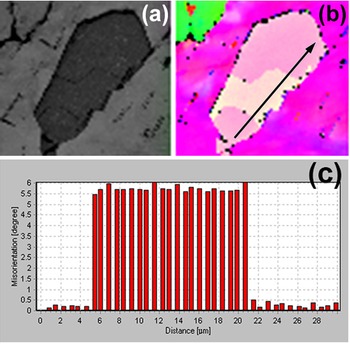
The Kikuchi band contrast shows that zaykovite forms homogeneous grains with a tendency to form euhedral crystals with pronounced crystallographic facets (Fig. 8a). It forms single crystals, elongated along the [001] axis (Fig. 8b, 9b). The holotype crystal consists of two blocks, in which orientation differs by 5.5° (Fig 8c).
(a) Band contrast, (b) orientation in Euler colours, and (c) misorientation profile of the holotype zaykovite crystal. Line of the profile is shown in (b).

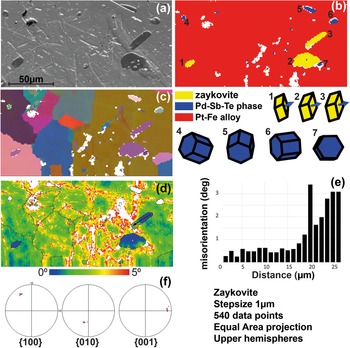
BSE image (a), phase distribution with orientation of the zaykovite and Pd–Sb–Te grains, blue arrow shows [001] axis of zaykovite (b), and EBSD maps (c–d) of Pt–Fe alloy matrix containing zaykovite and mertieite in Euler angles colour scheme with zaykovite cell orientations (c), grains boundaries (d), misorientations profile of the zaykovite grain No.3 (e), and pole figures for zaykovite grains (f).

An unexpected result was obtained through EBSD mapping of an area that contains several grains of zaykovite and a Pd–Sb–Te phase in a Pt–Fe alloy matrix (Fig. 9). Pd–Sb–Te phase grains have a chaotic orientation typical of late inclusions, however three zaykovite grains in two different platinum subgrains have the same orientation. The only viable explanation except accidental coincidence is that formation of zaykovite precedes crystallisation of the Pt–Fe alloy and zaykovite inherits the primary orientation of a protophase. Also, the zaykovite grains manifest ductility, that is seen on the misorientation map as a gradual colour change from the point where the grain contacts with the distorted bands in the Pt–Fe alloy. Unfortunately, a potential correlation between zaykovite distortion and distortion of the Pd–Sb–Te phase, as well as their host Pt–Fe alloy cannot be resolved because of the high degree of surface distortion during polishing.
Discussion
Chemical composition
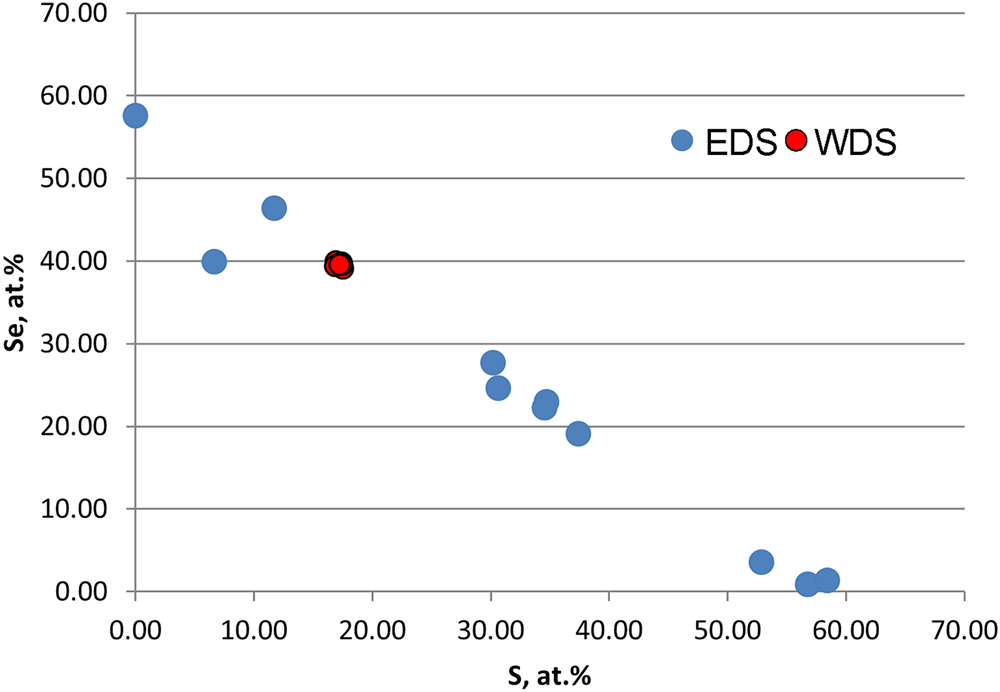
The chemical composition of selenium-bearing rhodium-dominant sulfide inclusions in Pt–Fe alloy grains of the Kazan placer was analysed using energy dispersive spectroscopy (EDS). (Table 4). The negative correlation between S and Se contents in these inclusions indicates a continuous isomorphic series between kingstonite and zaykovite (Fig. 10).
S–Se plot for the zaykovite–kingstonite series for specimens from the Kazan placer.

Origin of the zaykovite
The sources of gold in the placer probably were gold–sulfide and gold–quartz occurrences in the Lower Carboniferous sedimentary rocks, represented by carbonaceous and clayey shale, siltstone and limestone. Only the Tambov vein-disseminated gold–sulfide–quartz ore deposit is known in the vicinity of the placer (Podkorytov, Reference Podkorytov2001).
Sources of PGM may be the Varshav and Mogutovsky serpentinised dunite–harzburgite massifs, as well as the Gogino gabbro–pyroxenite–dunite zoned massif (Zaykov et al., Reference Zaykov, Savel'ev and Zaykova2018). However, the finds of laurite, iridium sulfide close to kashinite, and unspecified iridium arsenide were described only for the Vladimir chromite deposit located in the Varshavka massif (Zaykov et al., Reference Zaykov, Savel'ev, Kotlyarov, Yuminov, Zherebtcov, Galimov and Sudarikov2012, Reference Zaykov, Savel'ev and Zaykova2018; Ankushev et al., Reference Ankushev, Zaykov, Kotlyarov and Romanenko2016). It has been suggested that the eroded ultramafic massif or its upper part may also be a source of PGM in the Kazan placer.
At present, it is proposed that minerals of the laurite–erlichmanite series, kashinite and some PGE thiospinels are formed at the late stage of magmatic crystallisation of PGM in the ultramafic massif (Tolstykh et al., Reference Tolstykh, Telegin and Kozlov2011, Reference Tolstykh, Kozlov and Telegin2015; Mochalov, Reference Mochalov2013). The absence of a Se and Rh admixture in the Pt–Fe alloy (Artenm'ev and Zaykov, Reference Artem'ev and Zaykov2018) suggests, that the presence of selenides is not the result of solid-solution decomposition.
Based on the euhedral form of the inclusions of bowieite–kashinite and cuprorhodsite in early-formed Pt–Fe alloy grains, their crystallisation from melt during the early magmatic stages has been suggested (Zaccarini et al., Reference Zaccarini, Bindi, Pushkarev, Garuti and Bakker2016; Stepanov et al., Reference Stepanov, Palamarchuk, Antonov, Kozlov, Varlamov, Khanin and Zolotarev2020). The thermodynamic advantage of crystallisation of Rh3S4 in terms of the Gibbs energy minimisation in comparison with phases with other Rh:S ratios has been proven experimentally (Jacob and Gupta, Reference Jacob and Gupta2014). The crystallochemical similarity of selenium and sulfur suggests a similar tendency for rhodium selenides.
The crystallisation of native osmium, iridium and laurite from a melt has been confirmed experimentally (Brenan and Andrews, Reference Brenan and Andrews2001). The pronounced euhedral shape of zaykovite indicates its crystallisation before or coevally with the Pt–Fe alloy. The identical orientations of zaykovite crystals hosted in the different Pt–Fe alloy subgrains also favour the early magmatic crystallisation hypothesis, assuming that the trapped Os lamellae (Fig. 3) represent the earliest magmatic phase.
Conclusion
Zaykovite, ideally Rh3Se4 was found as inclusions in Pt–Fe alloy grains in heavy mineral concentrates of the Kazan gold placer (South Urals). Zaykovite forms crystals up to 40 μm in size intergrown with an unnamed Pd–Sb–Te phase and Au–Pd alloy. Its empirical formulae is (Rh2.26Pt0.46Ir0.25Ru0.01Pd0.01Fe0.01)Σ3.00(Se2.77S1.21Te0.02)Σ4.00. The mineral is grey with black streak and has a metallic lustre. It is the Se analogue of kingstonite with the monoclinic structure and space group C2/m. The crystal structure was solved using single-crystal diffraction data. Unit-cell parameters are a = 10.877(1), b = 11.192(1), c =6.4796(6)Å and β = 108.887(2). The composition of the studied inclusions in the Pt–Fe alloy grains indicates the existence of a continuous kingstonite–zaykovite series. The Varshavka and Mogutovsky serpentinised dunite–harzburgite massifs, as well as the Gogino gabbro–pyroxenite–dunite zoned massif could be sources of PGM including zaykovite in the Kazan placer. The euhedral habit of zaykovite points to its probable crystallisation before or simultaneously with Pt–Fe alloy, although slightly later than native osmium.
Acknowledgements
The authors are grateful to A.Yu. Ivanov and B.Ya. Hismatullin (“Miasskiy Priisk”) for heavy mineral concentrates from the Kazan placer, Maksim Lozhkin (Nanophotonics Resource Center, SPSU) for preparation of the sample surface for EBSD mapping and the Geomodel Resource Center for making the EBSD analysis possible. We also thank Marina Yudovskaya, Oleg Siidra, an anonymous reviewer and Associate Editor Frantisek Laufek for the fruitful comments and linguistic corrections. The work was supported by state contract no. 075-00880-22-00.
Competing interests
The authors declare none.
Supplementary material
To view supplementary material for this article, please visit https://doi.org/10.1180/mgm.2022.122