Antimicrobial resistance is among the most urgent public health problems today. A key strategy in combatting antimicrobial resistance is the promotion of antimicrobial stewardship. Although early efforts at antimicrobial stewardship have largely focused on hospitalized patients, there are tremendous opportunities to improve outpatient antimicrobial prescribing. Outpatients account for the majority of all antimicrobials prescribed,Reference Llor and Bjerrum 1 , 2 and in a nationwide study of ambulatory care, at least 30% of antimicrobial prescriptions were unnecessary.Reference Fleming-Dutra, Hersh and Shapiro 3
Increasingly, the need for outpatient antimicrobial stewardship has been recognized. In 2015, the White House released a National Action Plan, which called for a 50% decrease in inappropriate antimicrobial use among outpatients. 4 In 2016, the Centers for Disease Control and Prevention (CDC) published a toolkit to assist ambulatory care sites in implementing stewardship processes.Reference Sanchez, Fleming-Dutra, Roberts and Hicks 5
Monitoring antimicrobial prescribing is an essential part of outpatient stewardship. Audit and feedback, preferably performed at the level of the individual prescriber, can be achieved through manual chart reviews or through electronic extraction of data.Reference Sanchez, Fleming-Dutra, Roberts and Hicks 5 Each of these approaches offers its drawbacks. Manual chart reviews are labor intensive, whereas the electronic extraction of data often relies on the use of International Classification of Disease, Tenth Revision (ICD-10) codes, which may not be accurate.
In this study, we sought to define the accuracy of ICD-10 codes, which could be used in outpatient antimicrobial-prescribing metrics, and we explored whether electronically extracted data could identify outpatient providers who are more likely to prescribe unnecessary antimicrobials. Each portion of this analysis evaluates a potentially important data point that could be used in automated outpatient antimicrobial audits.
METHODS
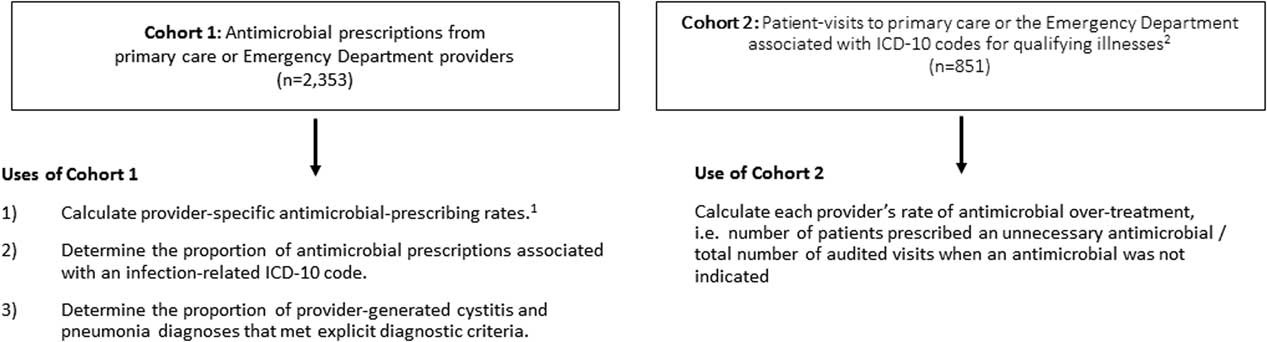
The Iowa City Veterans Affairs Medical Center serves veterans in eastern Iowa and northwestern Illinois. In this study, we analyzed 2 retrospective cohorts of outpatients seen between January 1, 2016, and December 31, 2016, at the medical center’s emergency department (ED) or its primary care clinics. Primary care clinics include 3 teaching-based clinics, 1 women’s health clinic, and an outlying community-based clinic. Figure 1 demonstrates how each cohort was developed and used.
Study population flowchart. 1. Antimicrobial-prescribing rote=number of antimicrobial prescriptions / number of patient-visits. 2. Qualifying illnesses: bronchitis, cystitis, chronic obstructive pulmonary disease (COPD) with acute exacerbation, influenza, otitis media, pharyngitis, pneumonia, sinusitis, and upper respiratory tract infection (URI).

Cohort 1
The first cohort consisted of all patients who received an antimicrobial prescription from a provider in the primary care setting or the emergency department (ED). Antimicrobials included fluconazole, oseltamivir, and all antibacterial agents on the medical center’s nonrestricted formulary: amoxicillin, amoxicillin-clavulanate, azithromycin, cefdinir, cefpodoxime, cefuroxime, cephalexin, ciprofloxacin, clarithromycin, clindamycin, dicloxacillin, doxycycline, levofloxacin, metronidazole, minocycline, moxifloxacin, nitrofurantoin, penicillin, rifampin, sulfamethoxazole/trimethoprim, and vancomycin (oral). Patients could be included multiple times if they received >1 antimicrobial during study dates.
For each antimicrobial prescription, an infection-related diagnosis was sought that was associated with an ICD-10 code entered by the provider within 2 days of the prescription. A list of eligible infection-related diagnoses can be found in Supplemental Table 1.Reference Fleming-Dutra, Hersh and Shapiro 3 If >1 infection-related ICD-10 code had been entered by the provider, chart review was performed to identify the provider’s primary reason for prescribing antimicrobials. If no infection-related ICD-10 code was entered by the provider, chart review was also performed to identify the provider’s diagnosis. An initial review of all cases was performed by a fourth-year pharmacy student (C.L.), and a secondary review was performed by an infectious disease (ID) physician (D.L.).
For all cases of cystitis and pneumonia, the provider’s diagnosis was validated by an ID physician (D.L.) using standardized criteria.Reference Meyer, Lund, Heintz, Alexander, Egge and Livorsi 6 , Reference Postma, van Werkhoven and van Elden 7 For cystitis, the diagnosis was confirmed if there was documentation of an acute onset of cystitis symptoms (eg, dysuria, frequency, hematuria, and/or urgency) and a urinalysis that showed a positive leukocyte esterase, a positive nitrite, or >5 white blood cells per high-power field. A positive urine culture was not required; this information would not have been available to the provider at the time of prescribing antimicrobials. For pneumonia, the diagnosis was confirmed if the patient had (1) the acute onset of new or worsening cough, dyspnea, fevers, hypoxemia, leukocytosis, purulent sputum, and/or tachypnea and (2) radiographic findings that showed a new or enlarging infiltrate or, in the absence of radiography, focal findings on physical exanimation of the chest (eg, dullness to percussion, egophony, bronchial breath sounds, or crackles/rales). Cases were excluded from review if the infection was complicated, if documentation or testing was incomplete, or if the provider was simply extending a prior antimicrobial prescription or prescribing for a future episode of infection.
The sensitivity, specificity, positive predictive value (PPV), and negative predictive value (NPV) of ICD-10 codes were assessed using standard methods.
Cohort 2
The second cohort consisted of patients seen by a provider in primary care or the ED with 1 of the following conditions: bronchitis, cystitis, chronic obstructive pulmonary disease (COPD) with acute exacerbation, influenza, otitis media, pharyngitis, pneumonia, sinusitis, and upper respiratory tract infection (URI). Cases were identified by ICD-10 codes (Supplemental Table 2). Patients could be included multiple times if they had >1 visit during the study period. Visits associated with trainees were assigned to the supervising providers.
For each eligible visit, a manual chart review was performed to assess whether antimicrobials were indicated. Chart audits were performed by forth-year pharmacy students with oversight by the ID pharmacy specialist (B.H.). Auditors reviewed cases using standardized protocols based on published guidelines, which providers were educated on during the study dates (Supplemental Figures 1–9).Reference Meyer, Lund, Heintz, Alexander, Egge and Livorsi 6 , Reference Harris, Hicks and Qaseem 8 – Reference Mandell, Wunderink and Anzueto 10 If the provider’s diagnosis was incorrect, the diagnosis was reclassified based on the protocol and the appropriate criteria were applied. All cases determined to receive unnecessary antimicrobials were reviewed by an ID physician (D.L.) for verification. In addition, additional cases were referred for physician-review as directed by the protocols; in these cases, full adjudication was performed by the ID physician. Cases that did not fit any of the protocols or had already been prescribed antimicrobials for the specific illness were excluded. To prevent bias, all manual chart reviews were completed before calculating clinic and provider-specific volume-adjusted antimicrobial-prescribing rates.
Comparison of Cohorts 1 and 2
Using cohort 1, a volume-adjusted antimicrobial prescribing rate was determined by extracting data on all antimicrobials prescribed by a provider during 2016 and adjusting for the total number of patient visits during 2016 for that provider. Prescriptions and visits associated with trainees were excluded from the numerator and denominator, respectively. Using cohort 2, an overtreatment rate was calculated for each provider by determining the frequency at which antimicrobials were prescribed when not indicated (ie, number of patients prescribed an unnecessary antimicrobial divided by the total number of audited visits when an antimicrobial was not indicated).
A correlation analysis was performed comparing provider-specific volume-adjusted antimicrobial prescribing rates to provider-specific overtreatment rates. Providers needed to have at least 10 audited visits to be included in the correlation analysis. Statistical analyses were performed using SAS version 9.4 (SAS Institute, Cary, NC).
The institutional review board of the University of Iowa and the Research and Development Committee of the Iowa City Veterans Affairs Medical Center determined that this study was a quality improvement project and not human subjects research.
RESULTS
Cohort 1: All Antimicrobial Prescriptions
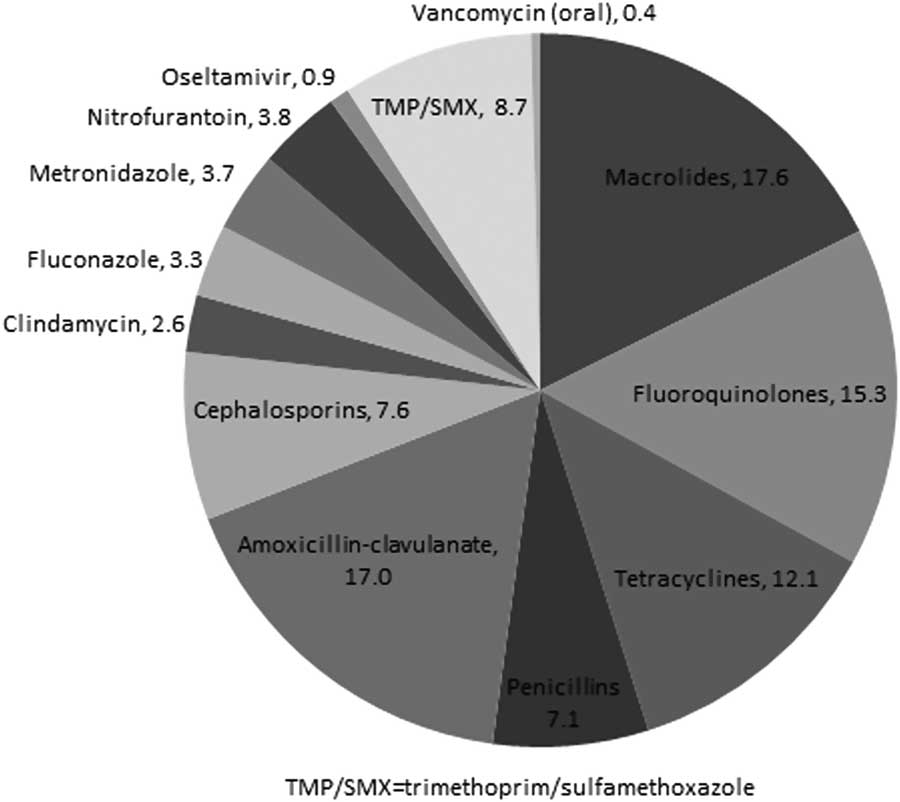
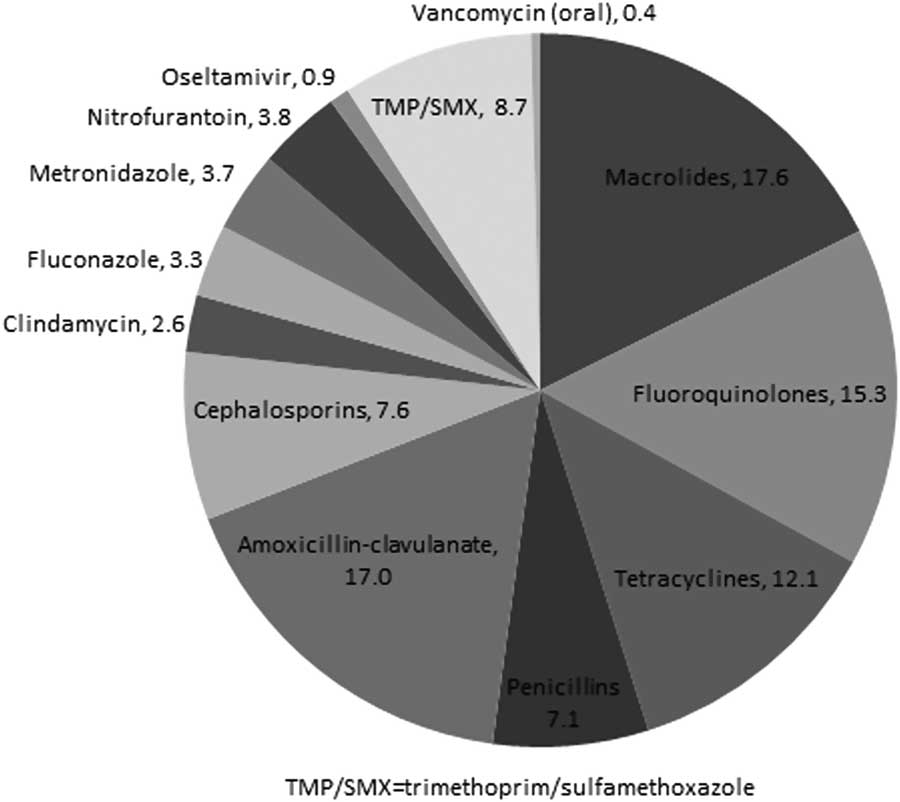
In total 2,353 antimicrobial prescriptions were made by 52 providers across 24,156 visits. The most commonly prescribed antimicrobials were macrolides (17.6%), amoxicillin-clavulanate (17.0%), and fluoroquinolones (15.3%, Figure 2). The volume-adjusted antimicrobial prescribing rate was 13.6 prescriptions per every 100 ED visits and 7.5 prescriptions per every 100 primary-care visits.
Types of outpatient antimicrobials prescribed at the Iowa City VAMC during 2016, categorized by drug class
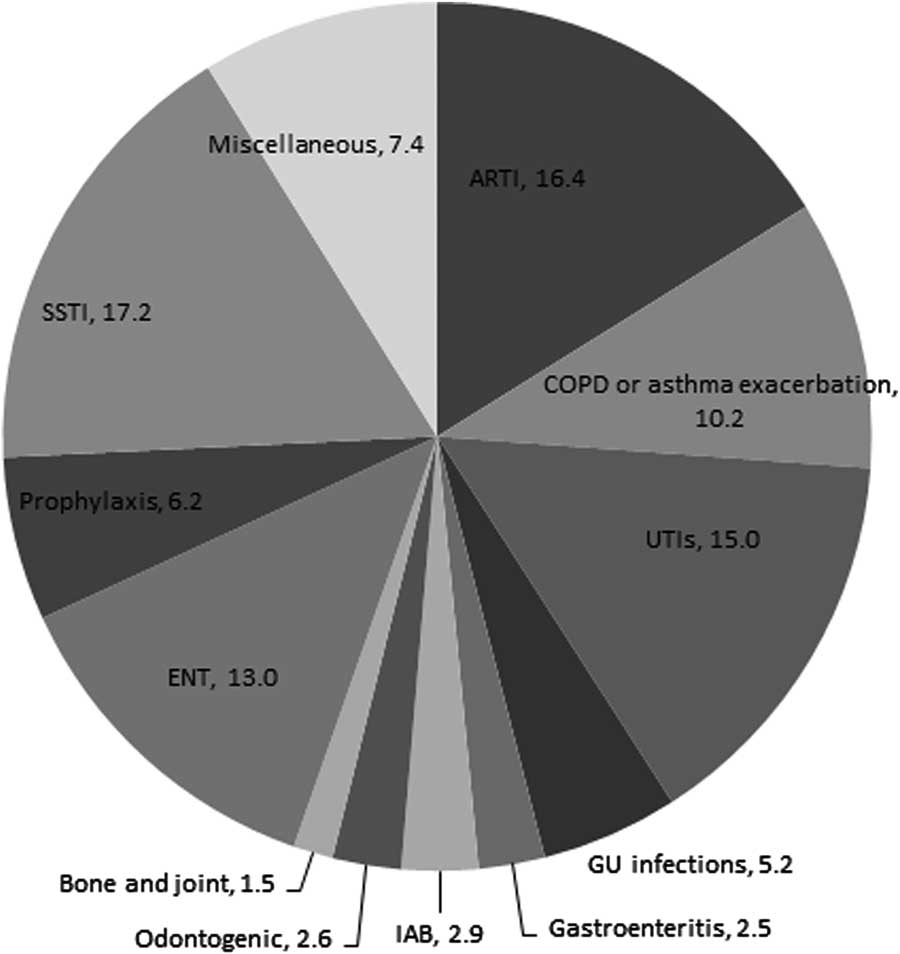
As shown in Figure 3, the most common indication for prescribing antimicrobials were skin and soft-tissue infections (SSTIs, 17.2%), acute respiratory tract infections (ARTIs, 16.4%), urinary tract infections (UTIs, 15.0%), ear, nose, and throat (ENT) infections (13%), and acute exacerbations of asthma and COPD (10.2%). Prophylaxis was stated as the indication in 6.2% of cases. Reasons for antimicrobial prophylaxis included international travel, periprocedural prophylaxis (eg, dental procedures), wound prophylaxis, and prevention of recurrent infections, such as cellulitis, COPD exacerbations, and UTIs. The indication for antimicrobials was inferred in 1,178 cases (50.1%) based on entered ICD-10 codes; for the remaining 1,175 prescriptions (49.9%), chart review was performed because the associated ICD-10 codes did not fit predefined categories.
Diagnostic codes associated with 2,353 outpatient antimicrobial prescriptions at the Iowa City VAMC, 2016. ARTls, or acute respiratory tract infections, included bronchitis, pneumonia, upper respiratory tract infections, and symptoms of an ARTl (e.g. cough). ENT, or ear, nose and throat infections, included otitis media, otitis externa, parotitis, pertussis, pharyngitis, and rhinosinusitis. GU, or genitourinary infections, included male and female GU infections but not UTls. IAB, or intra-abdominal infections, included anorectal abscesses, cholecystitis, and diverticulitis. SSTls, or skin and soft tissue infections, included carbuncles, cellulitis, erysieplas, furuncles, impetigo, paronychia, and skin abscesses. UTls, or urinary tract infections, included cystitis and pyelonephritis.

Among 17 providers who wrote ≥20 antimicrobial prescriptions, the median frequency of entering an infection-related ICD-10 code was 60.2% (interquartile range [IQR], 44.7%–75.0%). There was significant variability across providers in the frequency of using infection-related ICD-10 codes when an antimicrobial was prescribed (P<.01).
Accuracy of Diagnostic Coding
In 339 cases, the provider diagnosed cystitis. The accuracy of the provider’s diagnosis was not assessed in 48 cases (14.2%) for 1 of the following reasons: complicated infection such as catheter-associated or infection beyond the bladder (n=21), urinalysis not performed (n=12), prescription of self-directed therapy for future UTIs (n=9), incomplete documentation (n=3), and continuation of an existing antimicrobial prescription (n=3). Of the remaining 291 cases, 74.4% of cases with an ICD-10 code entered for cystitis were found to have documented findings meeting diagnostic criteria for cystitis. In contrast, 52.9% of cases in which the provider documented cystitis in the visit note but failed to enter an ICD-10 code had documented findings meeting diagnostic criteria for cystitis (P<.01). The sensitivity, specificity, PPV, and NPV of a cystitis-related ICD-10 code for validated cystitis was as follows: 65.8%, 57.4%, 74.4%, 47.2%, respectively.
In 98 cases, the provider diagnosed pneumonia. The accuracy of the provider’s diagnosis was not assessed in 2 cases because all testing was performed at an outside facility (n=1) or because the antimicrobial prescription was a continuation of a previous course (n=1). Of the remaining 96 cases, 52.5% of cases in which the records had an ICD-10 code for pneumonia were found to have documented findings meeting diagnostic criteria for pneumonia. In contrast, 64.9% of cases in which the provider documented pneumonia in the visit note but failed to enter an ICD-10 code actually had documented findings meeting diagnostic criteria for pneumonia (P=.23). The sensitivity, specificity, PPV, NPV of a pneumonia-related ICD-10 code for validated pneumonia was as follows: 56.3%, 31.7%, 52.5%, and 35.1%, respectively.
Cohort 2: ICD-10 Codes for ARTIs and Cystitis
Manual audits to determine antimicrobial necessity were performed on 851 visits: 615 ED visits and 236 primary care visits (Supplemental Figure 10). Antimicrobials were not indicated in 474 visits (55.7%), including 53.7% of audited ED visits and 61.0% of audited primary care visits. Antimicrobials were still prescribed (overtreatment) in 52.1% of these cases (ED 48.8%, primary care 59.7%). Reasons for overtreatment were as follows: bronchitis (42.5%), acute sinusitis that did not meet criteria for antimicrobials (16.6%), URIs (16.2%), asymptomatic bacteriuria/pyuria (11.7%), non-streptococcal pharyngitis (6.5%), and COPD exacerbations not meeting criteria for antimicrobials (4.9%).
Comparison of Cohorts 1 and 2
For 14 ED providers, the median antimicrobial-prescribing volume was 14.2 prescriptions per 100 patient visits (IQR, 13.4–15.3), and the median overtreatment rate was 47% (IQR, 28%–64%). Among 7 primary care providers, the median volume-adjusted antimicrobial prescribing rate was 8.1 prescriptions per 100 patient visits (IQR, 7.3–8.6), and the median overtreatment rate was 33% (IQR, 31%–59%).
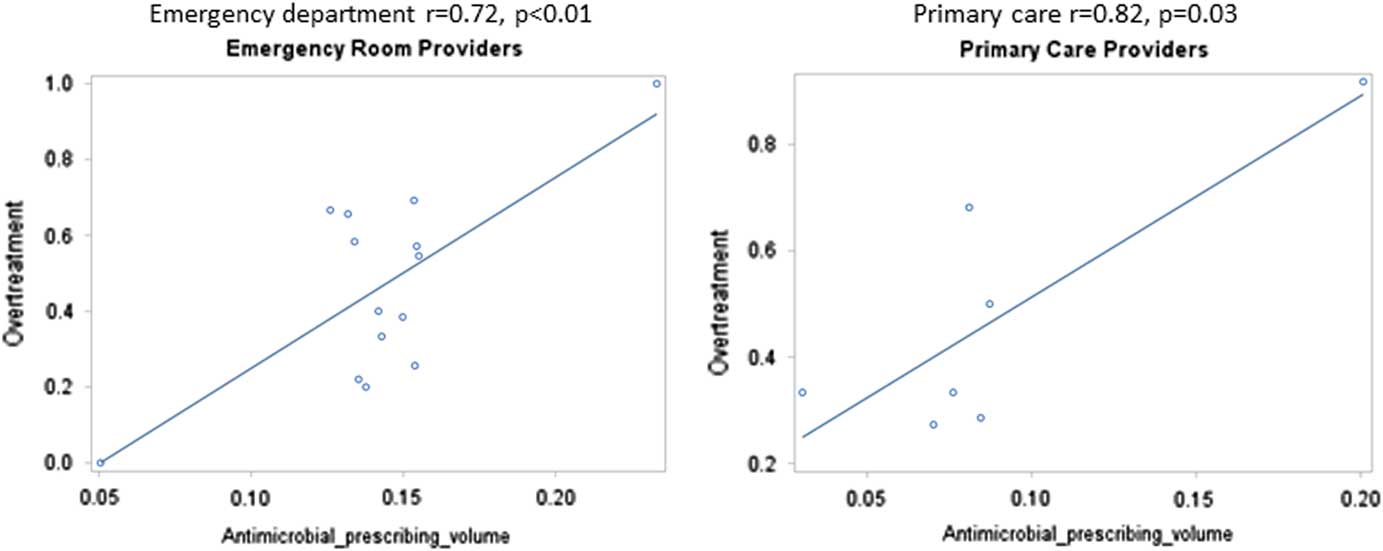
There was a positive correlation (Figure 4) between a provider’s volume-adjusted antimicrobial prescribing rate and the provider’s rate of overtreatment in both the ED (r=0.72; P<.01) and the primary care setting (r=0.82; P=.03). Because one of the primary-care physicians saw exclusively female patients, a repeat correlation analysis was performed excluding all cases of candidiasis, cystitis, and other genitourinary infections—all of which are more common in females. In this repeat analysis, a similar correlation was seen (r=0.80; P=.03).
Correlation between antimicrobial over-treatment and the volume-adjusted antimicrobial-prescribing rate

DISCUSSION
Improving the use of antimicrobials across ambulatory care will require the development of meaningful metrics based on data that are readily available. While ICD-10 codes and antimicrobial prescriptions can be electronically extracted from the medical record, it is unclear how these data can be used to evaluate an outpatient provider’s antimicrobial prescribing behavior. Our study included several findings that may inform automated audits of antimicrobial prescribing. First, we found that ICD-10 codes may not be a reliable tool for assessing antimicrobial necessity because these codes are not consistently entered and are frequently incorrect. In addition, among our small provider cohort, we found that a provider’s volume-adjusted antimicrobial prescribing rate, which can be electronically extracted and is not influenced by coding practices, strongly correlated with the frequency at which unnecessary antimicrobials were prescribed.
Although ICD codes are frequently used to assess the appropriateness of outpatient antimicrobial prescribing, the accuracy of these codes is poorly defined. In our study, the sensitivity and PPV of ICD-10 codes for both cystitis and pneumonia was relatively limited. The sensitivity for validated cases of cystitis and pneumonia was 65.8% and 56.3%, respectively, while the PPV was 74.4% and 52.5%, respectively. Prior studies have found that ICD codes for COPD exacerbations, pneumonia, and SSTIs have a PPV greater than 80%–90%.Reference Ginde, Tsai, Blanc and Camargo 11 – Reference van de Garde, Oosterheert, Bonten, Kaplan and Leufkens 14 However, most of these studies did not assess false negatives, so sensitivity could not be calculated. In general, studies that have assessed the validity of diagnostic codes over a range of infectious and noninfectious syndromes have shown mixed results.Reference Ginde, Tsai, Blanc and Camargo 11 , Reference Misset, Nakache and Vesin 15 , Reference Goto, Ohl, Schweizer and Perencevich 16
Further confounding the reliability of ICD codes is the possibility that physicians may manipulate these codes, particularly in the context of being audited.Reference Sanchez, Fleming-Dutra, Roberts and Hicks 5 , Reference Szymczak, Feemster, Zaoutis and Gerber 17 This phenomenon, known as diagnostic shifting, was not detected in several large outpatient stewardship intervention trials,Reference Meeker, Linder and Fox 18 – Reference Gerber, Prasad and Fiks 20 but it is possible that all types of gaming behavior were not assessed.
In our small cohort of providers, we found a strong positive correlation between a provider’s volume-adjusted antimicrobial prescribing rate and the provider’s rate of overtreatment. Quantifying antimicrobial usage per patient visits avoids the pitfalls of diagnostic codes while offering several additional advantages. For one, total antimicrobial-prescribing volume can be electronically extracted with relative ease from a central data warehouse. Second, as shown in this study, providers who prescribe more antimicrobials also tend to prescribe more unnecessary antimicrobials. This association seems intuitive, but to our knowledge, it has not been confirmed through manual chart audits like those we have performed. To confirm these findings, studies among larger cohorts of providers are needed.
Comparing providers within a given setting on their total antimicrobial usage may facilitate reductions in unnecessary prescribing. A large study among general practitioners in England found that peer comparisons based on antimicrobial-prescribing volume facilitated reductions in overall antimicrobial use.Reference Hallsworth, Chadborn and Sallis 21 Feedback was provided to >3,000 practitioners who prescribed antimicrobials at a rate higher than 80% of their peers. Compared to the control group, providers who received this feedback significantly decreased their antimicrobial prescribing by 3.3%.
Future studies should assess other factors that influence a provider’s antimicrobial-prescribing volume. As seen in this cohort, the site of practice is an important determinant. Usage was higher in our medical center’s ED than in the primary care setting. Likewise, a nationwide study from 2007–2009 reported that the average rate of antimicrobial prescribing was 9% in outpatient practices and 21% in the ED.Reference Shapiro, Hicks, Pavia and Hersh 22 Other key determinants of antimicrobial usage may include patient case mix and the provider’s level of training.Reference Sanchez, Hersh, Shapiro, Cawley and Hicks 23
Our study has some strengths. We manually audited >1,000 charts in cohort 1 and >800 charts in cohort 2. In addition, by selecting on antimicrobial prescription, we were able to determine the sensitivity and PPV of ICD-10 codes for 2 conditions that commonly require antimicrobials: cystitis and pneumonia.
Our study also has some limitations. First, we did not assess the use of some commonly prescribed antivirals, such as acyclovir and valacyclovir, nor the use of several agents restricted at our facility, such as linezolid, fosfomycin, and antifungals other than fluconazole. Second, manual chart audits in cohort 2 were based on ICD-10 codes, so providers who were more consistent about entering codes were also more frequently audited. Third, we did not assess inter-reporter reliability between pharmacist and physician audits, and a physician did not overread cohort 2 cases in which the initial auditor deemed antimicrobials to be warranted. Fourth, in both the ED and primary care setting, the correlation demonstrated between volume-adjusted antimicrobial prescribing and antimicrobial overtreatment was driven largely by 2 outlier providers. Fifth, our findings reflect a single medical center and a relatively small sample of providers, which may limit its generalizability. Furthermore, our findings on ICD-10 codes may not be generalizable to nonfederal healthcare facilities that rely more heavily on reimbursements from third-party payers. In these facilities, we would expect that diagnostic codes are more frequently entered, but diagnostic inaccuracies may persist. A relatively high frequency of misdiagnosis has been identified in other settings.Reference Braykov, Morgan, Schweizer, Uslan, Kelesidis and Weisenberg 24 , Reference Filice, Drekonja, Thurn, Hamann, Masoud and Johnson 25
In conclusion, antimicrobial audits based on ICD-10 codes were unreliable at our medical center because codes were inconsistently entered and had poor accuracy. If diagnostic codes are incorporated into future antimicrobial-prescribing metrics, a more thorough validation of these codes will be needed. One alternative to code-based metrics would be provider-specific antimicrobial usage. We showed that electronically extracted data on a provider’s rate of volume-adjusted antimicrobial prescribing strongly correlated with the frequency at which unnecessary antimicrobials were prescribed. This finding was based on a relatively small sample size and needs to be validated in larger cohorts. However, this finding suggests that comparing providers within a given outpatient setting on their volume-adjusted antimicrobial prescribing rate may be an efficient way to identify overprescribers who, in turn, could be targeted through further stewardship interventions.
ACKNOWLEDGMENTS
The authors thank the pharmacy students who helped perform chart audits: Kristen Peterson, Courtney Converse, Addy Rickels, Meagan Adamsick, Rachel Grolmus, Renu Johnson, Emily Matthews, and Hayley Wittnebel.
Financial support: This study was supported by Veterans Administration Health Services Research and Development Centers of Innovation (VA HSR&D COIN): Center for Comprehensive Access & Delivery Research Evaluation (CADRE) (grant no. CIN 13-412).
Potential conflicts of interest: All authors report no conflicts of interest relevant to this article.
SUPPLEMENTARY MATERIAL
To view supplementary material for this article, please visit https://doi.org/10.1017/ice.2017.250