





Impact statement
Utility planning still relies on SAIDI, SAIFI, and CAIDI. These indices record routine outages, exclude major storms, and treat customers as if their circumstances were the same. This perspective places those indices alongside social vulnerability, energy affordability, and hurricane exposure across Louisiana’s 64 parishes. These conditions do not coincide. Six scoring scenarios, each tied to a recognizable policy priority, produce different investment orders. Orleans Parish ranks first where restoration speed is weighted most heavily and 16th where social need is. Concordia Parish ranks third under a social need weighting and 53rd under a network reliability weighting. The choice of weights therefore decides which communities are served first. Entergy Louisiana’s resilience plan, at 1.9 billion dollars, recovers its expense through a uniform charge of up to 7.19 dollars per month, while the state’s poorest households already spend about 17 percent of income on energy. Evidence on willingness to pay in Louisiana, separated by income, does not yet exist. Regulators, utilities, and communities need these rankings published side by side, together with that missing evidence. The same question arises wherever severe weather, fragmented utilities, and high energy costs coincide.
Introduction
Energy insecurity, the condition in which households cannot afford adequate and reliable energy services, is a defining challenge for sustainable energy transitions. Few states face energy insecurity as acutely as Louisiana, where residents pay more for electricity relative to income than most states but depend on one of the least reliable grids in the country (WRKF, 2025). Since 2000, Louisiana has experienced 57 billion-dollar weather disasters (Louisiana Department of Energy and Natural Resources, Office of Energy, 2024), with hurricanes alone inflicting cumulative property damages exceeding $30 billion. The state’s lowest-income households spend ~17% of their income on energy, roughly one dollar in every five (Sierra Club, 2025). The Louisiana electric power grid is extensive and institutionally fragmented.
In April 2024, the Louisiana Public Service Commission approved Entergy Louisiana’s $1.9 billion “Future Ready Resilience Plan,” adding up to $7.19 per month to customer bills by 2029 (Entergy Louisiana, 2024). This raises fundamental questions about where resilience investments should be directed and by what criteria. It also raises a fairness question: because these costs are recovered through a uniform per-customer rate rider, the additional burden falls disproportionately on households already spending the highest share of their income on energy, making community-level willingness and ability to pay a critical input that current planning frameworks do not capture.
The prevailing approach relies on utility-reported reliability indices (SAIDI, SAIFI and CAIDI). Reliability and resilience are not the same. The former measures routine grid failures, while the latter captures the broader ability to absorb and recover from high-impact disruptions. Because major storm events are excluded from SAIDI and SAIFI calculations under Institute of Electrical and Electronics Engineers (IEEE) Standard 1366, the events that matter most for resilience are the very ones that standard metrics exclude (Payne, Reference Payne2025).
Recent frameworks have begun to address this gap. Sandia’s Social Burden model integrates social vulnerability into utility planning (Hart et al., Reference Hart, AmandaWachtel, McCombs, Brockway and Chwierut2024), Pacific Northwest National Laboratory’s (PNNL) Multi-Objective Distribution (MOD)-Plan combines resilience with social and decarbonization objectives (Pierre et al., Reference Pierre, Broderick, DeMenno, Paladino and Yoshimura2022), and Popovich et al. (Reference Popovich, Figueroa, Sunter and Shah2024) mapped disadvantaged communities at the census tract level. Yet the practical consequences for investment priority rankings have not been made visible.
This article advances three central arguments shown in Figure 1. First, energy insecurity and electricity resilience are inseparable; social vulnerability, energy affordability, storm exposure and network reliability intersect in ways that no single metric can capture. Second, investment priority rankings shift substantially depending on which dimension is emphasized, a sensitivity we term the “prioritization paradox.” Third, willingness-to-pay data for resilience improvements is nearly absent despite billions in planned grid investment. As a perspective article, the contribution does not stem from a novel analytical method, given that the observation that different objectives produce different rankings is already well established in multi-criteria decision analysis (Malczewski, Reference Malczewski2006), and quantitative optimization frameworks have been proposed to embed equity directly into energy investment decisions (Heleno et al., Reference Heleno, Sigrin, Popovich, Heeter, Figueroa, Reiner and Reames2022). Instead, this work contributes by making the prioritization paradox spatially explicit and numerically concrete within a live regulatory context. While prior frameworks have acknowledged the theoretical multidimensionality of resilience (Pierre et al., Reference Pierre, Broderick, DeMenno, Paladino and Yoshimura2022; Hart et al., Reference Hart, AmandaWachtel, McCombs, Brockway and Chwierut2024), this article demonstrates precisely how large the rank shifts are, identifies which specific communities are systematically overlooked under each policy posture and highlights the exact demand-side data gap that must be resolved before any weighting scheme can claim democratic legitimacy. Louisiana serves as an ideal case study because the simultaneous convergence of the nation’s highest residential energy burden, extreme hurricane exposure, an active multibillion-dollar investment program and a complete absence of state-specific willingness-to-pay data makes it the most policy-urgent context in which to demonstrate these dynamics. Furthermore, the analytical framework is directly transferable to any region facing compound hazard exposure, including winter-storm-prone areas of the Southern Plains (Clark et al., Reference Clark, Peterson, Shelly and Jeffers2023; Peterson et al., Reference Peterson, Clark, Shelly and Horn2024) and wildfire-exposed utilities in the Western United States.
Multidimensional energy resilience planning.

Resilience is multidimensional
SAIDI, SAIFI and CAIDI remain the dominant basis for evaluating grid performance, yet their limitations systematically disadvantage energy-burdened communities. Excluding major event days filters out the catastrophic outages most devastating to vulnerable households (Payne, Reference Payne2025). For households lacking backup power or financial reserves, access to critical services during outages is unequal and spatially uneven (Hart et al., Reference Hart, AmandaWachtel, McCombs, Brockway and Chwierut2024). Because SAIDI and SAIFI improve most efficiently by restoring large customer blocks first, utilities are structurally incentivized to prioritize densely populated areas, often at the expense of rural communities (Rao et al., Reference Rao, Scaggs, Asuan and Roque2025). The social burden of infrastructure disruptions extends well beyond hurricane events, as analyses of Winter Storm Uri in Texas reveal comparable patterns of inequitable household impact across income and vulnerability strata (Peterson et al., Reference Peterson, Clark, Shelly and Horn2024). To address these challenges, a generalizable, equity-focused metric for quantifying this burden across diverse hazard types has been developed (Clark et al., Reference Clark, Peterson, Shelly and Jeffers2023), lending strong methodological support to the multidimensional framework applied here.
Drawing on publicly available federal data for Louisiana, we identify four dimensions through which energy insecurity and grid resilience intersect, and that any holistic planning framework must address simultaneously: social vulnerability, energy affordability, storm exposure and network reliability (Figure 1). The network reliability dimension is operationalized through three standard indicators, SAIDI, SAIFI and CAIDI, each of which is mapped separately in Figure 2 and used as a distinct input in the six-factor scoring framework.
Parish-level heatmaps illustrating the low cross-correlation among six resilience dimensions across Louisiana’s 64 parishes. (a) Energy Burden: share of household income spent on energy costs (source: US Census/DOE); higher values indicate greater affordability stress. (b) Social Vulnerability Index (SVI): CDC/ATSDR composite index (2022 edition) capturing socioeconomic status, household composition, minority status and housing/transportation factors; higher values indicate greater vulnerability. (c) Hurricane Exposure: number of recorded hurricane events per parish since 2000; higher values indicate greater storm risk. (d) SAIDI (System Average Interruption Duration Index): average total duration of interruptions per customer per year; higher values indicate longer outages. (e) SAIFI (System Average Interruption Frequency Index): average number of interruptions per customer per year; higher values indicate more frequent outages. (f) CAIDI (Customer Average Interruption Duration Index): average duration per interruption event; higher values indicate slower restoration. In all panels, colors range from green (low) to red (high). The visually distinct spatial patterns across panels confirm that social vulnerability, energy burden, storm exposure and grid unreliability do not coincide geographically, meaning that optimizing for any single dimension systematically neglects communities that are vulnerable along others.

Figure 2. Long description
A six-panel grid of Louisiana parish maps.
Top-left panel, Energy Burden: High values (red) are concentrated in the Northwest and along the Mississippi River in the East. Low values (green) are found in the Southwest and Southeast coastal areas.
Top-center panel, S V I: High vulnerability (red) is scattered across the North and Central regions, with significant clusters in the Southeast. Low vulnerability (green) is primarily in the Southwest and suburban areas near the Southeast.
Top-right panel, Hurricane: A clear South-to-North gradient. High exposure (red) is concentrated in the Southeast coastal parishes, transitioning to moderate (orange) in the Southwest and low (green) in the North.
Bottom-left panel, S A I D I: High outage duration (red/orange) is widespread across the South and Central regions, with lower values (green/yellow) in the North and specific Central-East parishes.
Bottom-center panel, S A I F I: High outage frequency (orange) is dominant in the South and Central-West. Lower frequency (green/yellow) is visible in the North and a narrow corridor in the Southeast.
Bottom-right panel, C A I D I: High restoration times (red) are most prominent in the Northwest and Southwest, while the Southeast and Central-East show moderate to low values (orange to green).
Social vulnerability, measured by the CDC/ATSDR Social Vulnerability Index (SVI), ranges from 0.89 in St. Helena Parish to 0.27 in Cameron Parish (Centers for Disease Control and Prevention and Agency for Toxic Substances and Disease Registry, 2022). Energy affordability varies widely. Census tracts in Caddo and Webster parishes face energy burdens of 11–12% (U.S. Department of Energy, 2023), while the state’s poorest households spend 17% of income on energy (Sierra Club, 2025). Storm exposure is equally uneven. Coastal parishes such as Lafourche and Terrebonne have each experienced 11 recorded hurricane events, while inland parishes such as Caldwell and Union have experienced none (Louisiana Department of Energy and Natural Resources, Office of Energy, 2024).
Network reliability data across Louisiana’s utilities reveal extreme variation. For instance, Beauregard Electric Cooperative reports a SAIDI of 966.6 min per customer per year, which equates to over 16 h, whereas Entergy New Orleans reports 140.8 min (Louisiana Legislative Auditor, 2025). Cooperative utilities serving rural areas with longer lines and fewer redundancies consistently underperform investor-owned utilities, a dynamic that imposes a structural reliability penalty on the communities least equipped to absorb it (Rao et al., Reference Rao, Scaggs, Asuan and Roque2025). The supplier landscape itself spans 4 investor-owned utilities, 11 cooperatives and over 20 municipals. This diverse market ranges from Entergy Louisiana, which serves 1.1 million customers, to small systems serving fewer than 400 retail customers (Louisiana Legislative Auditor, 2025). This fragmentation shapes not only local reliability outcomes but also the broader institutional capacity for resilience investment.
These dimensions do not move together, as Figure 2 makes clear. Spatial patterns for energy burden, SVI and hurricane exposure are strikingly different, and optimizing for any single dimension systematically neglects communities that are vulnerable along others.
The prioritization paradox
Before presenting the analysis, we define three terms used throughout. A dimension is a broad planning domain (e.g., network reliability or social vulnerability). A metric is a measurable indicator used to operationalize a dimension (e.g., SAIDI as a metric within the network reliability dimension). A scenario is a weighted combination of metrics reflecting a specific policy orientation. Each scenario already integrates multiple metrics; the prioritization paradox arises not from comparing single metrics but from comparing the composite rankings that result when different policy orientations determine how those metrics are weighted. To illustrate what multidimensionality means in practice, we constructed six scenario-based priority scores for each of Louisiana’s 64 parishes, each assigning different weights to six input factors (energy burden, SVI, SAIDI, SAIFI, CAIDI and hurricane exposure) on a 0–100 scale. Each scenario corresponds to a recognizable policy posture rather than an arbitrary weight combination. Specifically, the weighting structures reflect five distinct planning orientations documented in the resilience and energy justice literature. The first is a social-need-first prioritization, which is reflected in equity-centered frameworks such as the Sandia Social Burden model (Hart et al., Reference Hart, AmandaWachtel, McCombs, Brockway and Chwierut2024) and the Justice40 initiative guidelines. The second focuses on utility-driven network reliability optimization, an approach that underlies standard regulatory investment justification (Louisiana Legislative Auditor, 2025). The third orientation emphasizes fast-recovery resilience, consistent with FEMA and emergency management restoration priorities (Pierre et al., Reference Pierre, Broderick, DeMenno, Paladino and Yoshimura2022). Fourth, a storm-weighted equity approach reflects the risk-exposure framing frequently used in climate vulnerability assessments (Rao et al., Reference Rao, Scaggs, Asuan and Roque2025). Finally, an affordability-reliability gap posture aligns closely with consumer advocate and low-income energy justice perspectives (Popovich et al., Reference Popovich, Figueroa, Sunter and Shah2024). The sixth scenario, IPS, represents the arithmetic mean of these five orientations and serves as a neutral composite. While no single utility or regulator currently applies all six frameworks simultaneously, presenting them together makes visible how fundamentally the final rankings depend on which specific posture is selected.
-
• SEB (Social-Energy Balance): EB 0.40, SVI 0.25, SAIDI 0.20, SAIFI 0.10, HURR 0.05. Top parish: Evangeline (75.6).
-
• NR (Network Reliability): SAIDI 0.40, SAIFI 0.25, CAIDI 0.20, HURR 0.10, SVI 0.05. Top parish: Allen (70.2).
-
• FRR (Fast Recovery Resilience): CAIDI 0.40, HURR 0.25, SAIDI 0.20, SVI 0.10, EB 0.05. Top parish: Orleans (58.8).
-
• SWE (Storm-Weighted): HURR 0.40, SVI 0.25, EB 0.20, SAIDI 0.10, SAIFI 0.05. Top parish: Washington (70.8).
-
• ARG (Affordability-Reliability Gap): EB 0.40, SAIDI 0.25, SAIFI 0.20, CAIDI 0.10, SVI 0.05. Top parish: Evangeline (70.2).
-
• IPS (Integrated Priority Score): arithmetic mean of the five scenarios above. Top parish: Allen (59.9).
Table 1 presents the top 10 parishes under each scenario. The rankings prove fundamentally unstable, and which communities receive help first depends entirely on the weighting chosen.
The prioritization paradox: Top 10 parishes under six resilience scenarios

Table 1. Long description
The table consists of 10 ranked rows and 6 main scenario columns, each subdivided into Parish and Score.
1. S E B (Social-Energy Balance): Top 3 are Evangeline (75.6), Washington (66.9), and Concordia (65.6).
2. N R (Network Reliability): Top 3 are Allen (70.2), Calcasieu (68.6), and Jeff. Davis (67.6).
3. F R R (Fast Recovery Resilience): Top 3 are Orleans (58.8), Caddo (56.4), and De Soto (56.4).
4. S W E (Storm-Weighted Equity): Top 3 are Washington (70.8), Orleans (67.5), and St. Bernard (66.9).
5. A R G (Affordability-Reliability Gap): Top 3 are Evangeline (70.2), Allen (68.0), and Calcasieu (65.4).
6. I P S (Integrated Priority Score): Top 3 are Allen (59.9), Evangeline (59.8), and Orleans (57.3).
Other parishes appearing in the top 10 across various scenarios include Rapides, Iberia, St. Helena, Avoyelles, East Carroll, Tangipahoa, St. Tammany, Lafourche, St. Mary, Terrebonne, Jefferson, Vernon, and Beauregard. Scores range from a high of 75.6 (Evangeline in S E B) to a low of 39.9 (Allen in F R R) within these top-10 lists.
Note: Each column ranks parishes under a different weighting of six input factors (EB, SVI, SAIDI, SAIFI, CAIDI and HURR). Scores range from 0 to 100. SEB = Social-Energy Balance; NR = Network Reliability; FRR = Fast Recovery Resilience; SWE = Storm-Weighted Equity; ARG = Affordability-Reliability Gap; IPS = Integrated Priority Score (mean of the five preceding scenarios).
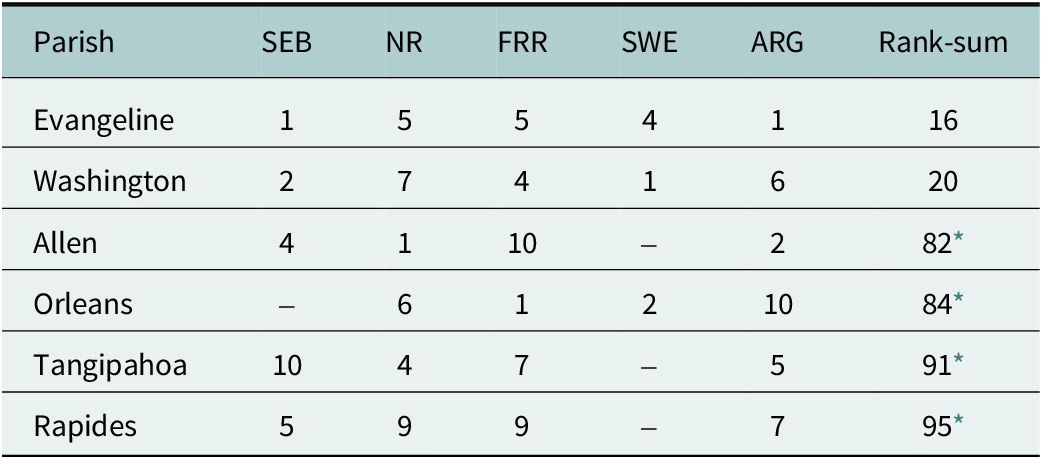
Orleans Parish ranks 1st for fast recovery resilience (FRR) but 16th for social-energy balance (SEB). A framework focused on restoration speed would place it at the top of the investment queue, while one focused on social need would address 15 other parishes first. Concordia Parish presents the starkest divergence. It ranks 3rd under SEB but 53rd under NR, making it nearly invisible under reliability-based metrics yet among the highest priorities under social-need ones. To identify parishes with the most persistent cumulative burden across all scenarios, we computed a rank-sum score for each parish by summing its rank position under all five weighted scenarios (excluding IPS, which is derived from them). A lower rank-sum indicates a parish that consistently appears near the top regardless of which policy posture is applied. Table 2 presents the 10 parishes with the lowest rank-sum scores. Evangeline Parish has the lowest cumulative rank-sum, appearing in the top five under four of the five scenarios, making it the most persistently high-burden parish in the dataset regardless of the weighting chosen. Allen and Washington parishes follow closely. This rank-sum lens complements the scenario-by-scenario view in Table 1 by surfacing parishes where investment need is robust across normative framings, not just dominant under one.
Rank-sum analysis: Parishes with the most persistent cumulative burden across all five weighted scenarios

Table 2. Long description
The table consists of seven columns: Parish, S E B, N R, F R R, S W E, A R G, and Rank-sum.
* Evangeline: S E B 1, N R 5, F R R 5, S W E 4, A R G 1, Rank-sum 16.
* Washington: S E B 2, N R 7, F R R 4, S W E 1, A R G 6, Rank-sum 20.
* Allen: S E B 4, N R 1, F R R 10, S W E is not ranked, A R G 2, Rank-sum 82.
* Orleans: S E B is not ranked, N R 6, F R R 1, S W E 2, A R G 10, Rank-sum 84.
* Tangipahoa: S E B 10, N R 4, F R R 7, S W E is not ranked, A R G 5, Rank-sum 91.
* Rapides: S E B 5, N R 9, F R R 9, S W E is not ranked, A R G 7, Rank-sum 95.
Note: Parishes not ranked in a scenario are indicated by a dash and were assigned a penalty rank of 65 for the rank-sum calculation.
Notes: Rank position under each scenario is shown; “–” indicates the parish did not appear in the top 10 for that scenario. A lower rank-sum reflects more consistent high-priority status regardless of policy orientation.
* Parishes not ranked in a scenario are assigned a conservative penalty rank of 65.
We call this the “prioritization paradox.” The implicit choice of whose needs come first is buried in technical assumptions rather than presented as the policy decision it is. Different policy goals produce substantially different spatial priorities, and any single-dimensional framework makes a value judgment about which communities are served first. That judgment should be made openly. One additional dimension is conspicuously absent from all six scenarios: a measure of what affected communities can actually afford to pay for these improvements, a demand-side signal that could function either as an affordability weight within the composite score or as a feasibility constraint on which investment priorities are actionable.
The missing dimension: Willingness to pay
Grid resilience improvements carry real costs, and those costs are not distributed equally. Entergy Louisiana’s $1.9 billion plan imposes a per-customer rate rider rising to $7.19 per month by 2029 (Entergy Louisiana, 2024), with uniform charges that fall disproportionately on already energy-burdened households (Sierra Club, 2025).
The result is what we call the affordability–resilience dilemma, where the communities most in need are the least able to pay for improvements.
Existing tools such as the LBNL Interruption Cost Estimate (ICE) Calculator (Lawrence Berkeley National Laboratory, 2024) offer a useful starting point, allowing utilities and planners to estimate outage costs by customer class, duration, season and time of day. However, the ICE Calculator operates at the state level and disaggregates costs by customer type (residential, commercial and industrial) rather than by income band or social vulnerability index, limiting its applicability for the parish-level equity analysis pursued here. Survey evidence shows that consumers are willing to pay for grid hardening. Bowman et al. (Reference Bowman, Lambert, Ripberger, Jenkins-Smith, Silva, Long, Gupta and Fox2024) found ~$14.69 per month in Oklahoma, while Asadi et al. (Reference Asadi, Price, Kessels and Mozumder2024) estimated $43–$50 per month for hurricane-exposed Florida residents, with low-income households supporting significantly lower amounts. Willingness to pay (WTP) is further shaped by risk perception and demographic characteristics (Long et al., Reference Long, León-Corwin, Peach, Olofsson, Ripberger, Gupta, Silva and Jenkins-Smith2023; Electric Power Research Institute, 2024).
Several gaps limit how well these findings apply to Louisiana. No state-specific WTP data exist. Prior studies rarely disaggregate WTP by income, leaving open whether energy-burdened households can afford any additional cost. And WTP has not been incorporated into spatial resilience planning, leaving these scenarios without a demand-side perspective.
Stated-preference surveys represent just one approach to capturing demand-side signals. Revealed-preference methods provide behaviorally grounded proxies for what communities implicitly value and can afford. These methods encompass household generator purchases, solar-plus-storage adoption rates and coping expenditures such as food spoilage, hotel costs and backup fuel following actual outages (Baik et al., Reference Baik, Davis, Park, Sirinterlikci and Morgan2020; Brown and Muehlenbachs, Reference Brown and Muehlenbachs2024). Demand-response participation rates and time-of-use pricing acceptance can similarly serve as indirect indicators of reliability valuation. However, all of these approaches rely on micro-level household or billing data that is not currently collected at the parish level in Louisiana, a constraint that reinforces the call for better data infrastructure rather than resolving the underlying gap. Addressing this gap requires income-disaggregated WTP research integrated into the same spatial planning framework.
Conclusions and future perspectives
Energy insecurity is not a single number, and neither is resilience. Using Louisiana as a case study, this article has shown that investment priorities shift substantially depending on which dimension is weighted, and single-metric approaches obscure that multidimensionality by implicitly deciding which communities receive investment first. As states facing compound hazard exposure from hurricanes, winter storms, wildfires and flooding direct billions of dollars toward grid hardening, the question of “where to invest” first cannot be resolved without first determining the criteria by which these investments are evaluated. The four-dimensional framework demonstrated here is not restricted to hurricane contexts; it applies wherever extreme weather intersects with fragmented utility structures and energy-burdened communities (Clark et al., Reference Clark, Peterson, Shelly and Jeffers2023; Peterson et al., Reference Peterson, Clark, Shelly and Horn2024). This is a normative decision about distributional outcomes, and it demands transparent deliberation. We offer four core recommendations.
First, utilities and regulators should adopt multi-scenario resilience planning as standard practice. Investment portfolios should be evaluated under multiple weighting schemes, with the resulting priority maps presented side by side.
Second, place-based willingness-to-pay research is urgently needed in Louisiana, disaggregated by income, geography and utility type. Without such data, resilience investment plans remain supply-side exercises that risk deepening the energy insecurity they aim to address.
Third, spatial resilience tools should be designed for community deliberation, not only for technical planning. Existing geospatial tools such as the EPA’s EJScreen and the Climate and Economic Justice Screening Tool are publicly accessible, but they are explicitly designed as pre-decisional screening instruments for federal agencies and utility planners. Indeed, the EPA’s own technical documentation describes EJScreen as a screening tool that is not designed to be the basis for agency decision-making, rendering it poorly suited as a platform for community deliberation (U.S. Environmental Protection Agency, 2024). Participatory GIS approaches have been applied in renewable energy siting decisions (Popovich et al., Reference Popovich, Figueroa, Sunter and Shah2024), and tools such as California’s CalEnviroScreen have supported community advocacy in regulatory proceedings. However, their application to deliberating over the normative weighting of resilience investment trade-offs has not been institutionalized in grid resilience planning practice (Pierre et al., Reference Pierre, Broderick, DeMenno, Paladino and Yoshimura2022; Hart et al., Reference Hart, AmandaWachtel, McCombs, Brockway and Chwierut2024). This gap is particularly evident in contexts where affected communities engage directly with how different policy orientations alter which specific areas receive investment priority. When affected communities can see how rankings shift under different policy orientations, the conversation about trade-offs becomes more grounded and informed.
Fourth, the energy transition offers partial solutions. Distributed solar-plus-storage, community microgrids and targeted weatherization can deliver resilience to high-burden parishes without requiring regressive rate increases, and these investments can be directed to areas where the paradox is most acute.
Recent quantitative frameworks for optimizing equity in energy policy interventions (Heleno et al., Reference Heleno, Sigrin, Popovich, Heeter, Figueroa, Reiner and Reames2022) offer a productive path toward formally resolving this paradox. By embedding social burden, energy affordability and reliability constraints simultaneously into a multi-criteria objective function, future work can move from diagnosing which communities are overlooked to algorithmically determining where investment is both needed and equitable.
The question is not simply “where should we invest?” but “by whose criteria, at whose cost, and for whose benefit?” Until energy insecurity occupies the center of resilience planning rather than its periphery, the promise of an inclusive energy transition will remain out of reach.
Data availability statement
Publically available datasets have been used in this manuscript.
Open peer review
To view the open peer review materials for this article, please visit https://doi.org/10.1017/etr.2026.10020.
Acknowledgments
This work was partially supported by Louisiana Board of Regents. This work was partially supported by Louisiana Board of Regents. .
Author contributions
Conceptualization: F.F. Data curation: M.Z.K. Formal analysis: M.Z.K., T.S., A.M. and B.F.S. Methodology: M.Z.K. and F.F. Resources: F.F. Software: T.S. Supervision: F.F. Writing – original draft: M.Z.K. Writing – review and editing: M.Z.K., F.F., T.S., A.M. and B.F.S. All authors approved the final submitted draft.
Funding statement
This research was supported by Louisiana Board of Regents, ITRS program.
Declaration of interests
The authors declare no conflicts of interest.
Ethics and approvals
The research meets all ethical guidelines, including adherence to the legal requirements of the study country.
AI statement
The authors used AI-assisted tools (specifically, LLM-based writing assistants) to support manuscript editing and language refinement. All scientific content, data analysis, interpretation of results and conclusions are solely the work of the authors. The authors take full responsibility for the integrity and accuracy of the submitted work.



 Open access


Comments
No accompanying comment.