



1. Introduction
Previous investigations on control of the separated wake from a bluff cylinder have indicated that a splitter plate attached to the rear of the bluff cylinder downstream is one of the most effective devices to control vortex shedding and the wake characteristics (Williamson Reference Williamson1996; Choi, Jeon & Kim Reference Choi, Jeon and Kim2008). Roshko (Reference Roshko1954) was the pioneer to employ the rigid splitter plate (RSP) to control vortex shedding from a circular cylinder. The experiment conducted at Re = 1.45 × 10⁴ (Re is the Reynolds number) showed for the first time that, when a RSP with L/D = 5.0 (L is the plate length and D the cylinder diameter) was attached to the cylinder rear, vortex shedding was suppressed effectively, and the drag coefficient (CD) diminished from CD = 1.15 for the plain cylinder to CD = 0.72. Gerrard (Reference Gerrard1966) investigated the effect of a RSP on the frequency of the vortex shedding from a circular cylinder at Re = 2 × 10⁴ experimentally. It was reported that the Strouhal number (St) decreased from 0.2 to 0.18 when a RSP with L/D = 1.0 was added to the cylinder rear, whereas St gradually increased for 1.0 < L/D < 2.0. Further systematic experimental studies about the effects of a RSP on the cylinder wake were performed by Apelt, West & Szewczyk (Reference Apelt, West and Szewczyk1973) and Apelt & West (Reference Apelt and West1975). It was shown that CD decreased substantially with L/D ≤ 1.0 and approached the minimal value at L/D = 1.0, where CD was 69 % of the value of the plain cylinder. The value of St, however, did not vary monotonically with L/D for L/D ≤ 1.0, which increased by approximately 10 % at L/D = 0.25 and then decreased by approximately 10 % at L/D = 1.0 compared with the plain cylinder. For 1.0 < L/D ≤ 2.0, both St and CD increased with L/D. Regular vortex shedding almost entirely disappeared for L/D > 5.0 as the flow reattached to the plate surfaces, where a constant drag of CD ≈ 0.8 was attained. Anderson & Szewczyk (Reference Anderson and Szewczyk1997) extended the previous investigations and accomplished flow visualization for the wake of a circular cylinder with a RSP over Re = 2.7 × 10³ ~ 4.6 × 10⁴. The non-monotonic variation of St with L/D was revealed, which was ascribed to the changes in the shear layer characteristics with L/D. According to the shear layer characteristics, the L/D–St curve was divided into four regions. They were the shear layer stabilization region with an increase of St for L/D < 0.25, the shear layer elongation region with a decrease of St for 0.25 < L/D < 0.75, the reduced entrainment region with an increase of St again for 0.75 < L/D < 1.5 and the splitter plate--vortex interaction region with a decrease of St again for L/D > 1.5.
Recently, the focus of researchers on the bluff body with a splitter plate gradually turned to the interaction between a flexible splitter plate (FSP) and the wake flow. The enlightening research on this phenomenon was initiated by Allen & Smits (Reference Allen and Smits2001). They placed a flexible piezoelectric film into the wake of a bluff body and utilized the wake vortices to force the film to deform violently, based on which a novel energy harvesting system was established. The length of the flexible films used in Allen & Smits (Reference Allen and Smits2001) was set to be larger than 10 times the width of the bluff body. It was observed that a lock-in interaction between the film and the flow field occurred for Re = 104 ~ 2 × 10⁴, where the amplitude of the film augmented significantly, and the film vibration frequency was very close to the vortex shedding frequency. Shukla, Govardhan & Arakeri (Reference Shukla, Govardhan and Arakeri2013) studied the deformation of a FSP with L/D = 5.0 in the circular cylinder wake through a wind tunnel experiment over Re = 1.8 × 10³ ~ 104. Two lock-in periodic vibration stages of FSP occurred for Re = 2500 and Re > 6000, respectively, whereas FSP vibrated aperiodically for other Re. Similar investigations include the experiments of Taylor et al. (Reference Taylor, Burns, Kammann, Powers and Welsh2001), Pobering & Schwesinger (Reference Pobering and Schwesinger2004), Robbins et al. (Reference Robbins, Morris, Marusic and Novak2006) and Kalmbach & Breuer (Reference Kalmbach and Breuer2013), and the numerical simulations of Dettmer & Perić (Reference Dettmer and Perić2006), Gomes et al. (Reference Gomes, Yigit, Lienhart and Schäfer2011), Kundu et al. (Reference Kundu, Soti, Bhardwaj and Thompson2017) and Sahu, Furquan & Mittal (Reference Sahu, Furquan and Mittal2019). These studies paid most attention to the deformation (vibration) characteristics of FSP in the cylinder wake, but barely involved the influences of FSP on the flow over the circular cylinder.
In the experiment of Hu, Pan & Wang (Reference Hu, Pan and Wang2014), a circular cylinder with a FSP was forced to oscillate by the external sinusoidal excitation in the free stream, and the influence of the excitation frequency and L/D on the wake vortex structure was investigated. With the change of the excitation frequency and L/D, four different vortex shedding modes were observed in the wake, namely the 2S Kármán vortex, 2S reserved Kármán vortex, 2P mode and P + S mode. After the analysis of the vortex evolution, it was confirmed that the vortex shedding modes depended on the strength of the competition between the primary vortices and the trailing-edge vortices. The wind tunnel experiment of Teksin & Yayla (Reference Teksin and Yayla2017) showed that FSP with L/D = 3.0 yielded the optimal control effect on wake fluctuation of a circular cylinder at Re = 5000, where the maximum Reynolds stress, the velocity fluctuations as well as the turbulent kinetic energy reduced considerably, by approximately 50 %, 30 % and 67 %, respectively. Shen et al. (Reference Shen, Lin, Wei, Dou and Tu2019) executed smoke line visualization and wake pressure fluctuation measurement for the flow over a circular cylinder with a FSP. It is found that the increase of L/D was accompanied by the wake width narrowing, the location of vortex shedding moving downstream and the pressure fluctuation in the wake dwindling. The vortex shedding became inconspicuous at L/D = 5.0, where the peak value of the pressure fluctuations at the section of x/D = 10 reduced by approximately 23.5 % at Re = 1500. The wake in their research, however, was asymmetric because the model was horizontally installed in the wind tunnel; thus, the movement of FSP was influenced by gravity. As yet, numerical simulations on the control of the circular cylinder wake with a FSP have been mainly concentrated on the laminar vortex shedding stage (Re = 49 ~ 190, Williamson Reference Williamson1996). All of the numerical studies of Favier Favier et al. (Reference Favier, Dauptain, Basso and Bottaro2009), Lee & You (Reference Lee and You2013), Wu, Shu & Zhao (Reference Wu, Shu and Zhao2014) and Abdi, Rezazadeh & Abdi (Reference Abdi, Rezazadeh and Abdi2019) indicated that there were noticeable differences between the control effects of FSP and RSP on the flow over a circular cylinder.
As for the influence of the splitter plate on the flow-induced noise of a bluff body, most of the existing research is in the form of numerical simulations with the model of a cylinder attached a RSP for low Reynolds numbers, such as You et al. (Reference You, Choi, Choi and Kang1998), Ali, Doolan & Wheatley (Reference Ali, Doolan and Wheatley2011, Reference Ali, Doolan and Wheatley2013), and similar conclusions have been drawn. RSP successfully suppressed the Aeolian tone despite the still existing dipole noise source. A RSP with L/D = 1.0 generated the maximum noise reduction; for example, a 3 dB reduction in the square cylinder noise was obtained for a RSP with L/S = 1.0 (S is the side length of the square cylinder) attached at Re = 150 (Ali et al. Reference Ali, Doolan and Wheatley2011).
Octavianty & Asai (Reference Octavianty and Asai2016) performed experiments to control the square cylinder noise with a RSP over Re = 1.0 × 10⁴ ~ 3.3 × 10⁴. The far-field noise and the velocity field were measured by microphones and particle image velocimetry (PIV), respectively. They reported that there was no noticeable change in the Aeolian tone for L/D ≤ 0.2. The Aeolian tone appeared to decrease gradually from L/D = 0.3, and a 3 dB reduction was accomplished at L/D = 0.5. The PIV results demonstrated that, with the increase of L/D, the magnitudes of the maximum velocity fluctuations decreased while their streamwise locations moved downstream; in turn, the Aeolian tone was weakened. The influence of a FSP on the bluff body noise has not been investigated yet. A similar study was the experiment of Kamps et al. (Reference Kamps, Geyer, Sarradj and Brücker2017), where a kind of hairy flap, which was comprised of eight flexible plates with L/D = 0.3, was attached to the rear of a circular cylinder for noise reduction in the Re range 1.46 × 10⁴ ~ 3.4 × 10⁴. The noise spectra exhibited that, compared with the plain cylinder, the peak value of the Aeolian tone was reduced by approximately 20 dB with the hairy flap control. Additionally, an approximately 10 dB increment occurred in the high-frequency region of the spectrum ( f > 1000) in the controlled case, but the related mechanism was not reported.
A RSP has been extensively used in the vortex shedding suppression and the drag reduction for the bluff body. The underlying mechanisms have been thoroughly studied with methods of pressure and force measurement (Roshko Reference Roshko1954; Apelt et al. Reference Apelt, West and Szewczyk1973; Apelt & West Reference Apelt and West1975), flow visualization (Unal & Rockwell Reference Unal and Rockwell1988; Anderson & Szewczyk Reference Anderson and Szewczyk1997), hot-wire anemometry (Bearman Reference Bearman1965; Gerrard Reference Gerrard1966; Ozono Reference Ozono1999), PIV (Akilli et al. Reference Akilli, Karakus, Akar, Sahin and Tumen2008; Yucel, Cetiner & Unal Reference Yucel, Cetiner and Unal2010; Chauhan et al. Reference Chauhan, Dutta, More and Gandhi2018) and numerical simulations with different algorithms (Kwon & Choi Reference Kwon and Choi1996; Hwang, Yang & Sun Reference Hwang, Yang and Sun2003; Serson et al. Reference Serson, Meneghini, Carmo, Volpe and Gioria2014; Sahu et al. Reference Sahu, Furquan and Mittal2019; Wang et al. Reference Wang, Bao, Zhou, Zhu, Ping, Han, Serson and Xu2019). However, the control of the bluff body noise with a RSP is mostly investigated with numerical simulations for low Reynolds numbers, there being a lack of results from experiments (Octavianty & Asai Reference Octavianty and Asai2016). In terms of the flow control for the bluff body with FSP, systematic experimental studies are scarce. Furthermore, to the best of the authors’ knowledge, there has been no study on the control of the flow-induced noise from a bluff body with a FSP. The similarities and differences of the control effects between the RSP and the FSP on the flow field and the flow-induced noise are as yet uninvestigated, as are the related mechanisms. Hence, the experimental investigation of this issue, which involves the fluid--structure--sound interaction and control (FSSIC), is an urgent necessity at present. This research attempts to investigate the influences of the FSP on the flow-induced noise of a circular cylinder experimentally and pursues a more efficient control of the cylinder noise. Both RSP and FSP are employed to control the flow and noise. Stress is placed on the effects of the flexibility, the length (L/D = 0.5 ~ 6.0) and the Reynolds number (Re = 3.83 × 10⁴ ~ 11.5 × 10⁴). For the study of FSSIC, detailed measurements of the noise, the flow field and the deformation field of FSP are conducted. The underlying physical mechanisms of FSSIC will be discussed meticulously with a comprehensive analysis of the noise, the flow field and the FSP deformation. It is hoped that this study could help to illuminate the related FSSIC mechanism somewhat and shed some light on flow control studies.
This paper is organized as follows. In § 2, the measurement methodologies for the noise, velocity fields and the dynamic deformation of FSP are introduced. In § 3, the experimental results and specific analyses are presented. At first, the control effects of the FSP and the RSP on the cylinder noise are discussed and the present results are compared with previous ones. Secondly, the control mechanisms of the two splitter plates on the Aeolian tone are revealed based on the flow fields and the theoretical equation (3.4). Then, the deformation and vibration of the FSP in the cylinder wake are studied to further explore the control mechanisms of the FSP on the cylinder noise. Finally, a comprehensive discussion of FSSIC in this investigation is provided. In § 4, the most essential discoveries of this work are summarized and conclusions are drawn.
2. Experimental set-up and measurement methodology
2.1. Noise measurement
The noise experiment was conducted in the closed-circuit aero-acoustic wind tunnel D5 with an open test section of 1000 mm × 1000 mm × 2000 mm (height × width × length) at Beijing University of Aeronautics and Astronautics, as shown in figures 1(a) and 2. The whole test section of this wind tunnel is surrounded by an anechoic chamber of 6 m × 6 m × 7 m (height × width × length) to satisfy the non-reflecting condition (figure 2). The maximum free-stream velocity can be up to 80 m s−1 with the turbulence intensity in the core of the jet less than 0.08 %. For more details about this wind tunnel, one can refer to the works of Liu et al. (Reference Liu, Xing, Guo and Li2017). The definition for the coordinate system is shown in figure 1(a) and the cross-section of the experimental model is shown in figure 1(b). The origin was set at the centre of the mid-span cross-section of the cylinder (figure 1b), and x, y and z corresponded to the streamwise, vertical and spanwise orientations, respectively. The experimental model was a circular cylinder with an aft splitter plate. The cylinder with a diameter of D = 30 mm and a spanwise length of LS = 1000 mm yielded an aspect ratio of LS/D ≈ 33, which satisfied the criterion of the ‘quasi-infinite’ circular cylinder, where the flow over the mid-span area of the cylinder is not interfered with by the end effect and can be regarded as a two-dimensional flow (Stansby Reference Stansby1974; Fox & West Reference Fox and West1990; Stäger & Eckelmann Reference Stäger and Eckelmann1991; Fox Reference Fox1992; Szepessy & Bearman Reference Szepessy and Bearman1992; Norberg Reference Norberg1994). The circular cylinder was comprised of two semi-cylinders with D = 30 mm, and the splitter plate was clamped by the two semi-cylinders, as sketched in figure 1(b). The spanwise length of the splitter plate was 1000 mm, and the streamwise lengths L/D were set at 0.5, 1.0, 2.0, 3.0, 4.0, 5.0 and 6.0. The RSP utilized in this experiment was made from # 45 steel (National Standard in China) with a thickness of 1 mm. The FSP was made from polyvinyl chloride (PVC) containing reinforced fibres, which formed a cloth-like material with a thickness of 0.45 mm (nominal thickness 0.5 mm). Note that the maximum thickness of 1 mm for the splitter plate was much less than the diameter of 30 mm for the cylinder, implying that the plate-thickness-induced error was negligible. The elastic parameters of the two plates are listed in table 1, in which the elastic parameters for the RSP were acquired from a standard database of material properties, and the elastic parameters for the FSP were measured by Beijing Center for Physical and Chemical Analysis, a third-party analysis organization. The dimensionless bending stiffness  $\varPi$ in table 1 is defined as follows (Connell & Yue Reference Connell and Yue2007, Kang et al. Reference Kang, Aono, Cesnik and Shyy2011; Kim et al. Reference Kim, Cossé, Cerdeira and Gharib2013):
 \begin{equation}\varPi = \displaystyle{{Eh^3} \over {\rho (12-\mu ^2)U_\infty ^2 L^3}}.\end{equation}
Parameter  $\varPi$ characterizes the relative magnitude of the bending force to the fluid inertial force when an elastic film vibrates in the fluid. The values of
 $\varPi$ given in table 1 are based on the free-stream velocity of U∞ = 30 m s−1 and L/D = 1.0. The parameters E, μ, h and ρ in (2.1) are Young's modulus, Poisson's ratio, the plate thickness and the free-stream density, respectively. The dimensionless bending rigidity,
 $\varPi$ = 1.1 × 10⁻³, for the flexible plate is very low. A salient feature of this kind of plate is its very low natural frequency. The natural frequencies of the first three modes for the flexible plate with L/D = 1.0 are approximately 4.6 Hz, 28.7 Hz and 80.5 Hz in the present study, respectively (estimated using Euler–Bernoulli beam theory; Furquan & Mittal Reference Furquan and Mittal2015; Kundu et al. Reference Kundu, Soti, Bhardwaj and Thompson2017), which are 1 ~ 2 orders of magnitude smaller than the dominant frequency of the vortex shedding (figure 7). From table 1, it is clear that E and
 $\varPi$ of the # 45 steel plate are far greater than those of the PVC plate, so the # 45 steel plate is regarded as rigid.
(a) Schematic of experimental set-up for the noise measurement, (b) cross-section of the experimental model.

Photograph of experimental set-up for the noise measurement.

Elastic parameters of the two splitter plates (U∞ = 30 m s−1, L/D = 1.0).

To concisely describe the combination of a cylinder with a splitter plate of different lengths, we designate the FSP and the RSP with L/D = 1.0 as FSP1.0 and RSP1.0, respectively. Similarly, the FSP with L/D = 2.0 is denoted as FSP2.0 and so forth. In this way, the case of the circular cylinder with the FSP of L/D = 1.0 is simplified as the cylinder with FSP1.0. Furthermore, the superscripts of c, r and f are employed to distinguish variables for the plain cylinder and cylinders individually with RSP and FSP, respectively; for example,  $L_r^c $,
 $L_r^r $ and
 $L_r^f $ represent the length of recirculation region Lr for the plain cylinder and cylinders individually with RSP and FSP, respectively, and so forth for other variables.
The experimental model was vertically fixed at 500 mm downstream of the wind tunnel nozzle through two endplates, as shown in figure 1(a). The temperature of the test section was maintained at 25 ± 1 °C, and the free-stream velocities were U∞ = 20 m s−1, 30 m s−1, 40 m s−1 and 50 m s−1; thus, the Reynolds numbers based on the cylinder diameter (Re = U∞ ⋅ D/ν, ν is the kinematic viscous coefficient) were Re = 3.83 × 10⁴, 5.74 × 10⁴, 7.65 × 10⁴ and 9.57 × 10⁴, respectively, which were included in the subcritical Reynolds number range, Resub ≈ 2 × 10² ~ 2 × 10⁵ (Williamson Reference Williamson1996).
The far-field noise was measured in the anechoic chamber using three 1/2 inch free-field microphones with a sensitivity of 50 mV Pa−1, whose frequency response ranges from 6.3 to 20 kHz, and dynamic response ranges from 14.6 to 146 dB. The main microphone was positioned at (0, 2000 mm, 0) in the coordinate system (figures 1a and 2). Two auxiliary microphones, whose locations are shown in figures 1(a) and 2, were used to reaffirm the measurement results of the main microphone. It should be noted that all the data analysed in §§ 3 and 4 are acquired by the main microphone. Before measurement, the microphones were calibrated with a standard sound source. The noise data were acquired by the software PULSE Labshop from Brüel & Kjær company with a sampling frequency of 65 536 Hz and record time of 50 s. Each experimental case was measured twice to ensure repeatability and reliability of the results. The original data were then divided into more than 1000 blocks with an overlap ratio of 66.7 %. Each block containing 8192 data points was transferred into the frequency domain by fast Fourier transformation (FFT) after being treated by the Hanning window. The noise spectrum given in this paper is an average of the spectra from all the blocks, and the final frequency resolution of the spectrum is 8 Hz, as shown in figures 6–8.
2.2. Velocity field measurement
From the analysis of the noise data in § 3.1, it is found that the optimal reduction in the Aeolian tone was achieved at L/D = 1.0 for the two plates. Hence, the three cases of the plain cylinder (L/D = 0), the cylinders individually with RSP1.0 and FSP1.0 were particularly selected in the flow-field measurement. It is expected that some new ideas about the cylinder noise reduction with the splitter plate could be inspired.
The flow-field measurement was conducted in the closed-circuit low-speed wind tunnel D1 with an open test section of 1450 mm in length at Beijing University of Aeronautics and Astronautics. The cross-section of the wind tunnel nozzle is an ellipse with a major axis of 1020 mm and a minor axis of 760 mm, as depicted in figure 3. The maximum velocity of this wind tunnel is 50 m s−1, and the turbulence intensity in the core of the jet is less than 0.3 %. The experimental apparatus included three main parts (figure 3): the experimental model, the endplates and the PIV system. The cross-section of the experimental model and the definition of the coordinate system in the flow-field measurement (figure 3) were the same as those for the noise measurement (figures 1 and 2). Limited by the size of the wind tunnel D1, the spanwise length of the model in the flow-field measurement was 500 mm, yielding an aspect ratio of approximately17. The two endplates parallel to the free stream were installed horizontally in the test section to assure the flow over the mid-span area of the model would not be affected by the end effect (figure 3). The endplates with a size of 1200 mm × 450 mm × 5 mm (length × width × thickness) were made from transparent Plexiglas plates. Besides, their leading edges were machined as a semi-ellipse of 4 : 1 to avoid flow separation (Feng & Wang Reference Feng and Wang2010). The model was fixed vertically at the centre of the test section by the two endplates, as presented in figure 3. It should be pointed out that, although the aspect ratios between the cylinder models in the noise measurement and the flow-field measurement were different, the ‘quasi-infinite’ cylinder condition was satisfied for both cases according to a series of previous studies (Stansby Reference Stansby1974, Fox & West Reference Fox and West1990, Stäger & Eckelmann Reference Stäger and Eckelmann1991, Fox Reference Fox1992, Szepessy & Bearman Reference Szepessy and Bearman1992; Norberg Reference Norberg1994). All the results in these literature point to a fact that it is convincing that, in the subcritical Reynolds number range, as the aspect ratio of a circular cylinder exceeds a critical value of LS/D ≈ 7 and the endplates are appropriately installed, the flow in the mid-span plane is independent of the end effect and deemed as two-dimensional flow. Consequently, it is acceptable that the flow field in the mid-span in the noise measurement is almost exactly equivalent to the flow field measured in the present measurement (figure 3a).
(a) Schematic and (b) photograph of experimental set-up for the flow-field measurement.

A two-dimensional PIV system was set up for the quantitative measurement of the flow field (figure 3). The measurement plane was illuminated by a Nd: YAG (neodymium-doped yttrium aluminium garnet) double-pulsed laser of 500 mJ, which emits green light of 532 nm wavelength. The laser sheet was perpendicular to the cylinder axis and through the mid-span plane. The tracer particles, which were generated by a heated smoke generator, were uniformly dispersed into the flow field from the diffuser channel behind the collector of the wind tunnel. It was tested that, as the heated particles were employed to conduct the PIV measurement at U∞ > 30 m s−1, the signal-to-noise ratio of particle images captured by the charge-coupled device (CCD) camera was poor, and could not be applied to calculate velocity fields. Thus, the free-stream velocity U∞ in the flow-field measurement was settled at U∞ = 20 m s−1 (Re ≈ 3.83 × 10⁴) to acquire high-quality data. The particle images of the wake were recorded simultaneously with two identical CCD cameras (Imperx B2520 with a maximum resolution of 2456 × 2058 pixels) aligned in the streamwise direction under the control of a synchronizer to gain a large field of view (FOV) with a high spatial resolution, as shown in figure 3. Two Nikon 24 mm F2.8 manual lenses were used for imaging, and the combined FOV for the plain cylinder case was approximately 0.5 ≤ x/D ≤ 12 and −4 ≤ y/D ≤ 4 while those for the two controlled cases were 1.5 ≤ x/D ≤ 13 and −4 ≤ y/D ≤ 4 (figure 3a), with a magnification of approximately 0.1 mm pixel−1 for the three cases. The sampling frequency for the image pairs was 5 Hz with a straddling time of 48 μs, and the maximum displacement of the particles between two frames of an image pair was less than 10 pixels in the streamwise direction. Finally, more than 1800 pairs of particle images were recorded for each case by each camera. The particle image pairs were analysed by the multi-pass iterative Lucas--Kanade algorithm, which can output accurate velocity fields with a high computational efficiency by using graphics processing units (Champagnat et al. Reference Champagnat, Plyer, Le Besnerais, Leclaire, Davoust and Le Sant2011; He et al. Reference He, Wang, Pan, Feng, Gao and Rinoshika2017, Qu et al. Reference Qu, Wang, Sun, Feng, Pan, Gao and He2017, Reference Qu, Wang, Feng and He2019). The size of the interrogation window was set as 32 × 32 pixels with an overlap ratio of 75 %. In the present study, at least 1600 velocity fields were used for the statistics to ensure convergence.
2.3. Deformation measurement
When a FSP is attached to the cylinder rear to control the flow and the flow-induced noise, it will vibrate and deform due to the interaction between the FSP and the wake flow, which is a typical FSSIC phenomenon. Therefore, not only should attention be paid to the noise and the flow field, but also the movement of the FSP.
In the present experiment, the dynamic deformation of FSP1.0 was measured by a single-camera three-dimensional digital image correlation system (3D-DIC system) at U∞ = 30 m s−1, as shown in figures 4(a) and 5. The 3D-DIC technique based on the binocular stereovision principle is powerful to measure the full-field three-dimensional shape, motion and deformation without direct contact with the model, and the measurement accuracy can reach sub-pixel level through a fitting algorithm (Luo et al. Reference Luo, Chao, Sutton and Peters1993; Pan et al. Reference Pan, Xie, Xu and Dai2006, Reference Pan, Xie, Yang and Wang2009; Genovese et al. Reference Genovese, Casaletto, Rayas, Flores and Martinez2013; Gao et al. Reference Gao, Cheng, Su, Xu, Zhang and Zhang2015; Yu & Pan Reference Yu and Pan2017c). The single-camera 3D-DIC system in the present experiment relies on the help of an additional optical device, namely the four-mirror adaptor (figures 4a and 4b), which splits the incident light from the specimen into two paths with different incident angles, and then the two path lights simultaneously project onto the CMOS (complementary metal-oxide-semiconductor) without overlapping each other. Figure 4(b) displays the whole optical path of the imaging process. The high-speed camera used in this experiment was a Phantom V2512 (figure 5) with a maximum resolution of 1280 × 800 pixels and a maximum full-frame acquisition rate of 25 600 s−1. The real image captured by the CMOS was a combination of two sub-images (each with a resolution of 640 × 800 pixels), which were equivalent to the image pair captured by two virtual cameras synchronized from different angles (figure 3b). The two sub-images were used for the stereo digital image correlation.
(a) Schematic of experimental set-up for the deformation measurement; (b) optical arrangement of the four-mirror adapter based single-camera 3D-DIC system; (c) effective measurement region on the surface of FSP1.0; (d) 3D-DIC system calibration (one picture in calibration).

Photograph of experimental set-up for the deformation measurement.

In this experiment, the four-mirror adaptor based single-camera 3D-DIC system (Yu & Pan Reference Yu and Pan2016, Reference Yu and Pan2017c) was implemented to measure the dynamic deformation in the fluid--structure interaction for the first time. Before the measurement, random speckle patterns were sprayed onto the surface of the FSP using black matt paints (figure 4d). The speckled flexible plate was then illuminated by a monochromatic blue LED light (wavelength 450–455 nm), and the 3D-DIC system was located at the lateral side of the model along the y-axis, as in the arrangement presented in figures 4(a) and 5. The four-mirror adaptor was precisely placed in front of the camera lens (Tamron 180 mm F3.5 manual lens) for the light path splitting (figures 4a and 4b). The 3D-DIC system and the coordinate space were calibrated by the Zhang calibration method (Zhang Reference Zhang2000), and then the transient deformations of the FSP in the flow field were captured with a sampling frequency of 3000 Hz at U∞ = 30 m s−1. This sampling frequency was approximately 15 times of the dominant frequency of the flow field (approximately 200 Hz at U∞ = 30 m s−1) to guarantee that the deformation fields computed later were time resolved (Pan, Wang & Wang Reference Pan, Wang and Wang2013). The sampling time was 10 s, and the effective FOV on the surface of FSP1.0 was approximately 8D × D (figure 4c). The acquisition was repeated 3 times to ensure repeatability and reliability of the results. Before computing, the original images were divided into sub-image pairs with a resolution of 640 × 800 pixels. The sub-image pairs were then analysed through the stereo digital image correlation algorithm with a subset size of 31 × 31 pixels to obtain the three-dimensional dynamic deformation fields of the FSP. For more details about this four-mirror adaptor based single 3D-DIC system, such as the accuracy, calibration and specific algorithms, one can refer to the works of Yu & Pan (Reference Yu and Pan2016, Reference Yu and Pan2017a,Reference Yu and Panb,Reference Yu and Panc).
3. Experimental results and analyses
3.1. Noise characteristics
3.1.1. Spectrum characteristics
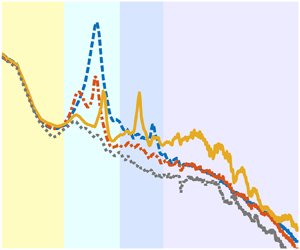
The power spectrum density for the noise of the plain cylinder and the corresponding background noise are presented in figure 6(a). Compared with the background, a sharp peak accompanied by one (at low Re) or two (at high Re) harmonic peaks abruptly appears in the spectrum as the cylinder is placed in the flow field, causing the sound pressure level (SPL) in space to soar dramatically. The dominant peak originating from vortex shedding is the Aeolian tone, i.e. the tonal noise, whose non-dimensional dominant frequency St 0 (figure 6b) is the frequency of vortex shedding. The harmonic peaks are the second- and third-order harmonics of the Aeolian tone, whose frequencies are integer multiples of St 0; for instance, when St 0 = 0.18 at Re = 9.57 × 10⁴, the second and third harmonic frequencies are 0.35 (~2St 0) and 0.53 (~3St 0), respectively (the green spectrum in figure 6a). The spectrum characteristics of the plain cylinder in the present study agree well with the experimental results of Hutcheson & Brooks (Reference Hutcheson and Brooks2012), Geyer & Sarradj (Reference Geyer and Sarradj2016) and Kamps et al. (Reference Kamps, Geyer, Sarradj and Brücker2017). In figure 6(a), with an increase of Re, the SPL of the cylinder noise rises globally, whereas the non-dimensional frequency St 0 of the Aeolian tone barely varies. All Re in the present experiment are included in the subcritical Reynolds number region, where St 0 of the vortex shedding ranges from 0.180 to 0.191 according to the review by Norberg (Reference Norberg2003). As compared in table 2, St 0 of the present experiment and those of previous investigations are in excellent agreement since the relative errors do not exceed 3 %, indicating that the measurement of St 0 in the present experiment is reliable.
(a) Power spectrum density for the noise of the plain cylinder. Solid line: cylinder noise, dashed line: background noise; red: Re = 3.83 × 10⁴, dark blue: Re = 5.74 × 10⁴, yellow: Re = 7.65 × 10⁴, green: Re = 9.57 × 10⁴; (b) definitions for the characteristic parameters of the Aeolian tone: the non-dimensional dominant frequency St 0, the peak value SPL 0, the first frequency f 1 corresponding to (SPL 0–10 dB), the second frequency f 2 corresponding to (SPL 0–10 dB) and the intensity of Aeolian tone IA; (c) comparison of IA between the results of Geyer & Sarradj (Reference Geyer and Sarradj2016) and the present experiment.

Comparison of St 0 between results of previous studies and the present measurement.

The accuracy of the present measurement of the Aeolian tone is further verified by comparing the Aeolian tone intensity IA of the plain cylinder in the experiment of Geyer & Sarradj (Reference Geyer and Sarradj2016) and the present study in figure 6(c); IA is defined by the integral of the Aeolian tone in the power spectrum density (Geyer & Sarradj Reference Geyer and Sarradj2016), as shown in figure 6(b) and (3.1),
 \begin{equation}I_A = 10 \times \log _{10}{\displaystyle{\mathop \int \nolimits_{f_2}^{f_1} PSD({\hat{p}}^2)\,{\rm d}f} \over {p_{ref}^2 }}({\rm dB}),\end{equation}
where f 1 and f 2 are the first and the second frequencies corresponding to (SPL 0–10 dB), respectively (figure 6b), and  $PSD(\hat{p}^2)$ is the power spectrum density of the sound pressure; IA is a crucial parameter in the analysis of the cylinder noise, which characterizes the overall intensity of the Aeolian tone induced by the vortex shedding. In the experiment of Geyer & Sarradj (Reference Geyer and Sarradj2016), the diameter and spanwise length of the circular cylinder model were D = 30 mm and LS = 280 mm, respectively, and the noise was measured by a microphone located at (0, 500 mm, 0) (refer to the coordinate system in figures 1 and 2) over Re = 1.62 × 10⁴ ~ 10.60 × 10⁴. Although the spanwise length of the cylinder and the microphone location in Geyer & Sarradj (Reference Geyer and Sarradj2016) are different from those in the present study, the values of IA at the monitor points of the two experiments are supposed to be roughly equal according to an empirical analysis with the theoretical model of the Aeolian tone, viz. (A3) in Appendix A. The specific derivation of the empirical analysis is provided in Appendix B. In figure 6(c), it is evident that the IA–Re curve of the present experiment accords well with that of Geyer & Sarradj (Reference Geyer and Sarradj2016), and both of the two curves conform well to the Re 6 curve (refer to the (A3) in Appendix A), demonstrating that the measurement of IA in the present experiment is reliable.
Figure 7 shows the noise spectra for the plain cylinder and the cylinder with the splitter plate for several representative cases. The splitter plate has a noticeable influence on the Aeolian tone and the high-frequency broadband noise. At a certain Re, e.g. Re = 5.74 × 10⁴ in figure 7(a–c), the Aeolian tone varies significantly with the increase of L/D. For L/D = 0.5 and 1.0, both the RSP and FSP effectively reduce the Aeolian tone, while the plates of L/D = 1.0 are more efficient than those of L/D = 0.5 (figures 7a and 7b). At L/D = 1.0, the peak value of the Aeolian tone (the SPL 0 defined in figure 6b) for the plain cylinder and cylinders with RSP1.0 and FSP1.0 are  $SPL_0^c = 84.01\;{\rm dB}$,
 $SPL_0^r = 68.68\;{\rm dB}$ and
 $SPL_0^f = 64.54\;{\rm dB}$ (figure 7b), respectively. These results manifest that an excellent noise reduction is achieved by RSP1.0 and FSP1.0; in addition, the SPL 0 reduction by FSP1.0 (19 dB) is superior to that by RSP1.0 (15 dB). At L/D = 2.0, RSP2.0 aggravates the Aeolian tone with an SPL 0 increment of 1.5 dB, whereas FSP2.0 still performs an effective reduction of approximately 10 dB (figure 7c). Besides, the St 0 of the Aeolian tone is also altered by the splitter plates. At L/D = 1.0 and Re = 5.74 × 10⁴, St 0 for the three case are
 $St_0^c = 0.192$,
 $St_0^r = 0.184$ and
 $St_0^f = 0.216$, respectively, i.e. RSP1.0 reduces St 0 by 4.2 % while FSP1.0 increases St 0 by 12.5 % (figure 7b). At L/D = 2.0, RSP1.0 and FSP1.0 increase St 0 by 4.2 % and 16.7 %, respectively (figure 7c).
Influence of L/D and Re on the power spectrum density of the cylinder noise: (a) Re = 5.74 × 10⁴, L/D = 0.5; (b) Re = 5.74 × 10⁴, L/D = 1.0; (c) Re = 5.74 × 10⁴, L/D = 2.0; (d) Re = 3.83 × 10⁴, L/D = 1.0.

At L/D = 1.0, compared with the plain cylinder, the spectrum for the cylinder with FSP1.0 exhibits an increase of noise by 8 ~ 10 dB in the high-frequency region and a rise of the second harmonic peak whose frequency St ≈ 2St 0 (figure 7b). In contrast, there is no similar change in the spectrum of the cylinder with RSP1.0 (figures 7d). Figure 8 shows the difference between the PSD of the cylinder with and without the splitter plate, denoted as ΔSPL. In figure 8(a), ΔSPL = 8 ~ 10 dB for the cylinder with FSP1.0 for St > 0.3 characterizes the noise increment (the high-frequency region and the secondary peak) due to the installation of FSP1.0. The noise increase in the high-frequency region also occurred in the experiment of Kamps et al. (Reference Kamps, Geyer, Sarradj and Brücker2017), where the flow-induced noise of a circular cylinder was controlled by flexible hairy flaps made of eight flexible plates of L/D = 0.3. Their results illustrated that in the high-frequency region, f > 1000 Hz, the spectrum of the cylinder with hairy flaps increased by approximately 10 dB compared with the plain cylinder. Kamps et al. (Reference Kamps, Geyer, Sarradj and Brücker2017), however, did not give a definite elucidation for this phenomenon. In figures 7(c) and 8(b), at L/D = 2.0, the noise in the high-frequency region for both the cylinders with RSP2.0 and FSP2.0 somewhat increases. In the light of the numerical simulations of You et al. (Reference You, Choi, Choi and Kang1998) and Ali et al. (Reference Ali, Doolan and Wheatley2011) to control the cylinder noise with RSP, and the experiments of Chauhan et al. (Reference Chauhan, Dutta, More and Gandhi2018) and Sharma & Dutta (Reference Sharma and Dutta2020) to control the flow over a cylinder with RSP and FSP respectively, a small-scale but fairly strong trailing-edge vortex, viz. the secondary vortex named in the previous literature, occurred at the trailing edge of the splitter plate at L/D ≈ 2. Thus, it can be concluded speculatively but rationally that, in the present experiment, the increase of the high-frequency noise at L/D = 2.0 is induced by the interaction between the main vortices from the cylinder and the secondary vortex at the trailing edge of the splitter plate. This interaction increases the fluctuations with a high frequency in the flow field; accordingly, the corresponding noise in the high-frequency region increases. However, in terms of the phenomenon that FSP1.0 causes the increase of the high-frequency noise and the secondary peak, this is found by the present study for the first time, and no previous literature is available, which will be discussed in §§ 3.3 and 3.4.
Spectra for ΔSPL, which is defined as the difference between the PSD of the cylinder with and without the splitter plate: (a) Re = 5.74 × 10⁴, L/D = 1.0; (b) Re = 5.74 × 10⁴, L/D = 2.0. The yellow regions denote the increment of noise in the high-frequency region and the secondary peak.

In figure 9, the reductions for the two splitter plates in the peak value of the Aeolian tone (SPL 0) in the present experiment are compared with the results in Kamps et al. (Reference Kamps, Geyer, Sarradj and Brücker2017), Geyer & Sarradj (Reference Geyer and Sarradj2016) and Octavianty & Asai (Reference Octavianty and Asai2016). The reduction in SPL 0 is evaluated by ΔSPL 0, which is defined as the difference of SPL 0 between the cylinder with and without control, i.e.  $\Delta SPL_0 = SPL_0^{\; baseline} \; -\; SPL_0^{\; control} $. The data of previous studies in figure 9 are extracted from the spectra shown in the corresponding literature by the software GetData Graph Digitizer, and the extraction accuracy is approximately 0.1 dB pixel−1. In the present study, RSP1.0 and FSP1.0 reduce the SPL 0 by ΔSPL 0 = 19 dB and 15.5 dB on average, respectively, and ΔSPL 0 alters with Re hardly at all, meaning that their performances for the SPL 0 reduction are stable, as shown by lines (b) and (d) in figure 9. By comparison, Kamps et al. (Reference Kamps, Geyer, Sarradj and Brücker2017) utilized the flexible hairy flaps to weaken the circular cylinder noise, and SPL 0 was reduced by an average of ΔSPL 0 = 20 dB for Re = 1.46 × 10⁴ ~ 3.4 × 10⁴ (line e in figure 9), which is slightly superior to the performance of FSP1.0 (ΔSPL 0 = 19 dB) in the present experiment (line d in figure 9). Nonetheless, the performance of the hairy flaps for the SPL 0 reduction is volatile, approaching the optimum stage with a reduction of ΔSPL 0 = 24 dB at Re = 2.33 × 10⁴ and then declining progressively as Re increases (line e in figure 9). So, whether the hairy flaps can still reduce SPL 0 by 20 dB on average in a higher Re range, for example Re = 4 × 10⁴ ~ 105, remains to be verified experimentally. Moreover, Kamps et al. (Reference Kamps, Geyer, Sarradj and Brücker2017) also adopted fur that was attached to the rear of the circular cylinder for the noise reduction and accomplished an SPL 0 reduction of ΔSPL 0 = 16 dB on average (line f in figure 9), which is similar to the average reduction of ΔSPL 0 = 15.5 dB for RSP1.0 in the present experiment (line b in figure 9). Geyer & Sarradj (Reference Geyer and Sarradj2016) controlled the circular cylinder noise over Re = 1.62 × 10⁴ ~ 10.60 × 10⁴ by means of surrounding the cylinder with several kinds of soft porous materials. Line (g) in figure 9 is the ΔSPL 0–Re curve that belongs to the soft porous material named Panacell 90 ppi. Panacell 90 ppi produced the optimal SPL 0 reduction of ΔSPL 0 = 8–12 dB among all the materials used in Geyer & Sarradj (Reference Geyer and Sarradj2016), which is, however, inferior to the performance of FSP1.0 in the present experiment (line d in figure 9) and the hairy flaps in Kamps et al. (Reference Kamps, Geyer, Sarradj and Brücker2017) (line f in figure 9). Compared with the hairy flaps, the fur and the soft porous material, FSP1.0 is easier to implement in practice due to its simple structure, and its reduction in the cylinder noise is excellent. Hence, in terms of the reduction in the flow-induced noise of a circular cylinder, FSP1.0 is a compact device with high efficiency.
Comparison of the reduction in the peak value of the Aeolian tone (SPL 0) among Kamps et al. (Reference Kamps, Geyer, Sarradj and Brücker2017), Geyer & Sarradj (Reference Geyer and Sarradj2016), Octavianty & Asai (Reference Octavianty and Asai2016) and the present experiment, in which  $\Delta SPL_0 = SPL_0^{\; baseline} -SPL_0^{\; control} $. Line (a–d): circular cylinder with RSP0.5, RSP1.0, FSP0.5 and FSP1.0, respectively, in the present experiment. Line (e) and line ( f): circular cylinder with hairy flaps that are made of eight FSPs with L/D = 0.3, and circular cylinder with fur that is glued using a large number of hairs with L/D = 0.5, respectively, in Kamps et al. (Reference Kamps, Geyer, Sarradj and Brücker2017). Line (g): circular cylinder surrounded by the soft porous material Panacell 90 ppi in Geyer & Sarradj (Reference Geyer and Sarradj2016). Point (h): square cylinder with a RSP of L/S = 0.5 (S is the side length of the square cylinder) in Octavianty & Asai (Reference Octavianty and Asai2016).

Octavianty & Asai (Reference Octavianty and Asai2016) controlled the noise from a square cylinder with RSP0.5 (a RSP of L/S = 0.5, where S denotes the side length of the square cylinder), and an SPL 0 reduction of ΔSPL 0 = 3.2 dB was obtained at Re = 3.3 × 10⁴, as presented by point (h) in figure 9. By contrast, at Re = 3.83 × 10⁴, both of RSP0.5 and FSP0.5 in the present experiment achieve an SPL 0 reduction of ΔSPL 0 ≈ 9 dB for the circular cylinder noise (lines a and c in figure 9). Thus, it is clear that the performance of the splitter plate in terms of the circular cylinder noise is considerably better than that for the square cylinder noise. This result further implies that the splitter plate may be more efficient in inhibiting the vortex shedding from a circular cylinder than that from a square cylinder. Interestingly, with the increase of Re, the performance of FSP0.5 for the SPL 0 reduction steadily enhances (line c in figure 9), whereas that of RSP0.5 changes slightly (line a in figure 9). At Re = 9.57 × 10⁴, the performance of FSP0.5 resembles that of RSP1.0 (lines b and c in figure 9), where a ΔSPL 0 ≈ 16 dB is yielded by both, which exceeds the ΔSPL 0 = 9.6 dB of RSP0.5 at Re = 9.57 × 10⁴ significantly. When Re is low, FSP0.5 scarcely deforms and resembles a rigid plate, so its performance for the SPL 0 reduction is similar to that of RSP0.5. In contrast, as Re increase gradually, the deformation and vibration of FSP0.5 are intensified; consequently, its performance for the SPL 0 reduction enhances. This improved performance of FSP0.5 suggests that the movements of the FSP in the wake are conducive to the suppression of the vortex shedding and subsequently the Aeolian tone.
3.1.2. Characteristics of the Aeolian tone
Figures 10(a) and 10(b) illustrate the variations of IA with L/D for the two splitter plates in the Re range 3.83 × 10⁴ ~ 9.57 × 10⁴. Figure 10(b) for the FSP only contains data in L/D = 0 ~ 3.0, because the FSP with L/D ≥ 4.0 vibrates violently with an excessive amplitude in the wake; meanwhile, a drastic resonance among the cylinder, the wind tunnel and the FSP itself is excited, preventing the subsequent measurement. In figures 10(a) and 10(b), at a certain Re, IA changes with L/D non-monotonically, where both the two IA–L/D curves of RSP and FSP perform a trend of decreasing first and then increasing. As Re increases, however, the variation tendency of IA with L/D is unchanged, except for an upward shift of the curves. This consistency of the IA–L/D tendency indicates that the mechanisms for the Aeolian tone control with the splitter plate are independent of Re in the present study. The upward shift of the IA–L/D curves with the increase of Re is attributed to the increase of the vortex shedding strength, which induces an intensification of the Aeolian tone.
Influences of experimental parameters on the intensity of Aeolian tone IA. (a) Cylinder with RSP, (b) cylinder with FSP (this figure only contains the data for L/D = 0 ~ 3.0 because a drastic resonance among FSP, cylinder and wind tunnel occurs at L/D = 4.0, preventing the experiment from continuing.), (c) variation of IA with Re at L/D = 1.0 for Re = 3.83 × 10⁴ ~ 9.57 × 10⁴.

For L/D ≤ 1.0, both RSP and FSP effectively reduce the Aeolian tone. The optimal reduction in the Aeolian tone always occurs at L/D = 1.0 irrespective of Re (figures 10a and 10b), i.e. L/D = 1.0 is the optimal length of the splitter plate for the Aeolian tone reduction. This accords with the results of You et al. (Reference You, Choi, Choi and Kang1998) and Ali et al. (Reference Ali, Doolan and Wheatley2011), where they achieved optimal reductions in the Aeolian tone for a circular cylinder and a square cylinder with RSP1.0, respectively. In terms of the RSP, RSP1.0 performs the most effective suppression of vortex shedding (Apelt et al. Reference Apelt, West and Szewczyk1973; Anderson & Szewczyk Reference Anderson and Szewczyk1997) so as to exhibit the optimal reduction in the Aeolian tone. However, there is no previous literature related to the noise reduction with FSP1.0, the mechanisms of which will be the focus in §§ 3.2–3.4. Figure 10(c) presents the variations of IA with Re for the plain cylinder and cylinders with RSP1.0 and FSP1.0. In figure 10(c), both RSP1.0 and FSP1.0 reduce the Aeolian tone considerably at different Re; besides, the IA–Re curve of FSP1.0 is approximately 4 dB lower than that of RSP1.0 on average, demonstrating quantitatively that the performance of FSP1.0 is always approximately 4 dB superior to that of RSP1.0. For Re = 3.83 × 10⁴ ~ 9.57 × 10⁴, RSP1.0 and FSP1.0 yield Aeolian tone reductions of  $\Delta I_A^r = 14\;{\rm dB}$ and
 $\Delta I_A^f = 18\;{\rm dB}$ on average, respectively.
For 1.0 < L/D ≤ 3.0, IA increases with L/D gradually (figures 10a and 10b). The RSP no longer results in an Aeolian tone reduction for L/D ≥ 2.0. IA of the cylinder with RSP2.0 is close to that of the plain cylinder, e.g. at Re = 5.74 × 10⁴,  $I_A^c = 97.31$ and
 $I_A^r = 97.98$; IA of the cylinder with RSP3.0 intensifies further and exceeds that of the plain cylinder (figure 10a). By contrast, the Aeolian tone reduction of FSP2.0 is still quite nice but is inferior to that of FSP1.0, at Re = 5.74 × 10⁴,
 $\Delta I_A^f $ (FSP2.0) = 9.83 dB, while
 $\Delta I_A^f $ (FSP1.0) = 17.70 dB, as shown in figure 10(b). Nonetheless, at L/D = 3.0, FSP3.0 aggravates the Aeolian tone (figure 10b). In summary, the length ranges of RSP and FSP for the Aeolian tone reduction are 0.5 ≤ L/D ≤ 1.0 and 0.5 ≤ L/D ≤ 2.0, respectively.
For L/D ≥ 4.0, IA of the cylinder with RSP dwindles gradually and is slightly less than that of the plain cylinder at L/D = 6.0 (figure 10a), because the separated flow reattaches to the RSP (Apelt & West Reference Apelt and West1975).
According to the analyses above, three conclusions on the cylinder noise reduction with the splitter plate for Re = O (104) ~ O (105) can be drawn:
(i) For both RSP and FSP, L/D = 1.0 is the optimal length to reduce the Aeolian tone, manifesting that there is a similarity in the mechanisms of the Aeolian tone reduction between RSP and FSP.
(ii) The performance of FSP for the Aeolian tone reduction is always superior to that of RSP, implying a discrepancy also exists in the mechanisms of the Aeolian tone reduction between RSP and FSP.
(iii) FSP1.0 exhibits the most excellent noise reduction but suffers a penalty of high-frequency region noise increase. A similar phenomenon also appears in the experiment of Kamps et al. (Reference Kamps, Geyer, Sarradj and Brücker2017), where the hairy flaps comprised of eight flexible plates were applied to reduce the circular cylinder noise.
Nevertheless, the mechanisms for the cylinder noise reduction with FSP are not clear and remain to be revealed. Since the cylinder noise control with FSP is an issue involving flow—structure--sound interaction, the characteristics of the flow fields, the deformation of the FSP (especially the modes and spectrum characteristics of the dynamic deformation field) and the noise must be comprehensively analysed to explore the underlying mechanism.
3.2. Characteristics of flow fields
3.2.1. Wake flow
Figure 11 presents the time-averaged spanwise vorticity  $\omega _z^\ast= \omega _z\cdot D/U_\infty $ as well as the time-averaged streamline. As RSP1.0 and FSP1.0 are attached to the cylinder rear, the recirculation regions originating from the flow separation are elongated significantly. Besides, the two plates are surrounded in the recirculation region. For the three cases tested, the streamwise lengths of the recirculation region, viz. the locations of the saddle points in the streamwise direction, are
 $L_r^c = 1.89D$,
 $L_r^r = 3.68D$ and
 $L_r^f = 2.62D$, respectively, as marked by the red points in figure 11. The splitter plate stabilizes the shear layers separated from the cylinder, which facilitates the shear layers to extend downstream before rolling up, so the formation length of the wake vortex augments (Gerrard Reference Gerrard1966) and then the recirculation region elongates. In comparison with RSP1.0, FSP1.0 does not absolutely impede the interactions between the upper and lower shear layers, and its movement in the wake perturbs the shear layers to some extent. These behaviours of FSP1.0 cause the locations of the shear layers rolling up and the vortex formation to be more upstream than those of the cylinder with RSP1.0. Therefore, the recirculation region length of the cylinder with FSP1.0 is shorter than that of the cylinder with RSP1.0. Similar phenomena were also shown in Shukla et al. (Reference Shukla, Govardhan and Arakeri2013) and Sharma & Dutta (Reference Sharma and Dutta2020).
Time-averaged spanwise vorticity  $\omega _z^{\ast} = \omega _z\cdot D/U_\infty $ superimposed by the time-averaged streamline, (a) plain cylinder, (b) cylinder with RSP1.0, (c) cylinder with FSP1.0.

Since the splitter plate attached to the cylinder rear alters the streamwise size of the model, it is irrational to normalize the streamwise coordinate x by the cylinder diameter D in the present study. Therefore, the length of the circulation region (Lr) is selected for the normalization of x. Figure 12 shows profiles of the time-averaged streamwise velocity U/U ∞ at different streamwise locations x/Lr. It can be seen from figure 12 that, when the streamwise coordinate x is normalized by Lr, U/U ∞ profiles for the three cases are consistent with each other. In figure 12(a), the profile at x/Lr = 0.75 presents a strong velocity deficit associated with the reversed flow U/U ∞ < 0, depicting the characteristics of the flow in the recirculation region. In figure 12(b), the profile at x/Lr = 1 characterizes the flow over the cross-section where the saddle point is located; the velocity U/U ∞ = 0 at y/D = 0 conforms to the property of the saddle point. In figures 12(c) and 12(d), the profiles for x/Lr > 1, which feature a thin velocity deficit and U/U ∞ > 0, represent not only the flow behind the saddle point but also the flow after the vortex formation and shedding. In subsequent analyses, it will be proven that the length of the vortex formation Lf and the length of the recirculation region Lr are approximately equivalent. Therefore, it is reasonable to consider that the wake vortex has formed and then shed from the shear layer in the range of x/Lr > 1; in turn, the dominant flow structures in the flow field for x/Lr > 1 are the wake vortices, namely Kármán vortices. In summary, compared with D, Lr is preferable to represent the intrinsic characteristic of the flow field, which is beneficial to explore general laws in the present study.
Profiles of the time-averaged streamwise velocity U/U ∞ at the different streamwise locations x/Lr; note that the streamwise coordinate x is normalized by the recirculation region length Lr.

Figure 13 illustrates the variation of the normalized wake width w/D with x/Lr. The wake width w is defined as the width of the local profile where the velocity is restored to half of the maximum deficit, Ud (Hu, Zhou & Dalton Reference Hu, Zhou and Dalton2006; He, Li & Wang Reference He, Li and Wang2014), as shown in figure 13(a). In figure 13(b), the variations of w/D with x/Lr for the three cases exhibit a concordant tendency. For x/Lr < 1.0, w/D diminishes immediately behind the model because the separated shear layers tend to move towards the centreline owing to the mutual entrainments between the upper and lower shear layers. At x/Lr = 1.0, w/D shrinks to the minimum, which is associated with the vortex formation and shedding at x/Lr ≈ 1.0. For x/Lr > 1.0, w/D vertically expands due to the strong turbulent mixing (He et al. Reference He, Li and Wang2014). At this stage, the wake vortices accelerate to the convective velocity and interact with each other in the wake simultaneously, causing strong turbulent mixing. The concordant variation of w/D with x/Lr for the three cases validates the rationality of the normalization of x with Lr. The value of w/D for the cylinder with RSP1.0 always outstrips those for the plain cylinder and cylinder with FSP1.0; for example, at x/Lr = 1.0, w/D of the cylinder with RSP1.0 is approximately 30 % larger than those of the other two cases. Moreover, for x/Lr > 1.0, the difference between w/D of the cylinder with RSP1.0 and the plain cylinder tends to increase. For the cylinder with FSP1.0, its w/D resembles that of the plain cylinder for x/Lr < 1.8, whereas its w/D is narrower than the plain cylinder case for x/Lr = 1.8 ~ 4.0.
(a) Definition of the wake width w, where Ud denotes the maximum velocity deficit; (b) variation of the normalized wake width w/D with x/Lr.

The wake width of a circular cylinder depends primarily on the scale of the Kármán vortices in the wake, which can be extracted by the proper orthogonal decomposition (POD). Figure 14 shows the first and second POD modes for the three cases, representing the spatial scale of the dominant coherent structures in the wake, i.e. Kármán vortices (He et al. Reference He, Li and Wang2014; Qu et al. Reference Qu, Wang, Sun, Feng, Pan, Gao and He2017). The sizes of the coherent structures increase gradually along the streamwise direction, which accords with the expansion of the wake width w/D with x/Lr (figure 13b). The coherent structure scale for the cylinder with RSP1.0 is considerably larger than the other two cases (figure 14), corresponding to its widest wake width (figure 13b). For x/Lr < 2, the coherent structure scale for the plain cylinder and cylinder with FSP1.0 is similar (figure 14), which is the reason for the equal wake width of the two cases in this range (figure 13b). However, for 2 ≤ x/Lr ≤ 4 (the range between the black dash-dot line in figure 14), the coherent structure scale for the cylinder with FSP1.0 is smaller than that for the plain cylinder; hence, in this range, the wake width of the cylinder with FSP1.0 is smaller than that of the plain cylinder (figure 13b).
First two POD modes for the plain cylinder (a, d, g, j), the cylinder with RSP1.0 (b, e, h, k) and the cylinder with FSP1.0 (c, f, i, l). (a, b, c) The first POD mods of the streamwise velocity, (d, e, f) the first POD mods of the vertical velocity, (g, h, i) the second POD mods of the streamwise velocity, (j, k, l) the second POD mods of the vertical velocity. Contour levels of ±10−3 and ±2 × 10⁻³ are superimposed on the pseudo-colour pictures to facilitate the comparison of the spatial scale.

As the wake width w/D is essential to the subsequent analyses, for a deeper exploration in the influence of the splitter plate on the wake width, the spatial scale of the wake vortices is extracted with methods of vortex identification and mathematical morphology. The flow field is firstly reconstructed with 70 % POD energy to enhance the signal-to-noise ratio of the data, and then the vortex structure is identified from the reconstructed flow fields with the λci method, which is capable of identifying the vortex structure from a flow field with strong shear (Zhou et al. Reference Zhou, Adrian, Balachandar and Kendall1999; Qu et al. Reference Qu, Wang, Sun, Feng, Pan, Gao and He2017). Here, λci is defined as the imaginary part of the complex eigenvalue of the velocity gradient tensor, and its rotation orientation is determined by the sign of the local vorticity. Based on the λci fields, the spatial scale of a vortex can be extracted with the mathematical morphology. Figure 15 shows the variation of the vertical scale of the vortices Dv/D with x/Lr. For each case, approximately 10 000 Kármán vortices are identified from more than 1600 flow fields, and the variation of Dv/D with x/Lr in figure 15 is a smooth spline fit for the vertical scale of the identified vortices against their corresponding streamwise locations. It is clear in figure 15 that Dv for the cylinder with RSP1.0 is always larger than those for the other two cases, corresponding to its largest wake width in figure 13(b). For x/Lr < 1.8, Dv values for the plain cylinder and the cylinder with FSP1.0 are approximately equal, while Dv for the cylinder with FSP1.0 gradually shows a smaller magnitude than that for the plain cylinder as x/Lr > 1.8. Analysing these facts in combination with the wake width results in figure 13(b), it is apparent that the tendency of w/D with x/Lr agrees perfectly with that of Dv/D with x/Lr, which indicates that the splitter plate influences the wake width through its control of the vortex scale in the wake. This consistency further implies that the wake width can also be used to characterize the vertical scale of the fluctuation distribution in the wake due to the well-known fact that the fluctuations in the wake are predominantly induced by the wake vortices. This result will be discussed in more detail in the next section.
Variation of the vertical scale of vortices Dv/D with x/Lr (curves in this figure are smooth spline fits for the original data).

3.2.2. Fluctuation distributions in wake flow fields
Figures 16(a)–16(c) are the distributions for the streamwise velocity fluctuation intensity  $u_{rms}/U_\infty $, which feature a dual-peak pattern in the streamwise direction. The dual peaks that are symmetrical about the wake centreline y/D = 0 correspond to the upper and lower shear layers and the subsequent wake vortices. The intense fluctuation area
 $(u_{rms}/U_\infty > 0.2)$ for the plain cylinder extends to x/Lr ≈ 5 in the streamwise direction, which is larger than x/Lr ≈ 2 for the two controlled cases. The maximum value of urms for the three cases tested are
 $u_{rms\cdot max}^c = 0.42U_\infty $,
 $u_{rms\cdot max}^r = 0.32U_\infty $ and
 $u_{rms\cdot max}^f = 0.33U_\infty $, and are located at x/Lr = 0.96, 0.98 and 0.93 in the streamwise direction, respectively. Note that the distribution of urms/U∞ is symmetric about the wake centreline y/D = 0, so that
 $u_{rms\cdot max}$ as well as the corresponding location mentioned above are averaged out from the values of the two peaks. The value of
 $u_{rms\cdot max}$ for the plain cylinder
 $u_{rms\cdot max}^c $ is markedly greater than those for the two controlled cases, demonstrating that the splitter plates successfully inhibit
 $u_{rms\cdot max}$ in the wake. The streamwise locations of
 $u_{rms\cdot max}$ for the three cases are all approximately equal to x/Lr = 1. According to the review of Williamson (Reference Williamson1996), the vortex formation length Lf in the bluff body wake is statistically defined by the distance downstream from the cylinder axis to the location where the streamwise velocity fluctuations are maximum, i.e. the streamwise location of
 $u_{rms\cdot max}$. In the present study, the formation length Lf and the recirculation length Lr are very similar in magnitude. Thus, it is appropriate to perceive that the wake vortices form at x/Lr ≈ 1 and then shed from the shear layers; the analogous result was also mentioned in Roshko (Reference Roshko1993). The approximate equivalence of Lf and Lr further validates the effectiveness of the normalization of the streamwise coordinate x with Lr; Lr distinguishes not only the flow structures and statistical characteristics inside and outside the recirculation region, but also those before and after vortex formation. Hence, Lr is powerful for portraying the general law of the flow fields in the present experiment. Since the
 $u_{rms}/U_\infty $ distribution exhibits the dual-peak pattern symmetrically about the wake centreline, the vertical distance between the maximum values of the dual peaks, denoted as
 $y_d$, is also a characteristic parameter to depict the
 $u_{rms}/U_\infty $ distribution. The value of
 $y_d$ can be used to represent the vertical distance between the vortex cores when the wake vortices just form and are about to shed;
 $y_d$ for the three cases are
 $y_d^c = 0.78D$,
 $y_d^r = 1.12D$ and
 $y_d^f = 0.80D$, respectively, further manifesting the vertical scale of the flow structures for the cylinder with RSP1.0 as larger than those for the other two cases, which conforms to the results in figures 13(b), 14 and 15.
(a–c) Distributions of the streamwise velocity fluctuation intensity  $u_{rms}/U_\infty $ with a contour interval of ±0.05, (d–f) distributions of the vertical velocity fluctuation intensity
 $v_{rms}/U_\infty $ with a contour interval of ±0.05, (g–i) distribution of the turbulent kinetic energy
 $TKE^\ast $ with a contour interval of ±0.02,
 $TKE^\ast= 0.5 \times (\overline{u^{\prime}u^{\prime}} + \overline {{v}^{\prime}{v}^{\prime}} )/U_\infty ^2 $. (a,d,g) For the plain cylinder, (b,e,h) for the cylinder with RSP1.0, (c,f,i) for the cylinder with FSP1.0.

Figures 16(d)–16( f) show the distributions of the vertical velocity fluctuation intensity  $v_{rms}/U_\infty $. Unlike the
 $u_{rms}/U_\infty $ distributions (figures 16a–16c),
 $v_{rms}/U_\infty $ distributions exhibit a single peak at y/D = 0, representing the statistical feature of the vertical periodic fluctuation induced by the alternate shedding of the wake vortices. The streamwise scale of the intense fluctuation area
 $(v_{rms}/U_\infty > 0.25)$ for the plain cylinder, which extends to x/Lr ≈ 5, is still larger than those of x/Lr ≈ 3 and 4 for the cylinders with RSP1.0 and FSP1.0, respectively. As for the vertical scale, the case of the cylinder with RSP1.0 is significantly larger than the other two cases because its maximum wake vortex scale (figures 14 and 15) leads to a wider vertical range of fluctuations. Additionally, both of the two splitter plates reduce the maximum value of
 $v_{rms}$ in the cylinder wake. The maximum values of
 $v_{rms}$ for the three cases tested are
 $v_{rms\cdot max}^c = 0.63U_\infty $,
 $v_{rms\cdot max}^r = 0.48U_\infty $ and
 $v_{rms\cdot max}^f = 0.56U_\infty $, and are located at x/Lr = 1.09, 1.19 and 1.12, respectively. The
 $v_{rms\cdot max}$ location in the range of x/Lr = 1.1 ~ 1.2 while the
 $u_{rms\cdot max}$ of x/Lr = 0.93 ~ 0.98 means that the concentration area of
 $v_{rms}/U_\infty $ is more downstream compared with
 $u_{rms}/U_\infty $. This hysteresis phenomenon of
 $v_{rms}/U_\infty $ is attributed to the fact that the vortices accelerate to the convective velocity and concomitantly interact with each other in the wake after they have shed from the shear layers at x/Lr ≈ 1.0, which causes a further increase of
 $v_{rms}$ in the wake along the streamwise direction.
In figures 16(g)–16(i), the distributions of the normalized turbulent kinetic energy  $TKE^\ast $ are presented. The
 $TKE^\ast $ is closely associated with the vortex structures of a bluff body defined by
 $TKE^\ast= 0.5 \times (\overline {{u}^{\prime}{u}^{\prime}} + \overline {{v}^{\prime}{v}^{\prime}} )/U_\infty ^2 $ and is usually used as a measurement of the turbulence mixing (Feng & Wang Reference Feng and Wang2010). Both of RSP1.0 and FSP1.0 remarkably inhibit the
 $TKE^\ast $ in the cylinder wake, especially in the range of x/Lr = 1 ~ 2. For the plain cylinder and cylinders with RSP1.0 and FSP1.0, the maximum
 $TKE^\ast $ are
 $TKE_{max}^\ast= 0.24$, 0.14 and 0.18, located at x/Lr = 1.09, 1.17 and 1.12, respectively. As
 $TKE^\ast $ is dominated by vertical fluctuations, the streamwise locations of
 $TKE_{max}^\ast $ are almost identical to those of
 $v_{rms\cdot max}$ (x/Lr = 1.09, 1.19 and 1.12 for the corresponding cases). In the cylinder wake,
 $TKE^\ast $ can be considered as a comprehensive measurement of urms/U∞ and
 $v_{rms}/U_\infty $. Since vrms/U∞ (figures 16d–16f) is significantly larger than
 $u_{rms}/U_\infty $ (figures 16a–16c), vertical fluctuations dominate
 $TKE^\ast $. Analogous results are also shown in Feng & Wang (Reference Feng and Wang2010), He et al. (Reference He, Li and Wang2014), Octavianty & Asai (Reference Octavianty and Asai2016), Chauhan et al. (Reference Chauhan, Dutta, More and Gandhi2018), Qu et al. (Reference Qu, Wang, Sun, Feng, Pan, Gao and He2017) and Sharma & Dutta (Reference Sharma and Dutta2020). Furthermore, the
 $TKE^\ast $ distributions illustrate clearly that the vertical scale of fluctuation for the cylinder with FSP1.0 (figure 16i) is smaller than those for the other two cases (figures 16g and 16h), which accords with the narrowest wake width of the cylinder with FSP1.0 shown in figure 13(b).
Figure 17 shows the mean Reynolds shear stress profiles  $\overline {{u}^{\prime}{v}^{\prime}} /U_\infty ^2 $ at different streamwise locations (x/Lr). For x/Lr ≥ 1, all of the
 $\overline {{u}^{\prime}{v}^{\prime}} /U_\infty ^2 $ distributions for the three cases are antisymmetric about the wake centreline y/D = 0 owing to the opposite rotation orientations between the upper and the lower wake vortices (figures 17b–17e). However, the cross-section of x/Lr = 0.75 contains the flow inside the circulation region, where the flow orientation is reversed compared with the external flow, so that the
 $\overline {{u}^{\prime}{v}^{\prime}} /U_\infty ^2 $ distributions exhibit a zig-zag pattern (figure 17a). For x/Lr ≤ 2, the peak value of
 $\overline {{u}^{\prime}{v}^{\prime}} /U_\infty ^2 $ for the plain cylinder is larger than those for the two controlled cases, while those of the two controlled cases are roughly equivalent to each other (figures 17a–17d). At x/Lr = 3,
 $\overline {{u}^{\prime}{v}^{\prime}} /U_\infty ^2 $ profiles become relatively flat, indicating the wake flow fields tend to be completely turbulent. Akin to urms/U∞,
 $v$rms/U∞ and TKE*, the vertical scales of
 $\overline {{u}^{\prime}{v}^{\prime}} /U_\infty ^2 $, i.e. the peak width of
 $\overline {{u}^{\prime}{v}^{\prime}} /U_\infty ^2 $, for the cylinder with RSP1.0 are larger than those for the other two cases likewise.
Profiles of the time-averaged Reynolds shear stress  $\overline {{u}^{\prime}{v}^{\prime}} /U_\infty ^2 $ at different streamwise locations (x/Lr).

In terms of the peak magnitudes of the fluctuation statistics above,  $v_{rms\cdot max}$ and
 $TKE_{max}^\ast $ for the cylinder with RSP1.0 are smaller than those for the cylinder with FSP1.0 (figure 16), whereas
 $u_{rms\cdot max}$ and
 $|{\overline {{u}^{\prime}{v}^{\prime}} } |_{max}$ for these two controlled cases are roughly equal (figures 16 and 17). Nevertheless, this does not mean that the Aeolian tone of the cylinder with RSP1.0 should be smaller than that of the cylinder with FSP1.0, since there is another factor, the scale of the intense fluctuation area, which is also a vital factor in the evaluation of the Aeolian tone intensity. For the cylinder with RSP1.0, the vertical scale of the fluctuations is remarkably larger than that for the cylinder with FSP1.0 in the near wake region (figures 16 and 17). The flow-induced noise of the bluff body arises from the overall superposition of the fluctuations in the wake rather than a certain point (Howe Reference Howe1998, Reference Howe2003), as shown in (3.3). Thus, to interpret the mechanisms for the noise reduction and for the performance differences between RSP1.0 and FSP1.0 through a simple comparison of the peak magnitudes of the fluctuations is to oversimplify these issues with an inaccurate train of thought. A more comprehensive criterion, which suffices to characterize the overall intensity of the wake fluctuations, is demanded to reveal the related mechanisms. Thus, not only the intensity of the fluctuations but also the scale of the fluctuation distributions should be considered to determine the criterion. The wake width w/D, which is closely associated with the scale of the wake vortices (figures 14 and 15), portrays the vertical scale of the wake flow (figure 13b), and most of the intense fluctuation area is included in the wake width (figure 16). Hence, the fluctuations are integrated within the wake width w/D vertically, and the results will characterize the overall intensity of the fluctuations in the wake, namely
 \begin{equation}I_\varphi = \int_{w^\ast } {\varphi \,{\rm d}y^\ast } ,\end{equation}
where w* = w/D, y* = y/D, and φ denotes fluctuation statistics as the integrand. In the present study, the Reynolds stress and the turbulent kinetic energy, i.e. Reynolds streamwise normal stress  $\overline {{u}^{\prime}{u}^{\prime}} /U_\infty ^2 $, Reynolds vertical normal stress
 $\overline {{v}^{\prime}{v}^{\prime}} /U_\infty ^2 $, Reynolds shear stress
 $\overline {{u}^{\prime}{v}^{\prime}} /U_\infty ^2 $ and TKE*, are selected as integrands. Note that the
 $\overline {{u}^{\prime}{v}^{\prime}} /U_\infty ^2 $ distribution is antisymmetric about y/D = 0 (figure 17) so that the direct integration of
 $\overline {{u}^{\prime}{v}^{\prime}} /U_\infty ^2 $ within w/D yields a result of zero; hence, the absolute value
 $|{\overline {{u}^{\prime}{v}^{\prime}} } |/U_\infty ^2 $ representing the magnitude of
 $\overline {{u}^{\prime}{v}^{\prime}} /U_\infty ^2 $ is adopted for the integration. Figures 18(a)–18(d) are the integration results of
 $\overline {{u}^{\prime}{u}^{\prime}} /U_\infty ^2 $,
 $\overline {{v}^{\prime}{v}^{\prime}} /U_\infty ^2 $,
 $|{\overline {{u}^{\prime}{v}^{\prime}} } |/U_\infty ^2 $ and
 $TKE^\ast $, denoted as
 $I_{n\cdot u}$,
 $I_{n\cdot v}$, Is and ITKE, respectively, characterizing the overall intensity of fluctuations in the wake. For a certain fluctuation variable, the variations of its integration results with x/Lr for the three cases exhibit a consistent tendency. This consistency further validates the effectiveness of x/Lr in describing the streamwise characteristics of the wake flow fields in the present study.
Variation of the overall fluctuation intensity with x/Lr. (a) In ⋅u: integration of  $\overline{u^{\prime}u^{\prime}}/U_{\infty}^{2}$, (b) In⋅v: integration of
 $\overline {{v}^{\prime}{v}^{\prime}} /U_{\infty}^2 $, (c) Is: integration of
 $|{\overline {{u}^{\prime}{v}^{\prime}} } |/U_\infty ^2 $, (d) ITKE: integration of
 $TKE^\ast $. In (c), the decay of Is with x/Lr is fitted as a linear law,
 $I_s = {-}0.06 \times (x/L_r) + C$, with a goodness of fit R 2 ≈ 0.98, where the intercepts C for the plain cylinder and cylinders individually with RSP1.0 and FSP1.0 are 0.153, 0.135 and 0.130, respectively. In (d) the decay of ITKE with x/Lr is fitted as a power law,
 $I_{TKE} = A \times (x/L_r)^{{-}0.9}$, with a goodness of fit R 2 ≥ 0.98, where the coefficients A for the plain cylinder and cylinders individually with RSP1.0 and FSP1.0 are 0.398, 0.274 and 0.258, respectively.

The overall intensity of the fluctuations (namely  $I_{n\cdot u}$,
 $I_{n\cdot v}$, Is and ITKE) for the plain cylinder exceeds those for the two controlled cases significantly (figures 18a–18d), which agrees with the strongest Aeolian tone for the plain cylinder (figure 10c). For the two controlled cases, the overall intensity of the fluctuations for the cylinder with FSP1.0 is slightly smaller than those for the cylinder with RSP1.0 (figures 18a–18d), which conforms to the noise result that the Aeolian tone of the cylinder with FSP1.0 is 4 dB lower than that of the cylinder with RSP.10 (figure 10c). Accordingly, the measurement results of the Aeolian tone in § 3.1 perform
 $I_A^c \gg I_A^r > I_A^f $, as shown in figure 10. Both RSP1.0 and FSP1.0 inhibit the overall intensity of fluctuations through their effective suppression of the vortex shedding, thereby successfully reducing the Aeolian tone. Compared with RSP1.0, FSP1.0 is more efficient in the inhibition of the overall fluctuations; as a result, its performance on the Aeolian tone reduction is superior to that of RSP1.0 (figure 10c).
There are two critical points as  $I_{n\cdot u}$,
 $I_{n\cdot v}$, Is and ITKE vary with x/Lr, namely x/Lr = 1 and x/Lr = 2 depicted by black dash-dot lines in figure 18. Based on the two critical points, three regions are identified from the curves in figure 18. In each region, a different flow characteristic dominates a different variation tendency of the overall fluctuations with x/Lr.
Region I is the vortex formation region for x/Lr ≤ 1. At this stage, the shear layers roll up to form vortices, which brings about intense regular fluctuations periodically;  $I_{n\cdot u}$,
 $I_{n\cdot v}$, Is and ITKE increase rapidly (figure 18). At x/Lr ≈ 1,
 $I_{n\cdot u}$ and Is reach maximum values, and
 $I_{n\cdot v}$ and ITKE approach the end of the linear growth stage, at which the vortices have formed and are about to shed. The splitter plate inhibits the vertical interaction of the separated flow to stabilize the shear layers, so the overall intensity of the fluctuations for the plain cylinder is always larger than those for the two controlled cases.
Region II is the vortex interaction region for 1 < x/Lr ≤ 2. At this stage, the vortices are released into the wake and then accelerate to the convective velocity. This acceleration process is accompanied by strong interactions between the upper and lower vortices so that  $I_{n\cdot v}$ still increases with x/Lr, but the increase rate decreases gradually (figure 18b). At x/Lr ≈ 1.5,
 $I_{n\cdot v}$ attains the maximum values of
 $I_{n\cdot v\cdot max}^c = 0.36$,
 $I_{n\cdot v\cdot max}^r = 0.28$ and
 $I_{n\cdot v\cdot max}^f = 0.27$ for the three cases, respectively (figure 18b);
 $I_{n\cdot v\cdot max}^c $ for the plain cylinder is 29 % and 33 % higher than those for the cylinders with RSP1.0 and FSP1.0, respectively. As
 $\overline {{u}^{\prime}{u}^{\prime}} /U_\infty ^2 $ mostly concentrates on the shear layers (figures 16a–16c),
 $I_{n\cdot u}$ decays quickly after vortex shedding at this stage;
 $\overline {{u}^{\prime}{v}^{\prime}} /U_\infty ^2 $ mainly arises from the large-scale coherent structures in the wake, so the decay of Is with x/Lr is the result of the strong turbulent mixing and vortex breaking induced by the vortex acceleration and interaction at this stage (figure 18c). Moreover, Is decay for the three cases obeys a linear law as
 $I_s = {-}0.06 \times (x/L_r) + C$, as shown in figure 18(c). The intercept C, which describes the strength of the wake vortices, positively correlates with the maximum of Is. For the plain cylinder and cylinders with RSP1.0 and FSP1.0, the intercepts C are 0.153, 0.135 and 0.130, respectively, which accords with the magnitude relationship of Aeolian tones among the three cases, viz.
 $I_A^c \gg I_A^r > I_A^f $, as shown in figure 10(c). It should be emphasized that the linear decay rate of Is with x/Lr for the three cases is a constant of −0.06 (figure 18c). ITKE can be regarded as a superposition of
 $I_{n\cdot u}$ and
 $I_{n\cdot v}$. Owing to
 $I_{n\cdot v}$ being markedly larger than
 $I_{n\cdot u}$ (figures 18a and 18b), the variation of ITKE with x/Lr is similar to that of
 $I_{n\cdot v}$ at this stage, where ITKE performs an increase with a slow growth rate, reaching the maximum value at x/Lr ≈ 1.5 (figure 18d). The maximum values of ITKE for the three cases are
 $I_{TKE\cdot max}^c = 0.23$,
 $I_{TKE\cdot max}^r = 0.18$ and
 $I_{TKE\cdot max}^f = 0.16$, respectively. The value of
 $I_{TKE\cdot max}^{\; c} $ for the plain cylinder is 28 % and 44 % higher than those for the cylinders with RSP1.0 and FSP1.0, respectively.
In region III fluctuation decays continuously (turbulence development region) for x/Lr > 2. Because of the consecutive interactions of vortices as well as the turbulent mixing, the wake flow field is more turbulent. The value of  $I_{n\cdot v}$ starts to decay with x/Lr, together with ITKE (figures 18b and 18d). The decay of ITKE obeys a power law of
 $I_{TKE} = A \times (x/L_r)^{{-}0.9}$. The coefficient A, whose physical meaning is similar to the intercept C in the decay of Is, describes the strength of the wake vortices, and positively correlates with the maximum value of ITKE, as depicted in figure 18(d). The coefficients A are 0.398, 0.274 and 0.258 for the plain cylinder and cylinders with RSP1.0 and FSP1.0, respectively, which also agrees with the magnitude relationship of Aeolian tones among the three cases, viz.
 $I_A^c \gg I_A^r > I_A^f $, as shown in figure 10(c). The exponent of n = −0.9 is ‘the linear decay rate’ of ITKE with x/Lr in the double logarithmic coordinate, as depicted in figure 19. The power decay of
 $I_{TKE}$ with x/Lr is similar in form to the energy decay in isotropic homogeneous turbulence,
 $\bar{k} = \alpha \times (x/M)^\beta $, where
 $\bar{k}$ and M are the turbulent kinetic energy and the characteristic length in the isotropic homogeneous turbulence, respectively, where the exponent β representing the decay rate is in the range of β = −1.4 ~ −1.2 in general (Krogstad & Davidson Reference Krogstad and Davidson2011; Danesh-Yazdi et al. Reference Danesh-Yazdi, Goushcha, Elvin and Andreopoulos2015). It should be kept in mind that even if the vortices have broken and gradually decay for x/Lr > 2 in the present experiment, vortices interactions are still sustained in the wake, meaning that the wake is recovering and has not reached the fully developed turbulence. Therefore, compared with
 $\bar{k}$ in isotropic homogeneous turbulence, ITKE in the present study decays more slowly, i.e. β < n < 0, as shown in figure 19. The value n = −0.9 is a common ‘linear decay rate’ for the three cases, implying that ‘the linear decay rate’ is determined by the main shape of the model, whereas the splitter plate merely affects the vortex strength (the coefficient A) and has little or no effect on the vortex decay with x/Lr.
‘Linear decay’ of ITKE with x/Lr in the double logarithmic coordinate,  $\log (I_{TKE}) = \log (A)-0.9 \times \log (x/L_r)$. The values of A are shown in figure 18(d). The bright green and bright blue dash-dot lines are reference curves with exponents of β = −1.2 and −1.4, respectively.

3.2.3 Distributions of the Aeolian tone source term
The mechanism of Aeolian tone reduction with the splitter plate has been revealed in § 3.2.2 via the evaluation of the overall fluctuations in the wake. The splitter plate inhibits the overall fluctuations associated with the vortex shedding and thereby achieves the high-efficiency reduction in the Aeolian tone. Evaluation of the vortex-induced noise from the perspective of the fluctuation intensity in the wake is an indirect method, although it is extensively applied and has been proven to be effective in the previous studies (Octavianty & Asai Reference Octavianty and Asai2016). In the present study, we still hope to statistically establish a direct relationship between the far-field sound pressure and the wake flow field, attempting to give a direct elucidation for the Aeolian tone reduction with the splitter plate. Howe (Reference Howe1989, Reference Howe1991, Reference Howe1995, Reference Howe1998, Reference Howe2003) systematically conducted a series of theoretical studies on vortex-induced noise, where Curle's solution of the Lighthill acoustic analogy, the momentum theorem and the divergence theorem were utilized. Then, the far-field sound pressure p of the Aeolian tone is directly derived by the vorticity field  ${\boldsymbol{\omega} }$ and velocity field
 ${\boldsymbol{v}}$ as follows,
 \begin{equation}p(\boldsymbol{r},t)\approx \displaystyle{{-\rho r_i} \over {4{{\rm \pi} }c_0|\boldsymbol{r}|^2}}\int {\displaystyle{\partial \over {\partial t}}(\boldsymbol{\omega } \times \boldsymbol{v})(\boldsymbol{x},t-|\boldsymbol{r}|/c_0)\boldsymbol{\cdot }\boldsymbol{\nabla }X_i(\boldsymbol{x})\,{\rm d}^3\boldsymbol{x}} ,\end{equation}
where  $\boldsymbol{r}$ is the radius vector from a sound source to the monitoring point (as the compact condition is satisfied and the location of the microphone is fixed,
 $|\boldsymbol{r}|$ is constant.),
 $\boldsymbol{x}$ is the flow-field coordinate vector as
 $\boldsymbol{x} = (x,y,z)$ (refer to the coordinate in figures 1 and 3) and c 0 is the sound speed. Here,
 $X_i$ is the velocity potential of the incompressible irrotational flow past the body, which has unit speed in the i-direction at a large distance from the body. Equation (3.3) is derived from the reduced Ffowcs Williams–Hawkings (FW-H) equation (Curle's equation) with some approximations and the specific deviation is given in Appendix C. Substituting
 $\boldsymbol{\omega }$ and
 $\boldsymbol{v}$ with the dimensionless vorticity field
 $\boldsymbol{\omega }^{\ast } = \boldsymbol{\omega }\cdot D/U_\infty $ and the dimensionless velocity field
 $\boldsymbol{v}^{\ast } = \boldsymbol{v}{\rm /}U_\infty $, we obtain
 \begin{equation}p(\boldsymbol{r},t)\approx \displaystyle{{-\rho r_iU_\infty ^2 } \over {4{{\rm \pi} }c_0D|\boldsymbol{r}|^2}}\int {\displaystyle{\partial \over {\partial t}}(\boldsymbol{\omega }^{ \ast } \times \boldsymbol{v}^{ \ast })(\boldsymbol{x},t-|\boldsymbol{r}|/c_0)\boldsymbol{\cdot }\boldsymbol{\nabla }X_i(\boldsymbol{x})\,{\rm d}^3\boldsymbol{x}} .\end{equation}
Let  $G^{\ast} = ({\boldsymbol{\omega} }^{\ast } \times {\boldsymbol{v}}^{\ast })(\boldsymbol{x},t-|\boldsymbol{r}|/c_0)\boldsymbol{\cdot }\boldsymbol{\nabla }X_i(\boldsymbol{x})$, then the far-field sound pressure p of the Aeolian tone can be deemed as a superimposition of the
 $G^\ast $ derivative at different points in the flow field;
 $G^\ast $ is a quasi-periodic variable since the energy of the Aeolian tone concentrates in a very narrow frequency band in the spectrum, as shown in figure 7. Then, from the perspective of statistics and energy conservation, the amplitude of the
 $G^\ast $ derivative positively correlates with the fluctuating intensity of
 $G^\ast $ (the root-mean-square value of
 $G^\ast $,
 $G_{rms}^\ast $). Consequently, the intensity of the Aeolian tone can be assessed by the distribution of
 $G_{rms}^\ast $ in the flow field. It must be emphasized that
 $G_{rms}^\ast $ is insufficient to represent the
 $G^\ast $ derivative completely as their positive correlation relationship is based on the statistical perspective, in other words,
 $G_{rms}^\ast $ cannot represent the instantaneous characteristics of the
 $G^\ast $ derivative. Nevertheless,
 $G_{rms}^\ast $ is still valuable for the Aeolian tone evaluation, especially, when the data of flow field are non-time resolved.
 $G^\ast $ can be defined as the source term of the Aeolian tone. If we consider a two-dimensional condition as
 $\boldsymbol{x} = (x,y)$, the streamwise velocity is far higher than the vertical velocity (namely u >> v) in the wake flow field, and
 $\boldsymbol{\omega }^{ \ast }$ is parallel to the cylinder axis (z-axis of the coordinate system defined in figures 1–3). So, the dominant component of
 $(\boldsymbol{\omega }^{ \ast } \times \boldsymbol{v}^{ \ast })$ is projected onto the vertical orientation (Howe Reference Howe1998), i.e. the y-axis of the coordinate system defined in figure 3, which corresponds to the dipole source that dominates the Aeolian tone (Phillips Reference Phillips1956; Howe Reference Howe1998). Consequently, only the vertical components of
 $(\boldsymbol{\omega }^{ \ast } \times \boldsymbol{v}^{ \ast })$ and
 $\boldsymbol{\nabla }X_i(\boldsymbol{x})$, i.e.
 $(\boldsymbol{\omega }^{ \ast } \times \boldsymbol{v}^{ \ast })_y$ and
 $\partial X_i/\partial y$, are significant in the evaluation of the far-field sound pressure in (3.4) (Howe Reference Howe1998, Reference Howe2003).
Figure 20 exhibits the spatial distributions of  $G_{rms}^\ast $, which characterizes the fluctuating intensity of the Aeolian tone source term
 $G^\ast $. During calculation of the
 $G_{rms}^\ast $ distribution, the flow field is firstly reconstructed by the POD modes containing 70 % of the total energy in order to weaken the data noise and extract the dominant flow structures. The vorticity field
 $\boldsymbol{\omega }^{ \ast }$ and velocity field
 $\boldsymbol{v}^{ \ast }$ are derived from the restructured flow field. The value of
 $\boldsymbol{\nabla }X_i(y)$ is computed with the commercial software ANSYS Fluent. For the three cases in figure 20,
 $G_{rms}^\ast $ is mostly distributed in the near wake region of 1 < x/Lr < 3, which conforms nicely to the conclusion that the Aeolian tone is mostly generated during the initial period of the vortices’ acceleration after they have been released into the wake at a distance Lf > D downstream of the cylinder axis (Howe Reference Howe1998, Reference Howe2003). It has been proven in § 3.2.2 that the vortices form and shed at approximately x/Lr ≈ 1 in the present experiment, viz. Lf ≈ Lr. The value of
 $G_{rms}^\ast $ in the recirculation region is quite low (figure 20) due to the low velocity and vorticity in this region (figure 11);
 $G_{rms}^\ast $ for the plain cylinder (figure 20a) is more intense than those for the two controlled cases (figures 20b and 20c), corresponding to its strongest Aeolian tone in figure 10(c) and the
 $G_{rms}^\ast $ distributions for the two controlled cases are similar in intensity (actually,
 $G_{rms}^\ast $ for the cylinder with RSP1.0 is a little bit larger); in addition, the vertical scale of the
 $G_{rms}^\ast $ distributions for the cylinder with RSP1.0 is larger than that for the cylinder with FSP1.0, as illustrated in figures 20(b) and 20(c). The value of
 $G_{rms}^\ast $ in the shear layers for the plain cylinder case is very high (figure 20a), while those in the shear layers for the two controlled cases are small (figures 20b and 20c). For the plain cylinder, the strong
 $G_{rms}^\ast $ in the shear layers is attributed to the immediate mutual entrainment between the separated shear layers which then quickly roll up, which introduces violent fluctuations into the flow field. This is also mentioned by Apelt et al. (Reference Apelt, West and Szewczyk1973) and Anderson & Szewczyk (Reference Anderson and Szewczyk1997). For the two controlled cases, the separated shear layers are stabilized by the splitter plates, and the vertical entrainment is inhibited as well; as a result,
 $G_{rms}^\ast $ in the shear layers is small.
Spatial distributions for the fluctuating intensity of the Aeolian tone source term  $G_{rms}^\ast $ superimposed by the time-averaged streamline; (a) plain cylinder, (b) cylinder with RSP1.0, (c) cylinder with FSP1.0.

The  $G_{rms}^\ast $ distributions are then integrated within the wake width utilizing (3.2) to evaluate the overall intensity of
 $G_{rms}^\ast $ in the wake, and the integral results (denoted as IG) are shown in figure 21. For x/Lr ≤ 1, IG for the three cases all increase with x/Lr (figure 21), where the magnitude and the growth rate of
 $I_G^c $ for the plain cylinder are greater than those for the two controlled cases. The growth rate of
 $I_G^r $ for the cylinder with RSP1.0 is approximately equal to that of
 $I_G^f $ for the cylinder with FSP1.0, whereas the magnitude of
 $I_G^r $ is always larger than that of
 $I_G^f $ (figure 21). At x/Lr ≈ 0.75,
 $I_G^c $ displays a peak (figure 21), which characterizes the intense fluctuations in the shear layers of the plain cylinder and is in accord with the distributions of
 $G_{rms}^\ast $ in figure 20(a). For 1 < x/Lr ≤ 2, IG for the three cases continue rising and attain the maximum values at x/Lr ≈ 1.8, where the maximum values for the three cases are
 $I_{G\cdot max}^c = 1.4$,
 $I_{G\cdot max}^r = 1.1$ and
 $I_{G\cdot max}^f = 0.9$, respectively. For x/Lr > 2, IG declines with x/Lr gradually, where
 $I_G^c $ is still significantly more intense than
 $I_G^r $ and
 $I_G^f $, and
 $I_G^r $ is slightly larger than
 $I_G^f $. The variation of IG with x/Lr increases drastically first and then declines gradually, which is the result of the vortex evolution in the wake, which includes the formation, release, acceleration coinciding with interactions, decay and dissipation of the vortices. From the analyses of figures 20 and 21, it is identified that the Aeolian tone is mostly contributed to by the source term
 $G^\ast $ distributing in the near wake region of 1 < x/Lr < 3, in which the intense velocity fluctuations of the wake flow field also concentrate (figures 16 and 17). As mentioned above, in the region of 1 < x/Lr < 3,
 $I_G^c $ is much more intense than
 $I_G^r $ and
 $I_G^f $, while
 $I_G^r $ is slightly larger than
 $I_G^f $ (figure 21), indicating that the splitter plates suppress the overall intensity of the Aeolian tone sources effectively but the performance of FSP1.0 is superior to that of RSP1.0. Accordingly, FSP1.0 yields the optimal reduction in the Aeolian tone by 18 dB in figure 10.
Integration of  $G_{rms}^\ast $ within the wake width according to (3.2).

The statistical characteristics of flow fields in the wake for the three cases are analysed and compared in two aspects, viz. the overall intensity of the wake fluctuations (figures 18 and 19) and the fluctuating intensity of the Aeolian tone source term (figures 20 and 21). From the analyses above, the mechanism for the Aeolian tone reduction with the splitter plate is revealed, and the reason for the preferable performance of the FSP is also elucidated. Nevertheless, with respect to the phenomenon that the high-frequency noise increases in the case of the cylinder with FSP1.0 (figures 7 and 8), no explanation can be given based only on the flow-field statistics. Since the energy of the Aeolian tone and the low-frequency noise far exceed the energy of the high-frequency noise by a factor of O(102) ~ O(103) (figure 7), the fluctuations associated with the high-frequency noise are drowned out by the large-scale fluctuations associated with the Aeolian tone and the low-frequency noise in the flow field. Hence, the time-resolved deformation of FSP1.0, particularly the out-of-plane deformation, is measured by the 3D-DIC system to investigate the fluid--structure interaction in the case of the cylinder with FSP1.0. It is hoped to deepen our understanding of in the reduction of the cylinder noise with a FSP so as to reveal the underlying physics for the high-frequency noise increase.
3.3 Deformation characteristics of FSP1.0
The out-of-plane dynamic deformation of FSP1.0 (the vibration along the y-axis, denoted as γ) is captured by the 3D-DIC system (figures 4 and 5), whose root-mean-square value γrms characterizes the deformation intensity of FSP1.0 in the cylinder wake (Shukla et al. Reference Shukla, Govardhan and Arakeri2013). Figure 22 shows the γrms distribution over the central portion of FSP1.0. It can be perceived from figure 22 that the largest deformation concentrates on the trailing edge, and the closer to the mid-span centreline, z/D = 0, the greater the deformation intensity. The maximum deformation, which spreads over x/D = 1 and −1 < z/D < 1, is  $\gamma _{rms\cdot max}\approx 0.25\;{\rm mm}$ on average, of the order of 10−2 D, which is akin to the results in Kunze & Brücker (Reference Kunze and Brücker2012), where flexible hairy flaps are used to control the vortex shedding from a circular cylinder at Re = 20 125. In Kunze & Brücker (Reference Kunze and Brücker2012), the deformation intensity at the trailing-edge mid-span point of the flexible hairy flaps is also approximately 10−2 D. With the decrease of x/D, namely approaching the fixed end of FSP1.0, the deformation decreases gradually and tends to γrms = 0 at x/D = 0.4 (figure 22). Therefore, the movement of each z/D cross-section is a cantilever-beam-like vibration, which is consistent with the results in Lee & You (Reference Lee and You2013) and Kundu et al. (Reference Kundu, Soti, Bhardwaj and Thompson2017), where two-dimensional numerical simulations were conducted to study the movement of a FSP1.0 attached to the rear of a circular cylinder in a free stream.
Spatial distribution of the out-of-plane deformation intensity γrms over the central portion of FSP1.0 (x/D = 0.4 ~ 1 and z/D = −3 ~ 3, Re = 5.74 × 10⁴). For clarity, the x coordinate is magnified by 5 times.

The time-resolved dynamic deformation fields are analysed with the POD method; the first two modes with 80 % of the total energy as well as the corresponding energy spectra of the time coefficients are shown in figure 23. The first mode characterizes the bending deformation of FSP1.0 in the flow field (figure 23a). It is illustrated that the closer to the free end and the closer to the central portion of FSP1.0, the greater the deformation, which conforms to the spatial distribution of γrms in figure 22. The second mode portrays the torsional deformation of FSP1.0 (figure 23b), which is induced by the flow across both spanwise ends of the cylinder. Owing to the inevitable end effect, as discussed in § 2.2, the flow condition near both ends is different from that across the central portion of the cylinder; hence, the true flow over the whole cylinder span is three-dimensional, although the quasi-infinite cylinder requirement is satisfied on the mid-span plane of the models used in the present experiment (figures 1 and 3). Based on the first two POD modes, a low-dimensional approximation to the original deformation fields can be reconstructed. Since the γrms distribution of the reconstructed deformation fields closely resembles that of the original one (figure 22) with a correlation coefficient of  $\hat{R}\approx 0.99$, the first two modes can completely reflect the main characteristics of the FSP1.0 deformation that is a combination of the bending and torsion. This accords with the movement of the flexible hairy flaps in the circular cylinder wake measured by Kamps et al. (Reference Kamps, Geyer, Sarradj and Brücker2017) using a high-speed camera at Re = 2.60 × 10⁴.
(a,b) The first and the second POD modes for the dynamic deformation of FSP1.0, respectively; for clarity, the x coordinate is magnified by 5 times. (c,d) Time-coefficient spectra of the first and the second POD modes, respectively.

Figures 23(c) and 23(d) show the energy spectra of the time coefficients for the first and second POD modes, respectively. In the spectra, most energy is distributed in the low-frequency region of St < 0.1, which is also similar to the movement of the flexible hairy flaps in Kamps et al. (Reference Kamps, Geyer, Sarradj and Brücker2017), implying that the movement of FSP1.0 is mainly governed by low-frequency vibration with broadband. Since FSP1.0 is made from a cloth-like material and its natural frequencies are very low (about 4.6 Hz, 28.7 Hz and 80.5 Hz corresponding to the first three modes; § 2.1), it is hard to exhibit a vibration completely dominated by a high frequency of O(102) Hz, e.g. the vortex shedding frequency (approximately 200 Hz in figure 7), unless the external force acting on the plate is large enough to lock the plate's movement, such as in the experiments of Allen & Smits (Reference Allen and Smits2001) and Shukla et al. (Reference Shukla, Govardhan and Arakeri2013). Hence, in general, the energy of the plate vibration is concentrated in the low-frequency region. In the present experiment, FSP1.0 is surrounded by the recirculation region in which both the flow velocity and fluctuations are low compared with these outside the recirculation region (figures 11 and 16). As a result, the force exerted on the plate by the flow is low, which cannot lock the movement of the plate to high frequency. The combined effects of the low natural frequencies and the low external force are the reasons that the FSP1.0 movement is dominated by low-frequency vibration with broadband. With a more in-depth analysis, it is identified that the FSP1.0 movement is chaotic. Inspired by the study of Connell & Yue (Reference Connell and Yue2007), the FSP1.0 movement is analysed with the largest Lyapunov exponent calculated using the algorithm of Wolf et al. (Reference Wolf, Swift, Swinney and Vastano1985). The largest Lyapunov exponent, λ 1, measures the divergence and convergence of nearby orbits in the phase space of a system. Since nearby orbits correspond to nearly identical states of motion, an exponential orbital divergence indicates that the system dynamics becomes unpredictable rapidly, namely, a chaotic system. A negative λ 1 means convergence and positive λ 1 divergence. The largest Lyapunov exponent is estimated for each point at the trailing edge using the time series of the out-of-plane deformation. For the present physics, a five-dimensional phase space is reconstructed based on the method of time delay (Wolf et al. Reference Wolf, Swift, Swinney and Vastano1985). The mean largest Lyapunov exponent at the trailing edge is approximately λ 1 ≈ 0.1, meaning the FSP1.0 movement is chaotic, which accords with the spectrum characteristic in figures 23 and 24 that a low-frequency vibration with broadband dominates the FSP1.0 movement. The influence of this kind of chaotic movement on the flow field and then the far-field noise will be discussed in§ 3.4.
(a) Noise spectrum for Re = 5.74 × 10⁴ and L/D = 1.0 with four characteristic regions: I low-frequency region, II dominant- frequency region, III secondary-peak region, IV high-frequency region. (b) Map of the time-coefficient energy spectra of the first thirty POD modes. Note that the logarithmic transformation is applied to the energy magnitude for clarity.

Both the two spectra in figure 23 also exhibit a prominent discrete peak at St ≈ 0.2, akin to the dominant frequency of the Aeolian tone in figure 7, representing the response of FSP1.0 to the vortex shedding. Since FSP1.0 is immersed in the cylinder wake, a flow field dominated by Kármán vortices with a frequency of St ≈ 0.2, it is inescapable that the discrete peak at St ≈ 0.2 appears under this circumstance. However, enslaved by the combined effect of the low natural frequencies of the FSP1.0 itself and the low fluctuations in the recirculation region mentioned above, the discrete peak at St ≈ 0.2 is powerless to dominate the FSP1.0 movement even if the disturbance acting on FSP1.0 emanates from vortex shedding. Accordingly, although the discrete peak is prominent and energetic, its energy is 1~2 orders of magnitude smaller than that in the low-frequency region (figures 23c and 23d).
In the spectrum of the first POD mode, a secondary peak with St ≈ 0.5 appears (figure 23c), approximately matching up with the strong secondary noise peak for St ≈ 0.44 in the noise spectrum for the cylinder with FSP1.0 as depicted in figures 7(b) and 7(d). There is a minor difference between the frequency of the secondary peaks in the first POD spectrum and the noise spectrum, which may proceed from the difference in the cylinder spanwise lengths between the deformation measurement and the noise measurement. As introduced in §§ 2.1 and 2.2, the cylinder spanwise length was LS = 1000 mm for the noise measurement (figures 1 and 2), whereas LS = 500 mm for the deformation measurement due to the size limitation of the wind tunnel D1 (figures 4 and 5), so that the interaction between the end flow and FSP1.0 in the deformation measurement is relatively stronger. Furthermore, the energy spectrum of the first deformation mode exhibits increased energy in the high-frequency region (the zone surrounded by the red box in figure 23c), which characterizes the receptivity of FSP1.0 to the high-frequency fluctuations in the flow field; the increased energy in figure 23(c) further suggests that there are increased high-frequency fluctuations mingling in the flow field for case FSP1.0. This phenomenon corresponds to the increase of the high-frequency noise for the cylinder with FSP1.0 (figures 7b, 7d and 8a). The high-frequency broadband noise is ascribed to the small-scale high-frequency fluctuations of the turbulence in the flow field (Iglesias, Thompson & Smith Reference Iglesias, Thompson and Smith2016; Avallone et al. Reference Avallone, Van der Velden, Ragni and Casalino2018). The movement of FSP1.0 in the cylinder wake leads to an increase of the high-frequency fluctuations in the flow field, and then the high-frequency noise increases accordingly. The details of this process will be discussed in depth in § 3.4.
For a further analysis of the dynamic deformation of FSP1.0 and the fluid--structure interaction, the time-coefficient energy spectra for the first thirty POD modes with more than 98 % of the total energy are calculated. Figure 24(b) shows the map of the time-coefficient energy spectra for the first thirty modes, where the pseudo-colour is used to denote the energy magnitude. In accordance with the characteristics of the noise spectrum for the cylinder with FSP1.0, four regions are identified in the noise spectrum from the low frequency to the high frequency: I low-frequency region (St ≤ 0.1), II dominant-frequency region (0.1 < St ≤ 0.3), III secondary-peak region (0.3 < St ≤ 0.7) and IV high-frequency region (St > 0.7), as shown in figure 24(a). Then, this rule is applied to divide the map of the time-coefficient energy spectra in figure 24(b) likewise. In figure 24(b), the overwhelming majority of the energy is concentrated in region I and region II of the first ten modes. With the increase of the mode rank, the energy in region II relative to the energy in region I increases progressively, for example the sixth mode, for which the energy in region II is larger than that in region I. As a result, the high energy area in the spectrum map features a tendency towards the top right. Compared with regions I and II, the energy in region III declines sharply. The spectra of several modes in region III display relatively strong energy, e.g. the first, ninth and tenth modes, which is the response of FSP1.0 to the harmonic structures in the flow field. In region IV, the energy is very low throughout because the dominant frequency of the flow field is merely St ≈ 0.2. Nonetheless, the energies of the first and ninth modes in region IV still increase somewhat compared with the global background energy in region IV, which is ascribed to the receptivity of FSP1.0 to the increased high-frequency fluctuations in the flow field.
3.4. Discussion
The characteristics of the cylinder noise reduction induced by FSP1.0 are identified based on acoustic measurement, viz. FSP1.0 effectively reduces the Aeolian tone intensity by 18 dB, which is superior to that of RSP1.0, but suffers penalties in that the secondary noise peak and the high-frequency broadband noise increase. Before a detailed discussion on the process and mechanisms by which the FSP1.0 movement changes the noise spectrum, the continuous wavelet transformation (CWT) is applied to the time series of the sound pressure signal for the plain cylinder and the cylinder with FSP1.0, respectively. The Morse wavelet is chosen as the basis in the present CWT. For more information about the Morse wavelet, one can refer to Olhede & Walden (Reference Olhede and Walden2002), Lilly & Olhede (Reference Lilly and Olhede2008) and Lilly & Olhede (Reference Lilly and Olhede2010). The time--frequency spectra from CWT as well as the related PSD from FFT are shown in figure 25. In figure 25(a) for the plain cylinder, the vast majority of the noise energy always concentrates at the dominant frequency regardless of time. By contrast, for the cylinder with FSP1.0, owing to the excellent reduction in Aeolian tone by FSP1.0, most noise energy is distributed in the low-frequency region (figure 25b), which corresponds to the low-frequency background noise of the acoustic wind tunnel (see figure 7). The energies of the dominant frequency (St = 0.216) and secondary frequency (St = 0.44) exhibit an alternate mode in the time--frequency spectrum, viz. as the energy concentrating at the dominant frequency is strong, the energy concentrating at the secondary frequency is relatively weak and vice versa. Thus, the noise PSD for the cylinder with FSP1.0 displays a strong secondary peak. For the high-frequency region (St > 0.7), the energy increase phenomena randomly spread in the time--frequency spectrum owing to the increase of the small-scale structures in the flow field, which is the result of the inescapable situation that the movement of FSP1.0 introduces extra perturbations into the flow field in the present flow--structure interaction. The temporal superimposition of the randomly spread energy in the time--frequency spectrum corresponds to the increase of the high-frequency broadband noise in the PSD (figure 25b).
CWT of the sound pressure signal acquired by the microphone, (a) for plain cylinder, (b) for cylinder with FSP1.0. Note the range of the colour scale for (a) is larger than that for (b).

After comprehensively considering the experimental results of the noise, flow field and deformation in the present study as well as previous research, we deem the underlying physics of the noise reduction with FSP1.0 lies in the following two aspects.
3.4.1. Effects of FSP1.0 on the intensity of the shear layers
As FSP1.0 is attached to the cylinder rear, the immediate interactions (the mutual entrainments) between the shear layers are impeded effectively after that they have separated from the two sides of the cylinder. Consequently, the shear layers are stabilized and then extend downstream. What the extension of the shear layers is accompanied by is the strength decrease of the shear layers due to diffusion (Anderson & Szewczyk Reference Anderson and Szewczyk1997; Serson et al. Reference Serson, Meneghini, Carmo, Volpe and Gioria2014; Sharma & Dutta Reference Sharma and Dutta2020). This strength decrease can also be perceived from figures 11. Then, the intensity of the wake vortices alternately shedding from the shear layers is suppressed. From the perspective of the spatial scale of the wake vortices, their vertical scale is shrunk by FSP1.0 (figures 14 and 15) and the wake width also decreases (figure 13b). It is well known that the Aeolian tone originates from vortex shedding, and the fluctuations in the cylinder wake are also predominantly induced by the wake vortices (Howe Reference Howe2003; Hutcheson & Brooks Reference Hutcheson and Brooks2012; Geyer & Sarradj Reference Geyer and Sarradj2016). In view of this intimate connection among the vortex shedding, the wake fluctuations and the Aeolian tone, the mechanism of the Aeolian tone reduction is explored from a statistical perspective in § 3.2.2, namely, the splitter plate effectively suppresses the overall fluctuations, which contains the effects of both the intensity and scale of the wake vortices, thereby reducing the Aeolian tone successfully. In § 3.2.3, based on (3.4) and Appendix C, the mechanism of Aeolian tone reduction is elucidated directly in terms of the distribution of the Aeolian tone source term, which is calculated from the vorticity field.
That the splitter plate weakens the shear layers and then the wake vortices is one of the vital underlying physics for the Aeolian tone reduction, and has also been validated by You et al. (Reference You, Choi, Choi and Kang1998), Ali et al. (Reference Ali, Doolan and Wheatley2011) and Octavianty & Asai (Reference Octavianty and Asai2016). In fact, this is a common mechanism of Aeolian tone reduction for both flexible and rigid plates. The special characteristics of FSP1.0 for noise reduction (its superior performance in the Aeolian tone reduction and influences on the high-frequency noise) are ascribed to the following mechanisms acting on the FSP1.0 movement.
3.4.2. Effect of the structure-vibration-induced perturbations on the shear layers
During the FSP1.0 movement in the flow field, it experiences two stages of accumulation of energy from the flow and releasing energy to the flow (Connell & Yue Reference Connell and Yue2007; Jia Reference Jia2014). This process by which FSP1.0 accumulates and releases energy inevitably disturbs the flow field and introduces extra perturbations. Since FSP1.0 is surrounded in the recirculation region, the perturbations from the FSP1.0 movement propagate in the recirculation region and reach the shear layers.
Firstly, strong harmonic structures are aroused while the disturbed shear layers roll up to form wake vortices, which finally exhibits as a secondary peak of 2St 0 in the noise spectrum (figure 7). Since the main vortices and the harmonic structures are all developed from the shear layers, the stronger the harmonic structures, the weaker the main vortices and vice versa. As a result, the energy of the dominant frequency and secondary frequency exhibits an alternate mode in the time--frequency spectrum (figure 25), whose essence is the competition in the energy assignment between the two frequencies. Similar result is also shown in the experiment of Sharma & Dutta (Reference Sharma and Dutta2020), where the FSP was used to control the flow over a square cylinder. An obvious secondary peak with a frequency of 2 times of the dominant frequency appeared in the spectrum of the flow field when a FSP with half of the side length was attached to the cylinder rear. In addition, Williams & Zhao (Reference Williams and Zhao1989) reported that a drastic increase of the secondary peak occurred in the spectrum of the hot-wire signal as the flow over a circular cylinder was perturbed by reverse-phase perturbations. The reverse-phase perturbations with the frequency of the vortex shedding were released just upstream of the forepart of the cylinder and then disturbed the shear layers. According to previous research (Procaccia Reference Procaccia1988; Connell & Yue Reference Connell and Yue2007), it is a common phenomenon that a frequency-multiplication or period-multiplication signal occurs when a nonlinear system is disturbed, which implies an initial transition of the system from periodicity to chaos.
Secondly, small-scale vortex structures are peeled from the large-scale coherent structures (viz. vortex breaking), which is another result of the fact that the shear layers are disturbed by the flexible-plate-induced perturbations as they are developing the wake structures. The small-scale structures are fragments of the large-scale coherent structures and take energy away from the large-scale coherent structures. This process further weakens the large-scale coherent structures and subsequently the Aeolian tone. These small-scale structures convect in the turbulent wake and cause the increase of the high-frequency broadband noise (figures 7 and 8). On the one hand, as the FSP1.0 movement is consecutive, the energy increase persistently spreads in the high-frequency region of the time--frequency spectrum (figure 25b). One the other hand, the movement of the flexible plate is chaotic, as discussed in § 3.3, so it is rational to deduce that the intensity of the perturbations induced by the FSP1.0 movement is random; thus, the high-frequency noise is sometimes strong and sometimes weak in the time--frequency spectrum (figure 25b). We suppose this mechanism also holds for the high-frequency broadband noise increase in Kamps et al. (Reference Kamps, Geyer, Sarradj and Brücker2017), where flexible hairy flaps were employed for cylinder noise reduction. The phenomenon that the small-scale structures cause the increase of the high-frequency broadband noise also occurred in the experiment of Ali, Azarpeyvand & da Silva (Reference Ali, Azarpeyvand and da Silva2018), although the generation mechanism of the small-scale structures was different from that in the present study. In their experiment, a porous trailing edge made from metal porous foams was employed to control the vortex shedding and trailing-edge noise from a flat plate with a blunt trailing edge. The source intensity of the trailing-edge noise was assessed by measuring wall pressure fluctuations on the trailing-edge surface. The pressure spectrum illustrated that, with the porous trailing edge suppressing the tonal peak, an evident increase of the high-frequency broadband energy (the broadband hump in their paper) emerged, which was akin to the spectrum in the present study. After a series of studies, they believed that the broadband hump was attributed to an internal hydrodynamic field generating inside the porous trailing-edge section due to flow penetration into the porous media. However, no mechanism was given to establish a bridge from the internal hydrodynamic field to the broadband hump. Linking the result of Ali et al. (Reference Ali, Azarpeyvand and da Silva2018) to the present study, it can be inferred that the broadband hump ultimately proceeds from small-scale structures because the interactions between the fluids and the porous medium inside the trailing-edge section necessarily generate plenty of small-scale structures, which then induce increase of high-frequency fluctuations.
Moreover, the authors consider that the peeling of small-scale structures from the large-scale coherent structures may be responsible for the scale contraction of the wake vortices (figure 15). This was also presented by the flow visualization shown in Cheng, Zhou & Zhang (Reference Cheng, Zhou and Zhang2003). In their experiment, the shear layers separating from a square cylinder were perturbed by piezoelectric actuators positioned at two lateral sides of the square cylinder. The flow visualization displayed that the wake vortices appeared to be broken up, showing considerably less coherence, weaker strength and smaller spatial scale than those that were unperturbed.
Synthesizing the experimental results of the far-field noise, flow fields and flexible-plate deformation in the present investigation and previous results in the literature, physical interpretations of the cylinder noise reduction with a flexible plate are propounded. Nevertheless, there are still many issues that must be researched, such as how the flexible-plate-induced perturbations propagate in the recirculation region and the detailed interactions between the perturbations and the shear layers as well as the subsequent wake vortices. For these remaining problems, a synchronized measurement of the time-resolved flow field, time-resolved deformation, noise and even dynamic force is necessary, and the requirements for the temporal and spatial resolutions are demanding and remain challenging to achieve in experiments. This will be the focus of our future studies. We hope others will share our interest.
4. Conclusions
Control of the flow-induced noise of a circular cylinder with an aft RSP or FSP is investigated experimentally in an acoustic wind tunnel over Re = 3.83 × 10⁴ ~ 9.57 × 10⁴. Three parameters, viz. the flexibility, the streamwise length of the splitter plate and the Reynolds number, are considered. The velocity fields for the three representative cases of the plain cylinder and cylinders individually with RSP1.0 and FSP1.0 are measured with a PIV system to reveal the underlying physics for the Aeolian tone reduction with the splitter plate. The characteristics of the velocity fluctuations and the Aeolian tone source terms in the wake for the three cases are analysed statistically and theoretically, respectively. Furthermore, in the present experiment, the four-mirror adaptor based single-camera 3D-DIC system is employed to investigate the fluid--structure interaction for the first time. The dynamic deformation of FSP1.0 in the wake is measured by this 3D-DIC system. The spatial distribution and the dynamic characteristics of the deformation are analysed by the POD method. The comprehensive measurements and analyses of the noise, the velocity fields and the dynamic deformation field are achieved in the present study, and conclusions are drawn as follows.
(i) For Re = O(104) ~ O(105), L/D = 1.0 is the optimized length for the cylinder noise reduction with the splitter plate, where RSP1.0 and FSP1.0 yield the optimal Aeolian tone reduction of 14 dB and 18 dB, respectively. FSP1.0 delivers superior performance in the noise reduction compared with RSP1.0. It should be noted that FSP1.0 also induces high-frequency noise increase as it performs the optimal reduction in the Aeolian tone. Thus, in the practical application of FSP1.0, a further optimization should be considered according to the situation to achieve an optimal practical effect for noise control.
(ii) The length of the recirculation region elongates significantly as the splitter plate is attached. For the three cases tested, the recirculation region lengths are
 $L_r^c = 1.89D$, $L_r^r = 3.68D$ and $L_r^f = 2.62D$, respectively. As the recirculation region length Lr is used to normalize the streamwise coordinate x, not only can the flow structures and the velocity fluctuations inside and outside the recirculation region be identified but also those before and after the vortex formation. The Aeolian tone sources are mostly distributed in the near wake region of 1 < x/Lr < 3. Both RSP1.0 and FSP1.0 inhibit the overall intensity of the fluctuations that originate from the vortex shedding, thereby reducing the Aeolian tone successfully. Furthermore, the splitter plate only affects the magnitude of the overall fluctuation associated with the strength of vortex shedding, but scarcely alters the decay law for the overall fluctuation versus x/Lr.
(iii) The intense deformation of FSP1.0 is mainly concentrated at the free end, i.e. the trailing edge. From the POD results of the dynamic deformation field, it is found that the first and second POD modes portray the bending and torsion of FSP1.0, respectively. The FSP1.0 movement is dominated by the low-frequency vibration with broadband, and the energetic periodic vibration induced by the vortex shedding. The energy transfer from the dominant periodic structures to the harmonic structures as well as the small-scale high-frequency fluctuations are excited by the FSP1.0 movement in the flow field, resulting the secondary peak and the high-frequency noise increase in the corresponding noise spectrum.


Acknowledgements
The authors acknowledge Professor B. Pan and Miss R. Xie in the Institute of Solid Mechanics at Beijing University of Aeronautics and Astronautics for providing technical supports of the single camera 3D-DIC system.
Funding
The authors appreciate the financial support for this study from the National Natural Science Foundation of China (No. 11761131009 and 11721202).
Declaration of interests
The authors report no conflict of interest.
Appendix A. Theoretical equation for the relationship between the Aeolian tone intensity IA and Re
The noise radiated from a plain circular cylinder is predominantly contributed by the dipole source due to interactions between vortex shedding and the cylinder surface (Curle Reference Curle1955; Phillips Reference Phillips1956; Howe Reference Howe1998; You et al. Reference You, Choi, Choi and Kang1998). In contrast, the acoustic power of the quadrupole is considerably lower than that of the dipole by a factor of O(10−2) and can be neglected (Howe Reference Howe1998). In the acoustic far field, the dipole emits an Aeolian tone, which performs as a sharp peak in the spectrum (the Aeolian tone), as shown in figure 6(a). For the subcritical Re range, the root-mean-square acoustic pressure  $\hat{p}$ associated with the intensity of the Aeolian tone can be expressed as follows,
 \begin{equation}\left. \begin{aligned}\hat{p}^2 &= \dfrac{\rho^{2} U_\infty^6 L_S DL_C^{\ast} St^2 C_L^2}{16|\boldsymbol{r}|^2c_0^2 }D_r(\phi_r),\\ D_r(\phi_r) &= \dfrac{\sin^2\phi_{r}}{\left(1 + \dfrac{U_{\infty}}{c_{0}}\cdot \cos \phi_{r} \right)^{4}}.\end{aligned}\right\}\end{equation}
Here, ρ, U∞, D, LS, St, CL,  $\boldsymbol{r}$ and c 0 are the fluid density, the free-stream velocity, the cylinder diameter, the cylinder spanwise length, the Strouhal number, the fluctuating lift coefficient, the radius vector from the noise source to the monitoring point and the sound speed, respectively;
 $L_C^\ast $ is the spanwise correlation length of the surface pressure fluctuations normalized by D, which is a scale of the three-dimensionality for the flow field;
 $D_r(\phi _r)$ is the directivity function of the noise radiation and
 $\phi _r$ is the angle between the free stream and the radius vector
 $\boldsymbol{r}$;
 $D_r(\phi _r) = 1$ at
 $\phi _r = 90^\circ $. This theoretical equation first given by Phillips (Reference Phillips1956) is extensively used for the scaling and verification of experimental data, and the effectiveness has been validated by previous investigations (Schlinker & Amiet Reference Schlinker and Amiet1976; Fujita et al. Reference Fujita, Suzuki, Sagawa and Takaishi1999; Hutcheson & Brooks Reference Hutcheson and Brooks2012; Geyer & Sarradj Reference Geyer and Sarradj2016).
Introducing (A1) into the definition of the SPL; then, the SPL of the Aeolian tone is obtained as
 \begin{equation}I_A = 10\log
\displaystyle{{{\hat{p}}^2} \over {p_{ref}^2 }} = 10\log
U_\infty ^6 + 10\log\displaystyle{{\rho
^2L_SDL_C^\ast St^2C_L^2 } \over {16|\boldsymbol{\mathsf{r}}|^2c_0^2 p_{ref}^2
}},\end{equation}
where  $p_{ref}$, 2 × 10⁻⁵ Pa in general, is the reference sound pressure for the SPL definition.
Substituting Re (Re = U∞ ⋅ D/ν) for U∞ in (A2), we have
 \begin{equation}I_A = 10\log Re^6 +
10\log \left( {\displaystyle{\nu \over D}} \right)^6 +
10\log\displaystyle{{\rho ^2L_SDL_C^\ast St^2C_L^2 }
\over {16|\boldsymbol{\mathsf{r}}|^2c^2_0 p_{ref}^2
}},\end{equation}
where ν is the kinematic viscosity coefficient and is basically constant in the present experiment. Equation (A3) is the approximate equation that connects the intensity of the Aeolian tone IA with Re.
Appendix B. Evaluation of the difference in IA of the plain circular cylinder between the present measurement and Geyer & Sarradj (Reference Geyer and Sarradj2016) for Re = O(104) ~ O(105)
In the present experiment, the cylinder diameter D 1 = 30 mm, the spanwise length LS ⋅1 = 1000 mm ≈ 33.3D, the location of the microphone  $\boldsymbol{r}_1 = (0,2000\;{\rm mm},0)$ and Re 1 = 3.83 × 10⁴ ~ 9.57 × 10⁴. In the experiment of Geyer & Sarradj (Reference Geyer and Sarradj2016), the cylinder diameter D 2 = 30 mm, the spanwise length LS ⋅2 = 280 mm ≈ 9.3D, the location of the microphone
 $\boldsymbol{r}_2 = (0,500\;{\rm mm},0)$ and Re 2 = 1.62 × 10⁴ ~ 10.60 × 10⁴. Note that the subscripts 1 and 2 denote the parameters in the present experiment and Geyer & Sarradj (Reference Geyer and Sarradj2016), respectively. To evaluate the difference of IA between the present experiment and Geyer & Sarradj (Reference Geyer and Sarradj2016) with (A3), we should consider the following two prerequisites, namely
(i) the values of c 0, ρ,
$p_{ref}^2 $, ν in the two experiments are constant and equal;(ii) in the range of Re = O(104) ~ O(105), CL and St in the two experiments are approximately constant (Fujita et al. Reference Fujita, Suzuki, Sagawa and Takaishi1999; Norberg Reference Norberg2003; Hutcheson & Brooks Reference Hutcheson and Brooks2012).

Considering the two prerequisites above, the main parameter differences in (A3) between the two experiments lie in LS,  $\boldsymbol{r}$, and
 $L_C^\ast $. According to the experiments of Schlinker & Amiet (Reference Schlinker and Amiet1976) and Schmidt (Reference Schmidt1965), for Re = O(104) ~ O(105), the normalized spanwise correlation length
 $L_C^\ast $ of a circular cylinder is
 $L_C^\ast{\approx} 8$, whose premise is that the circular cylinder is long enough so that the end effect scarcely affects the measurement of the spanwise correlation length. Since the spanwise range of the end effect is approximately 7D for Re = O(104) ~ O(105) (Norberg Reference Norberg1994), only LS > 15D and can
 $L_C^\ast{\approx} 8$; hence, in the present experiment,
 $L_{C\cdot 1}^\ast{\approx} 8$ as LS ⋅1 = 33.3D. On the other hand, when LS < 15D, the spanwise correlation length will not exceed the quasi-two-dimensional spanwise length of a cylinder (Phillips Reference Phillips1956), i.e.
 $L_C^\ast \le L_S/D-7$ as LS < 15D. Then, in the experiment of Geyer & Sarradj (Reference Geyer and Sarradj2016),
 $L_{C\cdot 2}^\ast{\approx} 2.3$ as LS ⋅2 ≈ 9.3D. Substituting these two sets of parameters into (A3), the difference in IA of the plain circular cylinder between the two experiments at a certain Re can be approximately evaluated as
 \begin{align}\Delta I_A&\approx 10\log
\displaystyle{{L_{S\cdot 1}L_{C\cdot 1}} \over
{|\boldsymbol{\mathsf{r}}_1|^2}}-10\log \displaystyle{{L_{S\cdot 2}L_{C\cdot 2}}
\over {|\boldsymbol{\mathsf{r}}_2|^2}} \notag\\ & = 10\log \displaystyle{{33.3D
\times 8} \over {|\boldsymbol{\mathsf{r}}_1|^2}}- 10\log \displaystyle{{9.3D
\times 2} \over {|\boldsymbol{\mathsf{r}}_2|^2}}\approx{-}1\;{\rm dB}.
\end{align}
According to the comparative analysis above, the difference of IA between the two experiments is  $\Delta I_A\approx{-}1\;{\rm dB}$; thus, it is reasonable to consider the Aeolian tone measurements of the two experiments are roughly equal at a certain Re. The comparison between the measurement results of the present experiment and Geyer & Sarradj (Reference Geyer and Sarradj2016) is illustrated in figure 6(c), where the results of the two experiments are consistent with each other. This consistency accords with the evaluation result in (B1), which further verifies the accuracy of the Aeolian tone measurement in the present experiment.
Appendix C. Derivation of (3.3) from the reduced FW–H equation
Consider the sound produced by a bluff body in a uniform flow with a density of ρ and a sound speed of c 0 under the acoustic compact condition. As the Mach number is sufficiently small (M < 0.3), the convection of the sound by the flow will be neglected. The FW-H equation reduces to Curle's equation, and the acoustic pressure in the far field is given as (Curle Reference Curle1955; Phillips Reference Phillips1956),
 \begin{equation}p(\boldsymbol{r},t)\approx \displaystyle{{r_ir_j} \over {4{{\rm \pi} }c_0^2 |\boldsymbol{r}|^3}}\int {\displaystyle{{\partial ^2} \over {\partial t^2}}[T_{ij}]\,{\rm d}^3\boldsymbol{x} + \displaystyle{{-r_i} \over {4{{\rm \pi} }c_0|\boldsymbol{r}|^2}}\displaystyle{\partial \over {\partial t}}[F_i]} ,\end{equation}
where the definitions for r, t and x are the same as those in (3.3), the term in square bracket [ ] denotes evaluation at the retarded time  $t-|\boldsymbol{r}|/c_0$, Tij is the Lighthill stress tensor and Fi is the net force exerted on the fluid by the rigid surface. The first term on the right of the equation represents the contribution from quadrupole sources and the second term from dipole sources. As the Mach number is sufficiently small, for example, Ma ≈ 0.06 in the present experiment, the noise radiation is dominated by the dipole, whose contribution exceeds that of the quadrupole by a large factor of O(1/Ma 2). Hence, the first term on the right can be considered negligible and the acoustic pressure casts in the form (Phillips Reference Phillips1956; Howe Reference Howe1998, Reference Howe2003; You et al. Reference You, Choi, Choi and Kang1998),
 \begin{equation}p(\boldsymbol{r},t)\approx \displaystyle{{-r_i} \over {4{{\rm \pi} }c_0|\boldsymbol{r}|^2}}\displaystyle{\partial \over {\partial t}}[F_i].\end{equation}
In the present experiment, the model is stationary in the free stream and the Reynolds number is large enough, Re ~ O(104). As a result, there is no contribution from inertia due to the added mass of the body to Fi, and the contribution of the viscous skin friction is negligible. Then, Fi can be expressed by the vorticity w and the velocity v as (Howe Reference Howe1995, Reference Howe1998, Reference Howe2003),
 \begin{equation}F_i = {-}\rho _0\int_V {\boldsymbol{\nabla }X_i\boldsymbol{\cdot }\boldsymbol{\omega } \times \boldsymbol{v}\,{\rm d}^3\boldsymbol{x}} .\end{equation}
Here,  $X_i$ is the velocity potential of the incompressible irrotational flow past the body, which has unit speed in the i-direction at a large distance from the body (Howe Reference Howe1995, Reference Howe1998). Substituting Fi in (C2) with (C3), then the direct relationship between far-field acoustic pressure and flow field is established as,
 \begin{equation}p(\boldsymbol{r},t)\approx \displaystyle{{-\rho _0r_i} \over {4{{\rm \pi} }c_0|\boldsymbol{r}|^2}}\int {\displaystyle{\partial \over {\partial t}}(\boldsymbol{\omega } \times \boldsymbol{v})(\boldsymbol{x},t-|\boldsymbol{r}|/c_0)\boldsymbol{\cdot }\boldsymbol{\nabla }X_i(\boldsymbol{x})\,{\rm d}^3\boldsymbol{x}} .\end{equation}
Substituting  $\boldsymbol{\omega }$ and
 $\boldsymbol{v}$ with the dimensionless vorticity field
 $\boldsymbol{\omega }^{ \ast } = \boldsymbol{\omega }\boldsymbol{\cdot }D/U_\infty $ and the dimensionless velocity field
 $\boldsymbol{v}^{ \ast } = \boldsymbol{v}{\rm /}U_\infty $, we obtain
 \begin{equation}p(\boldsymbol{r},t)\approx \displaystyle{{-\rho _0r_iU_\infty ^2 } \over {4{{\rm \pi} }c_0D|\boldsymbol{r}|^2}}\int {\displaystyle{\partial \over {\partial t}}(\boldsymbol{\omega }^{ \ast } \times \boldsymbol{v}^{ \ast })(\boldsymbol{x},t-|\boldsymbol{r}|/c_0)\boldsymbol{\cdot }\boldsymbol{\nabla }X_i(\boldsymbol{x})\,{\rm d}^3\boldsymbol{x}} .\end{equation}
From (C3)–(C5), it is expressed directly that the Aeolian tone radiated by the flow over a bluff body proceeds from the vortex shedding, which is vortex-induced noise essentially. Thus, the stronger the fluctuations induced by the vortex shedding, the more intense the dipole source as well as the Aeolian tone.



