





The authors apologise for an error in Figure 3a. The article was published with an incorrect panel for Figure 3a (right). It was accidentally duplicated from Figure 3c (right). The correct figure is below.
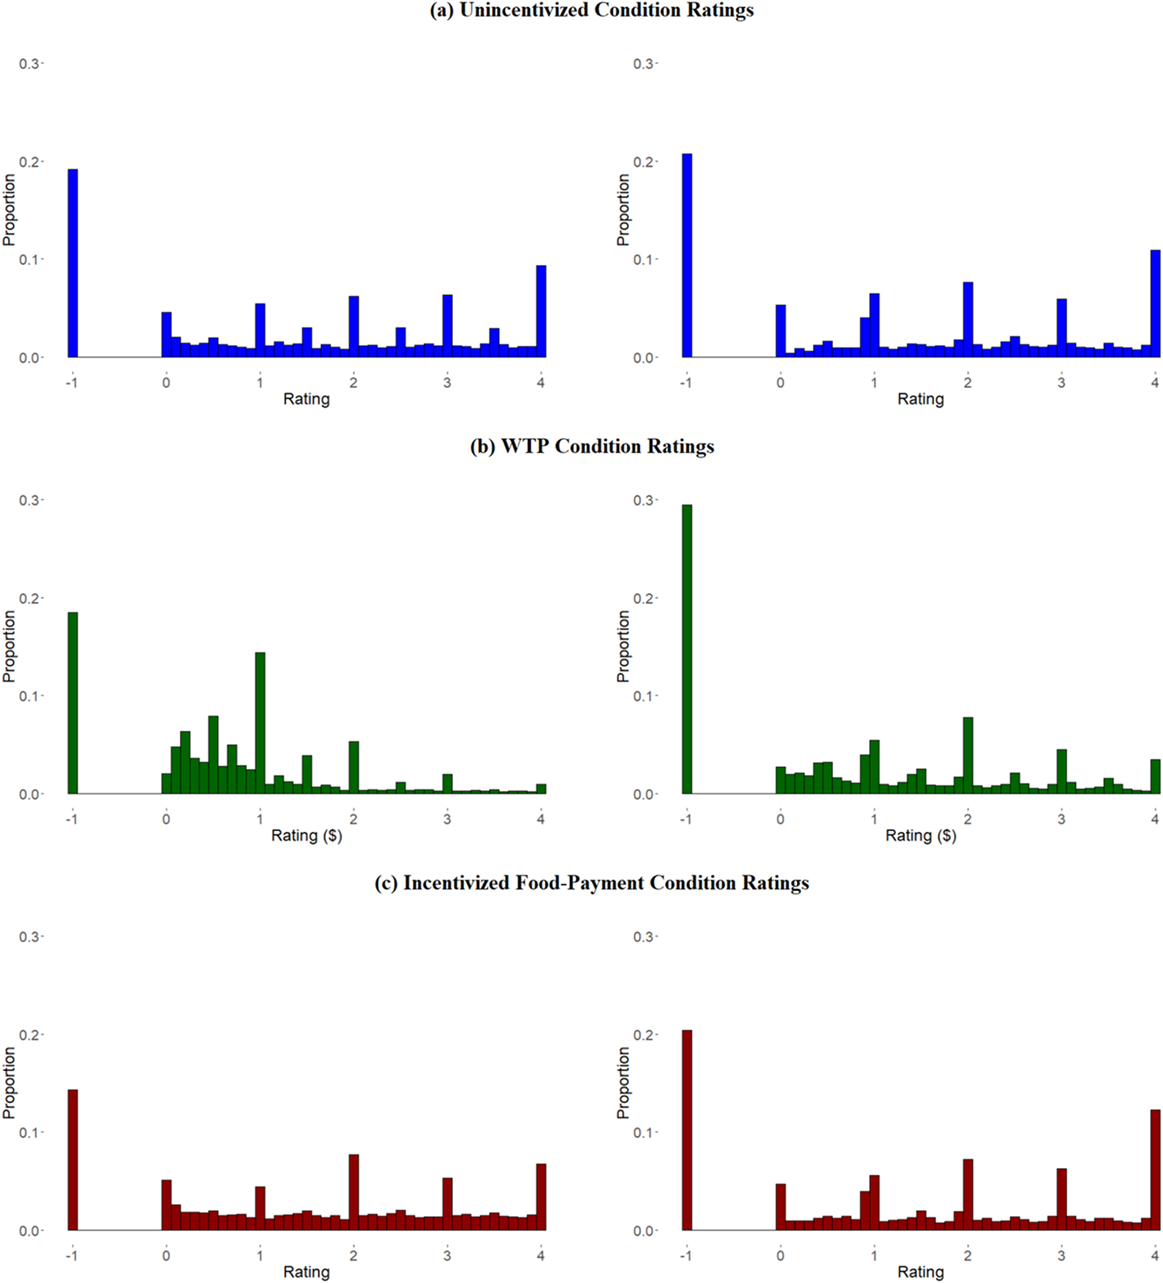
Subjective-value histograms by experiment: (Left) Experiment 1, (Right) Experiment 2. The pooled distribution of subjective-values in (a) the unincentivized rating condition, (b) the WTP condition, and (c) the food-payment condition. A value of -1 corresponds to cases where subjects chose the “Would Not Eat” option.

Figure 3 Long description
The figure consists of three rows of paired histograms. The left column represents Experiment 1 and the right column represents Experiment 2. All Y-axes are labeled Proportion, ranging from 0.0 to 0.3. All X-axes represent Rating, ranging from -1 to 4.
Row (a) Unincentivized Condition Ratings (Blue bars):
- Left: A high peak at -1 (approximately 0.2). Ratings between 0 and 4 show small peaks at whole integers 1, 2, 3, and 4.
- Right: Similar high peak at -1 (above 0.2). The distribution across 0 to 4 is more fragmented with a notable peak at 4.
Row (b) W T P Condition Ratings (Green bars):
- Left: High peak at -1 (nearly 0.2). A cluster of bars appears between 0 and 1, peaking at 1.
- Right: The highest peak is at -1 (nearly 0.3). The remaining data is sparse with a small peak at 2.
Row (c) Incentivized Food-Payment Condition Ratings (Red bars):
- Left: Peak at -1 (approximately 0.15). Relatively flat distribution between 0 and 4 with minor peaks at 2 and 4.
- Right: Peak at -1 (0.2). Notable peaks at 1, 2, 3, and 4, with the highest positive rating peak at 4.
In all conditions, the -1 value (Would Not Eat) represents a significant proportion of the total responses.


 Open access

