INTRODUCTION
The recognition that management must be informed by better understanding of ecosystem dynamics (Frid et al., Reference Frid, Paramor and Scott2005) has prompted a resurgence of interest in long-term ecological studies and in particular the role of factors such as changing climate and broad-scale human impacts on marine ecosystems (e.g. eutrophication and fishing) (Frost et al., Reference Frost, Hardman-Mountford, Kennington, Frid, Griffiths, Joint and Hawkins2005).
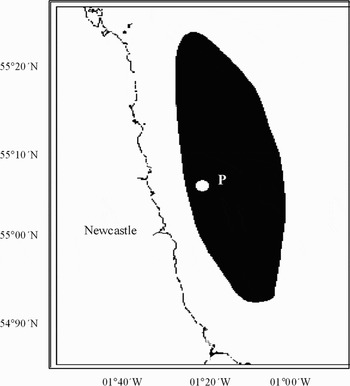
Three multi-decadal time-series are collected off the north-east coast of England in the central-west North Sea (Clark & Frid, Reference Clark and Frid2001) (Figure 1). Originally established by staff from the University of Newcastle's Dove Marine Laboratory, data collection continues using the same methods as when the series commenced (Clark & Frid, Reference Clark and Frid2001). One series considers mesozooplankton and is not considered further. The other series are of benthic macrofauna at two offshore stations away from local river discharges.
Location of the Dove time-series benthic Stations, M1 and P, in the western-central North Sea. Benthic macrofauna at Station P has been sampled every (weather permitting) January/February since 1972. Pelagic productivity is estimated from phytoplankton abundance in the CPR standard area C2.

Studies undertaken at a number of scales across the North Sea have identified a role for climatic forcing in the structuring of both zooplankton and benthic invertebrate communities (Taylor & Stephens, Reference Taylor and Stephens1980; Colebrook, Reference Colebrook1986; Aebischer et al., Reference Aebischer, Coulson and Colebrook1990; Fransz et al., Reference Fransz, Colebrook, Gamble and Krause1991; Beukema, Reference Beukema1992a, Reference Beukema, Beukema, Wolff and Brounsb; Taylor et al., Reference Taylor, Colebrook, Stephens and Baker1992; Taylor, Reference Taylor1995; Kröncke et al., Reference Kröncke, Dippner, Heyen and Zeiss1998; Reid et al., Reference Reid, Borges and Svendsen2001; Warwick et al., Reference Warwick, Ashman, Brown, Clarke, Dowell, Hart, Lewis, Shillabeer, Somerfield and Tapp2002). Previous analyses of the Dove time-series datasets have revealed some trends that parallel the pattern of variation in the climatic indices (Evans & Edwards, Reference Evans and Edwards1993; Frid & Huliselan, Reference Frid and Huliselan1996), but the high resolution of the series also suggests the operation of smaller scale complex mechanisms of community control, involving extrinsic drivers, intrinsic biotic feedbacks and anthropogenic forcing (Buchanan & Moore, Reference Buchanan and Moore1986b; Buchanan, Reference Buchanan1993; Frid et al., Reference Frid, Buchanan and Garwood1996, Reference Frid, Clark and Hall1999; Frid & Huliselan, Reference Frid and Huliselan1996; Nicholas & Frid, Reference Nicholas and Frid1999; Clark & Frid, Reference Clark and Frid2001; Clark et al., Reference Clark, Frid and Nicholas2003).
Ideally, the level of understanding of the relationships between particular drivers and the associated response in ecosystem components should allow the forecasting of the systems response to combinations of events (scenarios), much like giving a weather forecast (Dippner & Kröncke, Reference Dippner and Kröncke2003). Over recent years, close links between proxies of oceanic scale climate phenomena and weather and hydrography patterns in the North Sea have been identified (Dickson et al., Reference Dickson, Kelly, Colebrook, Wooster and Cushing1988; Taylor, Reference Taylor1996; Zeiss & Kröncke, Reference Zeiss and Kröncke1997; Kröncke et al., Reference Kröncke, Dippner, Heyen and Zeiss1998; Dippner & Kröncke, Reference Dippner and Kröncke2003; Muren et al., Reference Muren, Berglund, Samuelsson and Andersson2005). For example, the North Atlantic Oscillation accounts for a third of the total variance in sea-surface air pressure over the North Sea. Therefore, there may be the possibility to make predictions about regional scale weather and hydrographic patterns in the North Sea using oceanic scale climatic proxies. However, utilizing these for bioresource management, nature conservation protection or simply predicting the variability in key ecosystem components is unlikely to be straightforward.
The Dove benthic time-series include two stations, M1 and P. Station M1 lies inshore of Station P and analyses have shown that the dynamics of the benthos are influenced by climatic variation, environmental conditions (winter temperature) and carbon flux to the benthos (Frid et al. in press). Station P lies further offshore in an area heavily trawled for Nephrops; previous analyses of the benthos at Station P have suggested that local fishing activity may be a major influence on the variability in community structure (Frid et al., Reference Frid, Clark and Hall1999; Bremner et al., Reference Bremner, Frid and Rogers2005). In this paper we focus on the dynamics over the last 36 years of the infaunal benthos at Station P, 18.5 km off the coast of Northumberland, to examine the relative and shifting influence of climate, food supply and fishing in the dynamics of the seafloor community. We use the results of these analyses to consider the potential for offering predictive insights for marine environmental management.
MATERIALS AND METHODS
Dove benthic series—Station P, 1971–2006
Station P (55° 07′N 01°15′W) lies 18.5 km off the north-east coast of England and in 80 m water depth (Figure 1). The sediment is silty-sand with a greater than 50% silt–clay content, of which around 20% is faecal pellets. The community at the station is the Brissopsis lyrifera–Amphiura chiajei variant of the Amphiura filiformis community type (Petersen & Boysen-Jensen, Reference Petersen and Boysen-Jensen1911). The station was initially sampled in January 1971 and the dataset analysed here covers samples taken in January/February of each year from 1971 to 2006. In 1998 no sample was taken as the weather and operational constraints prevented sampling.
On each sampling occasion at least 5 (and in some of the early years as many as 30) 0.1 m2 grab samples were collected. Each was gently sieved over a 0.5 mm mesh and the residue fixed in 4% buffered formalin. All organisms were identified to species, where possible and enumerated. Buchanan & Warwick (Reference Buchanan and Warwick1974) and Buchanan & Moore (Reference Buchanan and Moore1986b) describe the methods of sampling in detail. In 1971–1972 30 grabs were taken, between 1973 and 1978 10 grabs were taken and since 1979 5 grabs. This change in effort means that the early data will contain more rare species than in latter years, if the community remained unchanged. This has implications for measures using richness or ordinations of assemblage composition. Unfortunately the original raw data are no longer available and so it is impossible to use rarefraction techniques to compensate for the change. We proceed by including all the data but bear in mind the dates of changed effort (1972–1973; 1978–1979) when interpreting the result. Examination of the published rarefraction curve for the early years (1971–1972, N = 30 grabs) (Buchanan & Warwick, Reference Buchanan and Warwick1974) also reassures us that the influence will be minor.
Series of potential extrinsic drivers
Inter-annual variations in climate were described by the North Atlantic Oscillation Index (NAOI), which is the, normalized, mean atmospheric pressure at Gibraltar minus that at Iceland. The NAOI therefore reflects the gross atmospheric conditions over the North Atlantic and correlates with broad variations in weather in north-eastern Europe (Hurrell, Reference Hurrell1995; Jones et al., Reference Jones, Jónsson and Wheeler1997). The winter (December–March) NAOI data used were from Jones et al. (Reference Jones, Jónsson and Wheeler1997) and updated following Osborn (http://www.cru.uea.ac.uk/~timo/datapages/naoi.htm).
Station P is situated in an area of strong tidal flows and stratification of the water column only occurs in some years, and when it does occur, only persists for the summer and is relatively weak. Sea-surface temperature therefore reflects the seabed temperature during the winter (the period of maximum mortality) and the spring settlement period. Environmental conditions were therefore indexed by the average winter sea-surface temperature (SST) anomalies for 1970 to 2006 (calculated with respect to the long term, 1961–1990, mean). Winter is defined as the average of December, January and February. For example, winter 1970 is the average of December 1969, January 1970 and February 1970. Anomalies are in degrees C. As we are concerned with the influence of large scale climatic/environmental variation the series used is the average for the whole of the Atlantic north of the equator.
Phytoplankton production and hence organic input to the benthos was derived from the ‘greenness’ of the silk recorded by the Continuous Plankton Recorder (CPR). Data are the annual mean (comprising all available samples) for the CPR standard recording area C2 (central-western North Sea) (see http://www.sahfos.ac.uk/standard_areas.htm). While these data provide no information on the actual flux of material to the seafloor or the nature of the phytoplankton they have the advantage of being available for the whole period and have been previously used (Buchanan, Reference Buchanan1993 and references therein) as a proxy for pelagic inputs to the benthos in this region. Following Buchanan (Reference Buchanan1993) we apply a 2 year lag to the data, such that the benthos in 1972 is considered against the phytoplankton colour index for 1970. This accounts for the time of sampling (it would be inappropriate to correlate a benthic sample taken in February 1972 with the phytoplankton levels seen in 1972) and a period for a biological response, i.e. to allow benthic organisms to settle and establish in response to a productive period to grow to sufficient size to recruit to the sieve.
The level of fishing activity at the site was indexed by the annual area (km2) swept over by fishing gear. This is derived from hours fishing in the area reported in fishers' log books and the geometry of the gear used (see Frid et al., Reference Frid, Clark and Hall1999). The temporal variation of fishing at the site has previously been divided into 5 categories: Phase 1 low effort 1971–1981; Phase 2 medium effort 1982–1986; Phase 3 peak effort 1987–1989; Phase 4 post-peak medium effort 1990–1995; and Phase 5 post-peak low effort 1996–2001 (Frid et al., Reference Frid, Clark and Hall1999). Given the low levels in recent years a sixth category was added for the analysis here, with Phase 5 covering 1996–2000 and the new Phase 6 very low effort 2001–2006. As benthic sampling occurs in February, a shift of 1 year was applied to these data such that the benthos in February 1972 was correlated with the fishing intensity experienced in 1971, etc.
Data analysis
Benthic data used in this study are total genera abundance per square metre based on the five (or more) replicate samples. Analysis at the genus level avoided any problems due to, occasional, errors of misidentification at the species level, or changes in taxonomy leading to problems with homonyms and will reduce the effect of the higher sampling effort in earlier years. The full data set included 262 taxa, this reduced to 173 genera. Genera richness, diversity and total abundance are based on the entire un-manipulated data set. For multivariate analyses of the community composition the dataset was transformed (log (x+1)) to decrease the influence of very common taxa and increase the contribution of rare taxa.
Temporal changes between periods (i.e. decades) were examined by ANOVA, linkages between univariate indices and species data and environmental series were assessed using product–moment correlation coefficients and linear regression analyses. Shifts in the genera composition of the assemblage was assessed by calculation of the Bray–Curtis similarity between samples and subsequent non-metric multidimensional scaling (MDS) ordination. The patterns in the ordinations were interpreted in relation to changes in the values of the environmental drivers. Given that the environmental drivers were at best representations of the patterns in the environment, e.g. NAOI indexing atmospheric conditions, swept area indexing fishing activity, we deliberately sought to avoid trying to use the absolute values of the indices as predictors. Rather we considered the nature of the benthic community in groups of years where the value of the index was similar.
RESULTS
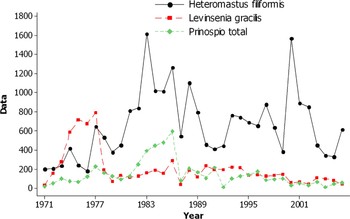
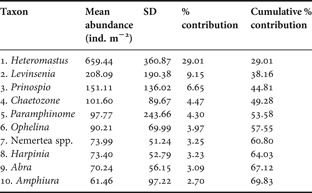
Of the 173 genera (or higher taxa) recorded during the series, the ten most abundant account for almost 70% of the individuals present (Table 1). The most abundant genera overall was the Capitellid polychaete Heteromastus which alone accounted for nearly 30% of the organisms found. While polychaetes dominated, the top ten taxa also included Nemertea, an amphipod, a bivalve mollusc and an ophiuroid (Table 1). Over the 36 year period the dominant taxon was Heteromastus every year except between 1973 and 1977 when Leveinsenia became dominant (Figure 2). Similarly Prinospio increased during the 1980s, doubling its abundance from 1981 to 1982 and further increasing its population each year until 1986 when its density was almost four times the long term average. It was the second ranked taxon from 1982–1987. The Prinospio population then crashed back to more ‘typical’ levels, at which it has persisted up to the present. In some years many species vary in a similar manner, i.e. from 1976 to 1977 and from 1985 to 1986 the top three taxa all increased their abundances simultaneously. However, in most years the fluctuations are not synchronous (product–moment correlation of Heteromastus versus Levinsinia r = −0.23 not significant; Levinsinia versus Prinospio r = 0.12 not significant; Heteromastus versus Prinospio r = 0.56 P < 0.01).
Time-series plot of the abundance (individuals per m2) of the three numerically dominant taxa from the macrobenthos at Station P 1971–2006.

The mean abundance (N = 36), standard deviation (SD) and contribution to the macrofaunal assemblage at Station P of the ten most abundant genera in the 1971–2006 series.

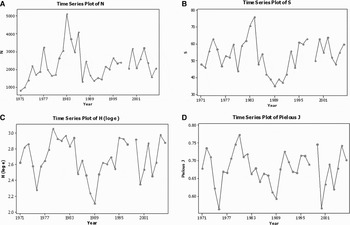
The total abundance of macrobenthos varied significantly between decades (ANOVA F = 3.46, P = 0.028) with the 1970s having significantly lower abundance than the 1980s and with the 1990s and 2000s being intermediate and not differing significantly (Figure 3A). While there is a marked period, 1987–1992, of low richness and Shannon–Weiner diversity (Figure 3B, C), there was no overall trend in richness, diversity or evenness (Figure 3D), nor any significant differences between decades.
Time-series plots for the macrofaunal assemblage at Dove time-series Station P (central-western North Sea) based on at least 5 replicate 0.01 m2 grabs. (A) Total abundance (individuals per m2); (B) genera richness; (C) Shannon–Weiner diversity; (D) Pielou's evenness.

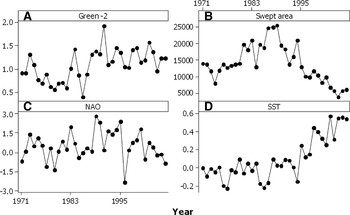
The environmental conditions during the last 36 years have also varied at the site. Sea-surface temperature shows a strong upward trend, particularly since the mid-1980s (Figure 4D). The North Atlantic Oscillation Index was higher in the mid-1980s and early 1990s than the earlier part of the series, but has decreased in recent years. The NAOI reflects atmospheric conditions and broad weather patterns over the North Sea such that when the NAOI is high there tends to be a strong westerly flow of relatively warm air over the UK and North Sea (Fromentin & Planque, Reference Fromentin and Planque1996; Clark & Frid, Reference Clark and Frid2001). Pelagic productivity, as indexed by the CPR silk ‘greenness’ shows a marked shift in the mid-1980s with the higher levels being maintained for the remainder of the series. Fishing intensity increased from the 1970s, as demand for Nephrops grew and the herring fishery declined; it peaked in the late 1980s and has since declined such that recent years (2001–2006) have the lowest intensity in the 36 year series. The detailed differences in the patterns of variation in these potential drivers offer some hope of disentangling their relative contribution to ecological dynamics of the benthos.
Time-series of potential drivers. (A) Pelagic productivity 2 years previously as indexed by the greenness of the CPR silk (nominal scale); (B) the total area swept by fishing gears in ICES statistical rectangle 39E8 (km2); (C) the North Atlantic Oscillation Index (dimensionless) as derived from the atmospheric pressure difference between Gibraltar and Reykjavik; (D) deviations of sea-surface temperature in the North Atlantic from the long term mean (1961–1990) (oC).

Total macrofaunal abundance and the evenness of the assemblage did not show any simple relationship with any of the potential drivers examined. Changes in diversity (both genera richness and Shannon–Weiner) were correlated with the intensity of fishing (genera richness versus swept area3 r2 = 20.9%, P = 0.003; Shannon–Weiner versus swept area3 r2 = 21.2%, P = 0.003).
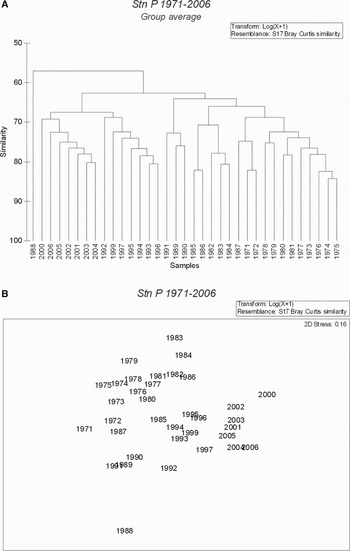
Cluster analysis on the Bray–Curtis similarity in faunal composition between years (Figure 5A) indicates that 1988 is a very distinct year while the remainder of samples fall into 2 chronological groups with a break between 1992 and 1993. Within the latter period there is a further break between 1999 and 2000. The taxa driving the change between 1991 and 1992 were Chaetozone setosa and Minuspio, which were more abundant early in the series and occurred in lower abundances after 1992, and Commensodorum commensalis, Paramphinome jeffreysii and Thelepus cincinatus, which were more abundant in the latter period (SIMPER analysis). Non-metric multidimensional scaling (MDS) ordination of the Bray–Curtis similarities was used to examine interannual changes in the macrofaunal assemblage (Figure 5B) and clearly showed a progressive change in composition from the early years, which appear to the left of the ordination, to the composition in recent years, which appear to the right.
Benthic macrofaunal assemblage composition at Station P 1971–2006. (A) Dendrogram of Bray–Curtis similarities in genera composition; (B) non-metric multidimensional scaling ordination of Bray–Curtis similarities.

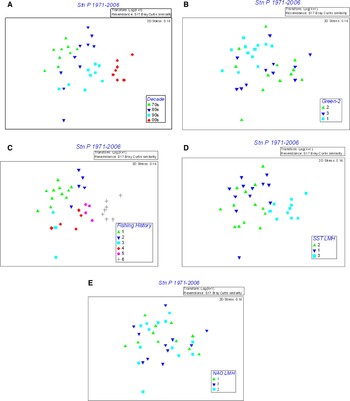
Macrofaunal composition appears to undergo interannual variation and periodic shifts in composition on approximately decadal scales (Figure 6A). Pelagic productivity had some influence on benthic macrofaunal composition. The macrofaunal assemblage in years with a high productivity (greenness) (years ranked in the top third) and low years (greenness ranked in the bottom third) separated in the MDS ordination with moderately productive years interspersed amongst the high years (Figure 6B). One-way ANOSIM indicated a significant (P < 0.015) effect of greenness with the largest differences being between low and high years (R = 0.266) and low and moderate years (R = 0.265).
Non-metric multidimensional scaling ordination of Bray–Curtis similarities in genera composition of the macrobenthos at Station P 1971–2006 showing variation by: (A) decade; (B) pelagic productivity as indexed by CPR silk ‘greenness’ 2 years previously; (C) fishing history (fishing intensity increased in periods 1 and 2, peaked in period 3 and has subsequently declined through 4, 5 and 6, see text for full explanation); (D) sea-surface temperatures in winter (December–March) in the North Atlantic; and (E) winter NAOI for (B), (D) and (E). 1, Low (years ranked in the lowest one-third of observations); 2, moderate (the mid-third of observations); and 3, high (observations in the highest one-third).

Fishing activity was also a significant influence (one-way ANOSIM P < 0.001) on the faunal composition (Figure 6B). The macrofaunal composition in Phases 4 and 5 and Phases 3 (highest fishing) and 4 were most similar to each other (R = 0.30 and 0.32 respectively) (Figure 6C). As none of the high fishing intensity years were low productivity years there were insufficient data to carry out a two-factor analysis.
There was also a significant effect of winter sea-surface temperature on community structure (one-way ANOSIM R = 0.413, P < 0.001; Figure 6C) but this was solely the result of the warmest years all being in the last decade. The other climate indicator, the North Atlantic Oscillation Index, did not appear to directly influence macrobenthic assemblage composition (one-way ANOSIM R = −0.42, not significant; Figure 6D).
DISCUSSION
The Dove time-series represents the longest continuous time-series of offshore macrofaunal dynamics. Previous analyses of the time-series for Station P, which is located in an area fished by otter trawling for Nephrops, has shown a clear effect of fishing on abundance, diversity, species composition and the ecological functioning of the assemblage (Frid et al., Reference Frid, Clark and Hall1999; Frid & Clark, Reference Frid, Clark, Kaiser and deGroot2000; Bremner et al., Reference Bremner, Frid and Rogers2003, Reference Bremner, Frid and Rogers2005; Robinson, Reference Robinson2004). Following the collapse of the ground fish stocks in the North Sea and implementation of the revised European Common Fisheries Policy in 2002 fishing intensity has been at its lowest since the series began in 1971. It was therefore timely to examine the extent to which the dynamics and control of the system have responded to this release.
Early analysis of this series highlighted a period characterized as ‘unstable’ by Buchanan (Buchanan & Warwick, Reference Buchanan and Warwick1974), with total abundance showing a generally upward trend and major shifts in the rank order of species, although species richness was fairly constant. By 1976 the pattern seemed to be stabilizing and moving towards an ‘equilibrium condition’ (Buchanan et al., Reference Buchanan, Sheader and Kingston1978). By 1985 the system was being described as one that showed ‘periods of stability, interspersed with periods of change’ (Buchanan & Moore, Reference Buchanan and Moore1986a). The analyses presented here show that macrofaunal abundance shifted, increasing during the 1970s and up to 1983 before crashing and then rebuilding from 1990 (Figure 3A). Given that most of the dominant species are deposit feeders and the numerically dominant is a short lived (6–9 months; Paramor, personal communication) opportunistic deposit feeder, one would predict a relationship with the flux of material into the benthos from the overlying water column. Buchanan et al. (Reference Buchanan, Sheader and Kingston1978), based on analysis of the first ‘unstable’ period, developed the hypothesis that variations in winter (December–May) temperature were the main driver of the macrobenthos (NB: this is not the definition of winter used here). This argument was reliant on a period of cold winters in the 1960s being followed from 1971 by a series of mild, warm, winters and that this coincided with the change in macrofauna. A run of cold winters from 1979 was therefore predicted to cause a reversion of the macrofauna to that seen in the 1960s and the first couple of years of the time-series. This did not happen; while the change in winter conditions did coincide with a change in macrofauna the system actually moved to a new configuration (Buchanan & Moore, Reference Buchanan and Moore1986a). This led to the conclusion that the primary driver of the system was variation in organic input as this seemed to regulate the numbers of the dominant taxa. Winter temperature played a role in community dynamics but it was more minor through control of ‘rare’ species in the system (Buchanan & Moore, Reference Buchanan and Moore1986a).
While the higher sampling effort in the first few years of the series means we must be cautious, over the 36 year series genera richness has been higher in years with higher total abundance (r2 = 32.3%, P < 0.001) suggesting that whatever was the factor allowing greater infaunal abundance, the changed conditions were responded to opportunistically by new species establishing. Therefore, in spite of this station being in 80 m of water and 18 km offshore the system seems a variable and open one. Thus, after 36 years of monitoring we are in agreement with Buchanan's conclusions reached after 4 years. Examination of the ordination of species composition suggests that the system has changed throughout the period (Figure 5B). The system seems to undergo quasi-stable periods with interannual variations and then more major shifts every 10 years or so (Figure 6A). The most dramatic of these changes, between 1991 and 1992 (Figure 5A) might be seen as the benthic, lagged, response to the now widely accepted North Sea ‘regime shift’ identified from the CPR as occurring around 1988 (Reid et al., Reference Reid, Borges and Svendsen2001; Lees et al., Reference Lees, Pitois, Scott, Frid and Mackinson2006). This marked change in system dynamics is apparent in plankton records from a wide area of the north-eastern Atlantic and appears to be linked to changes in atmospheric dynamics/meteorology, as indicated by the NAO index. Similar shifts have also been reported for estuarine fish (Attrill & Power, Reference Attrill and Power2002; Henderson, 2007). Thus, the influence of meteorological drivers on marine ecosystem dynamics is persuasive but the mechanisms are complex involving mediation through the plankton (e.g. impacts on fish larvae in Henderson, 2007) or pelagic–benthic coupling (this study) that produces time lagged responses. Correlations will never allow causality to be established. In this study the situation is further complicated by the fact that some of the factors are interrelated, the NAO influences weather and so sea-surface temperature, but SST affects evaporation, and this in turn influences atmospheric dynamics and so the NAO. Frustratingly the peak period for the fisheries also coincided with a change in the dynamics of the NAO. We must therefore seek other studies, experimental work or modelling, to provide an understanding of the mechanisms that might give rise to the observed patterns.
Long term field studies of benthos in the Baltic and southern North Sea have tended to identify a critical role for winter weather, particularly temperature, in macrobenthic dynamics. At an offshore station in the Gulf of Riga in the Baltic there was an influence of winter weather on macrobenthos but the signal was lost at an inshore station due to influence of riverine inputs (Dippner & Ikauniece, Reference Dippner and Ikauniece2001). Winter sea-surface temperature also affected spring zooplankton in the central Baltic (Dippner et al., Reference Dippner, Kornilovs and Sidrevics2000).
Shallow (10–20 m) stations in the southern North Sea, sampled between 1978 and 1994, showed a strong effect of winter temperature. Increased biomass since 1989 was attributed to weather and eutrophication (Zeiss & Kröncke, Reference Zeiss and Kröncke1997). On the Dogger Bank, central North Sea, a comparison of macrofaunal assemblages described from the 1950s, with samples from the 1980s, showed that the changes in the communities from the 1950s to the 1980s included increased species numbers and an increased dominance by short-living opportunistic species with a decrease in long-lived bivalves (Kröncke, Reference Kröncke1990). The total biomass in 1985–1987 was 2.5 to 8 times higher than in 1950–1954 (Kröncke, Reference Kröncke1992). This was attributed primarily to lowered water quality, especially an eutrophication effect, and changes in weather conditions. Dippner & Krönke (2003) were able to use relationships between environmental parameters and macrobenthos to develop a predictive model of southern North Sea macrobenthos that demonstrated that a significant part of the interannual and long term variation in macrofaunal biomass was due to the physical conditions experienced in winter.
The emergent picture then, is that shallow, inshore stations are influenced by riverine inputs (nutrients and allochthonous organic material) and winter weather. At offshore stations such as the Dogger Bank and Station P, the system is more influenced by large scale phenomena such as climate, the flux of organic matter to the benthos and fishing disturbance. The clearest signal at Station P over the last 36 years is the changes associated with changes in fishing intensity, both in emergent indices such as genera richness or Shannon–Weiner diversity, but also species abundance patterns and hence ecological functioning (Bremner et al., Reference Bremner, Frid and Rogers2003). The strong influence of these external drivers in the ecological dynamics of these offshore sediments should not however be interpreted as implying that biological interactions, such as predation, are not important. However, the high number of possible linkages in such diverse assemblages and our poor understanding of the natural history of most of the species encountered in offshore benthic systems make it difficult to elucidate the role of biotic interactions compared to the relatively simple (species poor) systems in the intertidal (c.f. Beukema et al., Reference Beukema, Essink and Dekker2000). As understanding of the ecology of the offshore benthic species increases, the expectation must be that they will contain similar biological mechanisms to intertidal communities.
The apparent delay between the pelagic regime shift in 1988 and the shift in benthic species composition in 1991–1992 might be seen as an ecological lag. Not only is there a lag due to production settling to the seafloor and being taken up and utilized by benthos but the greater longevity, compared to planktonic organisms, of the benthos mean that there is a dampening effect in the system. In addition, mesocosm experiments suggest that environmental warming may increase pelagic heterotrophic remineralization of pelagic production and so potentially reduce the influx to the benthos (Muren et al., Reference Muren, Berglund, Samuelsson and Andersson2005). Such changes could cause further lags and non-linearities in the benthic response to altered ecosystem dynamics.
In addition to the direct evidence of change coming from studies of the seafloor, there have also been attempts to infer change in the benthos from changes in other data series. For example, Lindley et al. (1995) noted changes in the abundance of larvae in the plankton and linked this to changes in the benthos, with a marked shift occurring around the 1980s. Lindley & Batton (2002) considered the possibility that this arose from an increase in the abundance of the burrowing sea urchin Echinocardium cordatum, which does well in mild winters. Kirby & Lindley (2005) used molecular techniques to identify 94 echinoderm larvae from North Sea CPR plankton samples. Useful DNA was extracted from 24 larvae, and of these 18 were larvae of burrowing sea urchins, 3 of brittlestars and 3 from spiny starfish. They suggest that the rise in echinoderm larvae noted since the 1980s is largely due to increases in urchins and thus is consistent with an effect due to milder winters. An increase in urchins may also be the result of declining levels of fishing activity. However, these studies have not measured the number of urchins and the results could be due, at least in part, to changes in the abundance and survival of the larvae in the plankton. That environmental and ecological conditions in North Sea plankton changed dramatically in the late 1980s, is now widely accepted (Lees et al., Reference Lees, Pitois, Scott, Frid and Mackinson2006).
With information on the abundance of each taxon at a station, estimated from at least 5 replicate samples and in 35 of the last 36 years, the main lesson that emerges is that the system does not appear to be tightly controlled by any single driver. Rather the system seems to undergo periodic shifts; these primarily involve a redistribution of the species already present rather than any large scale invasion. Disturbance, ecological and/or physical (by fishing) clearly has played a role in the dynamics of this system, but there are also influences of organic influx (and hence ecological coupling to the pelagic system and the potential for eutrophication/water quality effects) and climate. The similarity in the temporal trends shown by these factors, which is in part due to their coupling, makes disentangling their relative contributions using field studies problematic. Our current understanding of the atmosphere only allows reliable short term forecasting. Our understanding of offshore benthos may also be approaching a point where we can make some short term predictions, but the complexity of the system, and the multiplicity of drivers demonstrated here, make the development of predictive tools that could operate in the time frames desired by policy makers and environmental managers (5–7 years) unlikely (Frid et al., Reference Frid, Paramor and Scott2005, Reference Frid, Paramor and Scott2006).
ACKNOWLEDGEMENTS
The authors are massively indebted to Jack Buchanan for starting it all. We would also like to gratefully acknowledge the contributions of David John at the Sir Alistair Hardy Foundation for Ocean Science (SAHFOS) who extracted the CPR ‘greenness’ data, Stuart Rogers and Peter Robinson at CEFAS who provided an update to the fishing intensity data and John Kennedy at the UK Meteorological Office who extracted the winter SST series for us. We would also like to thank the master and crew of the RV ‘Bernicia’, Robin Clark, Kirsty Nicholas, Kirsty Harwood, Julie Bremner, Odette Paramor, colleagues at the Dove Marine Laboratory and Alan and Joe at ‘the Bay’. We acknowledge the financial support at various times of DEFRA, DETR, DOE, NERC, Northumbria Water plc and the Universities of Newcastle and Liverpool. The manuscript was improved as a result of comments from the two referees and the editorial team; we gratefully acknowledge their help.