Introduction
In 1893, Frederick Jackson Turner proposed that America’s Western frontier was an economic ‘safety-value’ – a place where immigrants relocated when conditions in eastern states and Europe crystallized against their upward economic and social mobility (Turner, Reference Turner1893; Senning et al., Reference Senning, Danenhower, Jennings and Buckner1914, pp. 11–13; Turner, Reference Turner1920, p. 277–280). However, as seminal hypotheses must endure, the Turner Hypothesis has come under recent scrutiny from studies that suggest conditions on the Great Plains deteriorated with economic development (Libecap & Hansen, Reference Libcap and Hansen2002, pp. 87–88; Hansen & Labecap, Reference Hansen and Libecap2004, pp. 670–674, 686; Hansen & Libecap, Reference Hansen and Libecap2004, p. 127). The Turner Hypothesis addresses material conditions; however, net nutrition and disease go through various transitions that reflect economic and biological conditions. Net nutrition on the Great Plains varied with agricultural productivity, technological innovations and large in-migrations from eastern states and Europe. This study, therefore, uses late 19th and early 20th century Great Plains net nutrition to assess whether the Turner hypothesis is robust with respect to net nutrition.
Average stature reflects the net cumulative difference between calories consumed and calories required for work and to withstand the physical environment. Body mass index (BMI) is weight in kilograms divided by height in metres squared and may reflect net current changes in the same variables (Fogel, Reference Fogel1994). However, interpreting BMI variation is more problematic than interpreting stature variation because BMI is the ratio of current to cumulative net nutrition, and the two have opposite effects when evaluating net nutrition (Carson, Reference Carson2015c). For example, BMIs are high when weight in the numerator is high or height in the denominator is low. Furthermore, an individual who receives insufficient nutrition in their youth reaches a shorter stature with lower metabolism, and has a higher BMI in later life (Mifflin et al. Reference Mifflin, Jeor, Hill, Scott, Daugherty and Koh1990; Fogel, Reference Fogel1994; Schnieder, Reference Schneider2017). As the ratio of weight to height, BMI represents the lagged or mismatched effect of the timing of privation and may not be as good a measure of current net nutrition as weight after controlling for height (Gluckman et al., Reference Gluckman, Hanson and Beedle2006, p. 10; Carson, Reference Carson2015b; Schnieder, Reference Schneider2017, p. 7; Carson, Reference Carson2017). Subsequently, BMI is an established measure for mortality risk, whereas weight after controlling for height is an alternative measure for current net nutrition. BMI is related to health (Waaler, Reference Waaler1984), and life expectancy is lower and mortality risk higher for BMIs below 18.5. Life expectancy is high and mortality risk low for BMIs between 18.5 and 27, but increases for BMIs above 27 (Fogel, Reference Fogel1994, pp. 375–377; Koch, Reference Koch2011). Costa (Reference Costa1993) showed that Waaler’s results hold for historical populations, and Jee et al. (Reference Jee, Jee, Sull, Lee, Ohrr, Guallar and Samet2006, pp. 780, 785–786) demonstrated the relationship was similar across ethnic status. Height, BMI and weight also vary with economic development, and each are used here to assess late 19th and early 20th century net nutrition on the American Great Plains (Cochrane, Reference Cochrane1979, pp. 24–32, 69–77; Carson, Reference Carson2013a; Carson, Reference Carson2013b; Zehetmeyer, Reference Zehetmayer2013; Dirks, Reference Dirks2016).
The Great Plains is important in economic studies because various factors prevailed simultaneously as development occurred. The antebellum paradox is the proposition that average statures decreased during the 19th century’s second and third quarters at the same time that wages and incomes monotonically increased (Lebergott, Reference Lebergott1984; Komlos, Reference Komlos1987; Atack et al. Reference Atack, Bateman and Parker2000, p. 261; Olmstead & Rhode, Reference Olmstead and Rhode2006, Tables Da24 and Da25; Bogart, Reference Bogart2009). Geographic regions within the US developed at uneven rates, and because eastern states and Europe developed before the Great Plains, their net nutrition, stature and BMI experienced disproportionate biological stress compared with other regions within the US. Alternatively, as agricultural conditions improved, net nutrition on the Great Plains may have improved as economic development and technologies took root, and the agricultural sectors became more efficient with scale (Atack et al. Reference Atack, Bateman and Parker2000, p. 261; Olmstead & Rhose, Reference Olmstead and Rhode2006, Tables Da24 and Da25; Carson, Reference Carson2010). Political and social developments were related to conditions in output and agricultural markets, and four broad explanations have been offered to explain the net nutritional deterioration in the late 19th and early 20th centuries (Haines, Reference Haines2004, pp. 251–252): a transportation revolution and accompanying agricultural commercialization; a growing dependence on wage labour at the same time that wealth and income inequality increased; a deteriorating disease environment (Komlos, Reference Komlos1987; Steckel, Reference Steckel2000; Coelho & McGuire, Reference Coelho and McGuire2000; McGuire & Coelho, Reference McGuire and Coelho2011); and rapid urbanization that was not accompanied by a corresponding growth in public health and sanitation systems (Ferrie & Troesken, Reference Ferrie and Troesken2008). Therefore, the Great Plains is an ideal environment to assess the relative effects of nutritional stress during economic development.
Economic development on the Great Plains
The Great Plains is the flatland prairie that lies west of the Mississippi River and east of the Rocky Mountains. The region was acquired with the Louisiana Purchase when Napoleon and France – desperate for cash – sold their New World interests to the Jefferson Administration and young United States. The region’s distinct economic features were its size, central river basins, military expeditions and location within the US. The Missouri and Mississippi River Basins were fundamental to the Great Plains’ economic development. Originating in Montana’s Rocky Mountains, the Missouri flows east across Wyoming, Colorado, the Dakotas and Nebraska to drain into the Mississippi just north of Saint Louis. The Mississippi is North America’s longest river, originates in Minnesota, and affects 40% of North America’s water drainage from 31 states before emptying into the Gulf of Mexico. In combination, the Missouri and Mississippi Rivers defined much of the 19th century Great Plains’ geography and economic development, and were used as low-cost transportation networks to transport goods and peoples to the US interior (Taylor, Reference Taylor1962; US Bureau of the Census, 1975).
Between 1804 and 1806, Thomas Jefferson sent explorers Merriweather Lewis and William Clark to explore the Missouri River Basin and find the Northwest Passage to the Pacific. French-Canadian trappers were the first Europeans to inhabit the Mississippi River Basin and used the rivers as a low-cost transportation route to ship their furs to eastern states and European markets. An important part of US transportation and agriculture, the Great Plains is divided into tall-, mixed- and short-grass prairies. Tall-grass prairies receive between 30 and 35 inches of rainfall per year. Rich in plant cover, these tall-grass prairies once had grasses that reached two metres in height; however, with economic development, few of these tall-grass prairies remain. The tall-grass prairies sustained millions of American Bison, and with this mobile protein source was home to numerous indigenous groups and later domesticated cattle (Steckel & Prince, Reference Steckel and Prince2001; Prince & Steckel, Reference Prince and Steckel2003). The Great Plains’ mixed-grass prairies lie to the west of the tall-grass prairies, receive between 20 and 25 inches of rainfall per year, and were settled with small household farms that supported wheat and corn production (Atack & Bateman, Reference Atac and Bateman1987; Olmstead & Rhode, Reference Olmstead and Rhode2006, Tables Da24 and Da25; Olmstead & Rhode, Reference Olmstead and Rhode2008, pp. 17–97). Further to the west, short grasses dominate, precipitation decreases to less than 20 inches per year, and during the late 19th century, the western Great Plains supported large beef-producing enterprises. These prairie grasslands created a productive agricultural region that specialized in wheat and corn production but were self-sustaining and created surpluses in beef and animal proteins (Atack & Bateman, Reference Atac and Bateman1987; Atack et al., Reference Atack, Bateman and Parker2000, p. 261; Olmstead & Rhodes, Reference Olmstead and Rhode2008).
For most of the late 19th and early 20th centuries, land acts and railroads affected the Great Plains’ settlement patterns. The Land Ordinance of 1785 quartered off 640 acre sections that were sold for $US1 per acre. Various land acts followed until the Homestead Act of 1862 allowed settlers to acquire 160 acres for $US1.25 per acre, which transferred the public domain into the private sector. By 1852, the Illinois and Michigan canal was a transportation route that connected the Great Plains to Lake Michigan and the Mississippi River, and the Michigan Central Railroad was the first railroad to connect Chicago to the eastern states (Senning et al., Reference Senning, Danenhower, Jennings and Buckner1914, p. 14). By 1863, the Central Pacific Railroad (CPRR) started east from Sacramento using mostly Chinese immigrant labour (Carson, Reference Carson2005), and in 1865, the Union Pacific Railroad (UPRR) started west from Omaha using Irish immigrants and ex-Confederate Civil War veterans. To generate revenue, the railroads recruited settlers to the West from eastern states and Europe, offering them land for between $US2 and $US10 per acre (Cochrane, Reference Cochrane1979, pp. 8485).
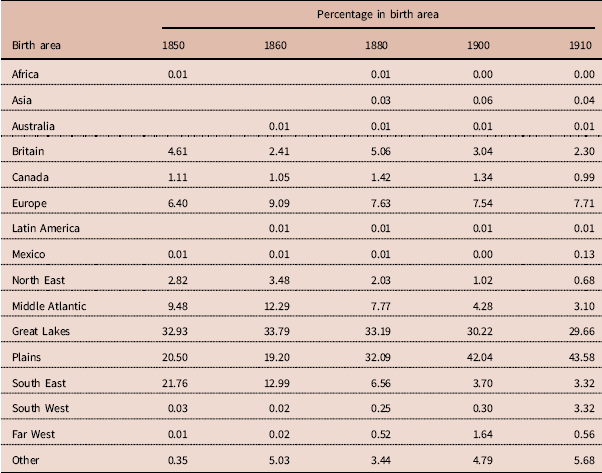
During much of the late 19th and early 20th centuries, the Great Plains was an agricultural region where grains and beef were produced and shipped to eastern and European markets for household consumption. Throughout its initial development, the Great Plains was sparsely populated, and increasing immigration soon populated large tracks of lands that were transformed into productive farmlands with varying degrees of agricultural success (Atack & Bateman, Reference Atac and Bateman1987, pp. 186–200; Carson, Reference Carson2010). Using Integrated Public Use Microdata, Table 1 demonstrates that Plains nativity decreased in the mid-19th century among the general population as immigrants streamed onto the Great Plains to take advantage of inexpensive land and increasing agricultural opportunity. That migration continued and incomes on the Plains increased indicates the Plains attracted migrants (Easterlin, Reference Easterlin1971, p. 47, Table 5). Technological innovations were fundamental to the region’s economic development, and the reaper, steel plough, barbed wire and refrigeration increased agricultural productivity (Cochrane, Reference Cochrane1979, pp. 194–195; Craig et al., Reference Craig, Goodwin and Grennes2004, pp. 328–333; Federico, Reference Federico2013, pp. 160–161). Compared to elsewhere within the US, farmers on the Great Plains rapidly adopted technologies and increased the number of acres devoted to corn and became among the most productive corn- and wheat-producing regions (Griliches, Reference Griliches1971, p. 208; Hilliard, Reference Hilliard1972, p. 166; Olmstead & Rhode, Reference Olmstead and Rhode2008, pp. 71–86). By the 1920s, new biotechnologies were in development that included fertilizers, herbicides and genetically modified plant varieties (Atack & Bateman, Reference Atac and Bateman1987, pp. 186–188). Subsequently, late 19th and early 20th century Great Plains’ economic development was related to its prominent river basins, early US explorations and transportation revolutions, which were related to net nutrition on the Great Plains.
Percentage distribution of individuals from the Great Plains by birth area using national dataa

a Data source: Ruggles et al. (Reference Ruggles, Flood, Goeken, Grover, Meyer, Pacas and Sobek2018), Integrated Public Use Microdata.
The following geographic classification scheme is consistent with Carlino and Sill (Reference Carlino and Sill2001): New England=CT, ME, MA, NH, RI and VT; Middle Atlantic=DE, DC, MD, NJ, NY, and PA; Great Lakes=IL, IN, MI, OH and WI; Plains=IA, KS, MN, MO, NE, ND and SD; South East=AL, AR, FL, GA, KY, LA, MS, NC, SC, TN, VA and WV; South West=AZ, NM, OK and TX; Far West=CA, CO, ID, MT, NV, OR, UT, WA and WY.
Late 19th and early 20th century Great Plains BMI, weight and height data
The data used to study the Great Plains’ net nutrition were part of a large 19th century prison data extraction project. All US prisons were contacted on multiple occasions, and available state prison records were acquired and entered into a master file. Prison records for the Great Plains were for the Colorado, Illinois, Missouri, Montana and Nebraska prisons. Prison records included Arizona, California, Colorado, Idaho, Illinois, Kansas, Kentucky, Maryland, Mississippi, Missouri, Montana, Nebraska, New Mexico, Ohio, Oregon, Pennsylvania, Philadelphia, Tennessee, Texas, Utah and Washington. Between 1871 and 1944, there were 61,345 males in the Great Plains with complete age, height, weight, nativity, residence and pre-incarceration occupations. Physical characteristics recorded by prison enumerators at the time of incarceration, and therefore reflecting pre-incarceration conditions, were used to evaluate changing net nutrition as development occurred. During this pre-photographic period, physical descriptions were recorded in detail as a means to identify individuals in case they escaped and were recaptured. Physical descriptions were also used to identify individuals within prisons.
Because institutions that randomly collected data were yet to develop, all historical data have various biases that reflect the purposes for which they were collected. The two most common sources for historical weight and height data are military and prison records. While plentiful, 19th century military records reflect socioeconomic conditions among the upper class, who had minimum stature requirements for service (Sokoloff & Villaflor, Reference Sokoloff and Villaflor1982, pp. 456–458; Komlos Reference Komlos1987; Coclanis & Komlos, Reference Coclanis and Komlos1995, p. 93; Ellis, Reference Ellis2004, p. 27). However, because military recruits were rejected for short statures, it may understate military BMIs because height is inversely related to BMI, and disproportionately taller individuals remained in military records.
Prison records do not suffer from this truncation bias and may better reflect conditions among lower socioeconomic groups (Komlos & Carson, Reference Komlos and Carson2017, p. 138, footnote 5). Like military records, prison data are not random but contain valuable information in net nutrition studies, such as conditions among lower socioeconomic groups, who were more vulnerable to economic change (Floud et al., Reference Floud, Fogel, Harris and Hong2011, p. 62). There are, however, concerns with prison records. For example, if law enforcement trained recruits to target taller individuals in physical assault crimes, taller individuals may have been more likely to be incarcerated in prison records (Komlos & Carson, Reference Komlos and Carson2017, p. 141). Alternatively, prison records may be more likely to represent conditions among the poor and working class who turned to crime out of privation. Stature measures cumulative net nutrition throughout the growth period, and if incarceration was related to material wealth, prison records may reflect shorter individuals who were unable to afford legal counsel at trial (Carson, Reference Carson2010). There is also a recent challenge to the established result that US statures decreased during the 19th century’s second and third quarters due to sample selection; this remains unsettled in the literature (Bodenhorn et al., Reference Bodenhorn, Guinnane and Mroz2014). Nevertheless, this revised view may itself suffer from sample-selection biases and does not account for various sources that show health and net nutrition deteriorated with urbanization and development (Komlos & A’Hearn, Reference Komlos and A’Hearn2016; Zimran, Reference Zimran2017, p. 31; Komlos & A’Hearn, forthcoming; Komlos, forthcoming). Recent criticisms to the antebellum paradox also do not account for the well-established interdisciplinary evidence that illustrates urban statures were shorter and decreased with the separation of food consumption from production (Nicholas & Oxley, Reference Nicholas and Oxley1993, p. 734; Davidson et al. Reference Davidson, Rose, Gutman, Haines, Condron and Condran2002, p. 268; Steckel & Rose, Reference Steckel and Rose2002, p. 575; Haines et al., Reference Haines, Craig and Weiss2003, pp. 398–407; Carson, Reference Carson2008, p. 368; Zehetmayer, Reference Zehetmayer2011). Statures were also shorter in geographic regions with higher diseases rates (Coelho & McGuire, Reference Coelho and McGuire2000; p. 239–243; Haines et al., Reference Haines, Craig and Weiss2003), and nutrition and disease are essential explanations in the antebellum paradox (Floud et al., Reference Floud, Fogel, Harris and Hong2011, p. 11). Subsequently, prison records are a valuable source to examine 19th century BMI, height and weight records that reflect conditions on the Great Plains.
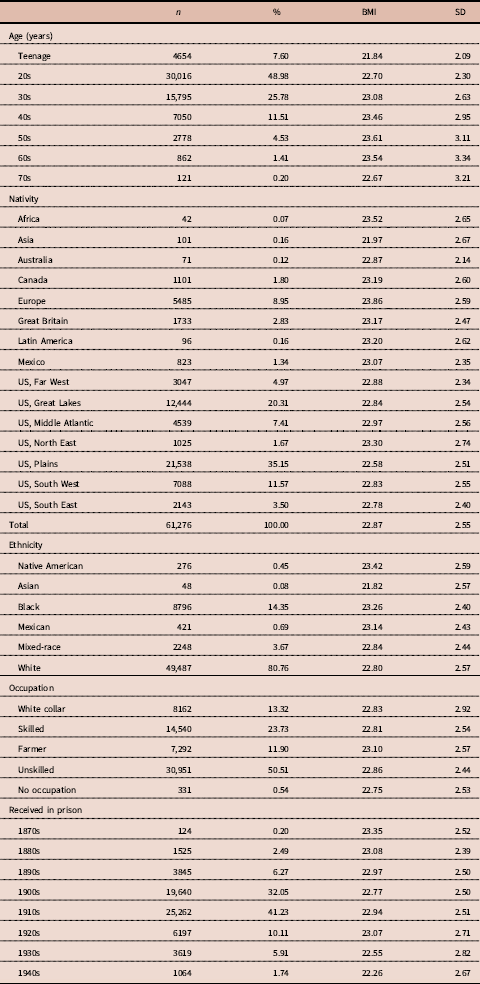
Table 2 shows the descriptive statistics of the study sample. During the late 19th and early 20th centuries, prison enumerators recorded complexions, which were used in this study to classify race. Individuals of African descent were recorded as black, light-black, dark-black, chocolate, copper and various shades of mulatto. Individuals of European decent were recorded as fair, white, medium or dark. These European complexions are further supported because inmates of European ancestry in US prisons were also recorded with the same fair, white, medium and dark complexions. In both the federal census and in prison records, persons of mixed African and European ancestry were referred to as ‘mulatto’. However, in the results that follow, persons of mixed African and European descent were referred to as ‘mixed-race’. Native Americans were recorded as ‘Indians’, and individuals of European and Native Mexican ancestry were recorded as ‘Mexican’ (Carson, Reference Carson2018a). An individual of mixed European and indigenous Mexican ancestry was classified as Mexican Mestizo (Carson, Reference Carson2018a). There were also individuals from China, Japan and Korea on the Great Plains who were classified as Asian. Because individuals of African and European descent are the largest part of the Great Plains’ population, their biological conditions were the primary focus of this study.
Descriptive statistics of men from the Great Plains in the late 19th and early 20th centuries, N=61,276

Sources: Colorado State Archives, 1313 Sherman Street, Room 120, Denver, CO 80203; Illinois State Archives, Margaret Cross Norton Building, Capital Complex, Springfield, IL 62756; Missouri State Archives, 600 West Main Street, Jefferson City, MO 65102; Montana State Archives, 225 North Roberts, Helena, MT, 59620; Nebraska State Historical Society, 1500 R Street, Lincoln, Nebraska, 68501.
In the late 19th and early 20th centuries, occupations were the primary means of classifying socioeconomic status, and five occupation categories were used to classify socioeconomic status: white-collar workers, skilled workers, farmers, unskilled workers and persons with no listed occupation. Bankers, merchants and ministers were classified as white-collar workers. Craft workers, butchers and tailors were classified as skilled workers. Ranchers, dairymen and farmers were classified as farmers. Cooks and labourers were classified as unskilled workers. A final category was used for individuals who recorded no occupation or reported no discernable occupation to prison enumerators.
As they are today, prisoners were a younger segment of the population compared with the general population (Table 2; Wilson, Reference Wilson1975, p. 232; Hirshchi & Gottfredson, 1983; Gottfredson & Hirshchi, Reference Gottfredson and Hirshchi1990, pp. 128–144; Freeman, Reference Freeman1999; Carson, Reference Carson2009a). About half of the Plains sample were in their 20s and another 30% in their teens and 30s. Only 35% were native to the Great Plains, indicating the region was an area of high in-migration (Table 2; Senning et al., Reference Senning, Danenhower, Jennings and Buckner1914, pp. 11–13; Easterlin, Reference Easterlin1971, p. 40–43). The most common internal US immigrants were from the Great Lakes, yet there were considerable shares from the South West and Middle Atlantic (Steckel, Reference Steckel1983b). The most common international immigrants were from Continental Europe, followed by Britain, Canada and Latin America, primarily Mexico. Whites were the most common ethnic group, followed by blacks and mixed-race individuals. Unskilled workers were the most common socioeconomic group, demonstrating prisoners were more likely to be from lower socioeconomic groups. There were individuals who were received as early as the 1870s and as late as the 1940s, and individuals born between 1830 and 1920s.
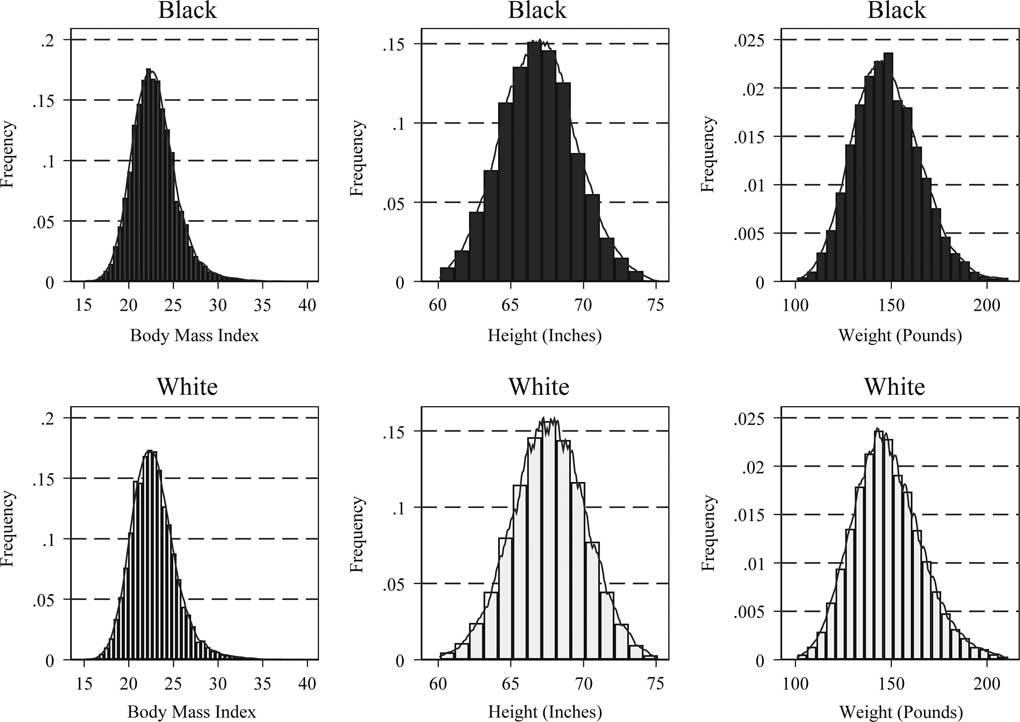
Because of the effects of disease and modern obesity, it is not clear how historical BMIs and health align with modern standards (Floud et al. Reference Floud, Fogel, Harris and Hong2011). BMI, height and weight distributions offer valuable insight into net nutrition, and 19th century black and white distributions were reasonably symmetric, indicating Great Plains’ residents neither had an excess of, nor deficiency in calories relative to claims from work and the physical environment (Fig. 1). In contrast to modern distributions, the majority of black and white BMIs on the 19th century Great Plains were in normal categories, and workers were neither stunted nor obese (Fig. 1; Fogel, Reference Fogel1994, p. 378; Carson, Reference Carson2009b, Reference Carson2012c; Flegal et al. Reference Flegal, Carroll and Ogden2010). Average black BMI was 23.26; average white BMI was 22.80. As elsewhere throughout the US, individuals were unlikely to be underweight. Only 1.19% of blacks and 2.50% of whites were underweight. Most individuals were in normal weight categories, and 77.44% and 79.84% of blacks and whites, respectively, were in the normal category. Only 21.27% of blacks and 18.1% of whites were overweight or obese. However, while blacks had greater average BMIs and were more likely to be overweight and obese, it does not indicate they were in better physical condition because they were shorter than whites, and BMIs are inversely related to height (Carson, Reference Carson2009b, Reference Carson2012b; Komlos & Carson, Reference Komlos and Carson2017). Individuals with darker complexions also have more protein in their muscle tissue, and for the same tissue volume, muscle is heavier than fat (Aloi et al. Reference Aloia, Vaswani, Ma and Flaster1997; Barondess, Reference Barondess, Nelson and Schlaen1997; Wagner & Heyward, Reference Wagner and Heyward2000).
Late 19th and early 20th century BMIs, heights and weights using Integrated Public Use Microdata (see Table 1). While height is reported in centimetres for the regression models, heights were reported in inches in US prisons.
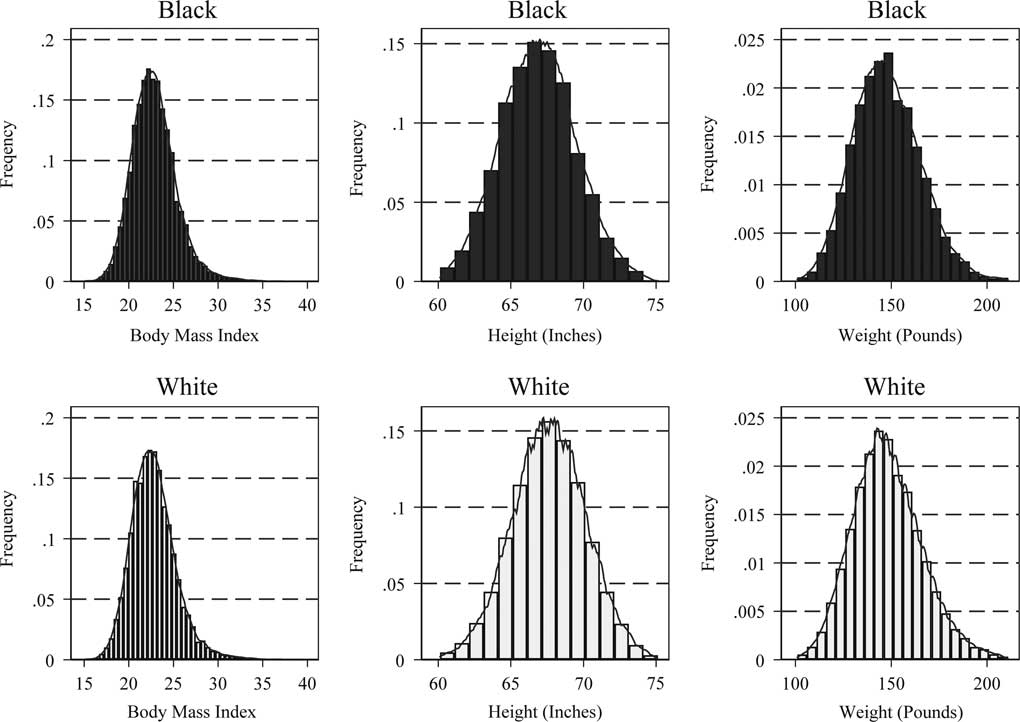
Great Plains’ height and weight distributions are also insightful (Fig. 1). Average black and white heights were 169.81 and 171.81 cm, respectively. Average black weight was 148.01 pounds, while average white weight was 148.46 pounds, indicating that blacks were short and heavy, and whites had about the same weights but were taller. In sum, late 19th and early 20th century black and white males on the Great Plains were in healthy, normal ranges, and health on the Great Plains that was poor by modern standards was probably not related to BMI (Floud et al. Reference Floud, Fogel, Harris and Hong2011).
Effects of socio-demographic variables on Great Plains net nutrition
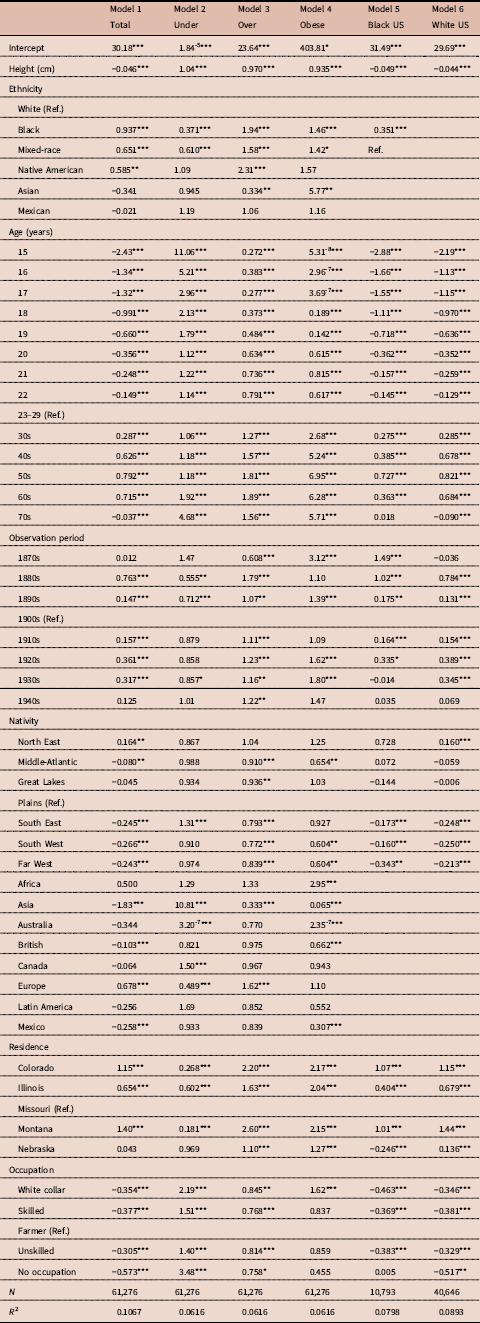
The timing and extent of BMI variation reflects how biological conditions vary by ethnic status, demographics, socioeconomic conditions and place of residence. The BMI classifications were evaluated with multinomial regression models, and coefficients reported as odds ratios of being in the underweight, overweight and obese BMI categories relative to the normal weight category. Least-squares height and weight models were used to evaluate cumulative and current net nutrition. The multinomial BMI model was given by:
 $$\eqalignno{ & \log \left( {{{p_{j} } \over {p_{{Normal}} }}} \right){\equals}\theta _{0} {\plus}\theta _{c} Centimetres_{i} {\plus}\mathop{\sum}\limits_{r{\equals}1}^5 {\theta _{r} Ethnicity_{y} } {\plus}\mathop{\sum}\limits_{a{\equals}1}^{13} {\theta _{a} Age_{i} } {\plus}\mathop{\sum}\limits_{t{\equals}1}^7 {\theta _{t} Observation\,Period_{i} } \cr & \quad {\plus}\mathop{\sum}\limits_{n{\equals}1}^{14} {\theta _{n} Nativity_{i} } {\plus}\mathop{\sum}\limits_{l{\equals}1}^4 {\theta _{i} Residence_{i} } {\plus}\mathop{\sum}\limits_{j{\equals}1}^6 {\theta _{j} Occupation_{i} } {\plus}{\varepsilon}_{i} $$
The least-squares height model was given by:
 $$\eqalignno{ & Centimetres_{i} {\equals}\theta _{0} {\plus}\mathop{\sum}\limits_{j{\equals}1}^5 {\theta _{j} Ethnicity_{t} {\plus}\mathop{\sum}\limits_{a{\equals}1}^{13} {\theta _{a} Age_{i} } } {\plus}\mathop{\sum}\limits_{t{\equals}1}^7 {\theta _{t} BirthPeriod_{i} {\plus}\mathop{\sum}\limits_{n{\equals}1}^{14} {\theta _{n} Nativity_{i} } } \cr & \quad {\plus}\mathop{\sum}\limits_{l{\equals}1}^4 {\theta _{l} Residence_{i} {\plus}} \mathop{\sum}\limits_{j{\equals}1}^6 {\theta _{j} Occupation_{i} } {\plus}{\varepsilon}_{i} $$
The least-squares weight model was given by:
 $$\eqalignno{ & Weight_{i} {\equals}\theta _{0} {\plus}\theta _{c} Centimetres_{i} {\plus}\mathop{\sum}\limits_{r{\equals}1}^5 {\theta _{r} Ethnicity_{i} {\plus}\mathop{\sum}\limits_{a{\equals}}^{13} {\theta _{a} Age_{i} {\plus}\mathop{\sum}\limits_{t{\equals}1}^7 {\theta _{t} Observation\,Period_{i} } } } \cr & \quad {\plus}\mathop{\sum}\limits_{n{\equals}1}^{14} {\theta _{n} Nativity_{i} } {\plus}\mathop{\sum}\limits_{l{\equals}1}^4 {\theta _{l} Residence_{i} } {\plus}\mathop{\sum}\limits_{j{\equals}1}^6 {\theta _{j} Occupation_{i} {\plus}{\varepsilon}_{i} } $$
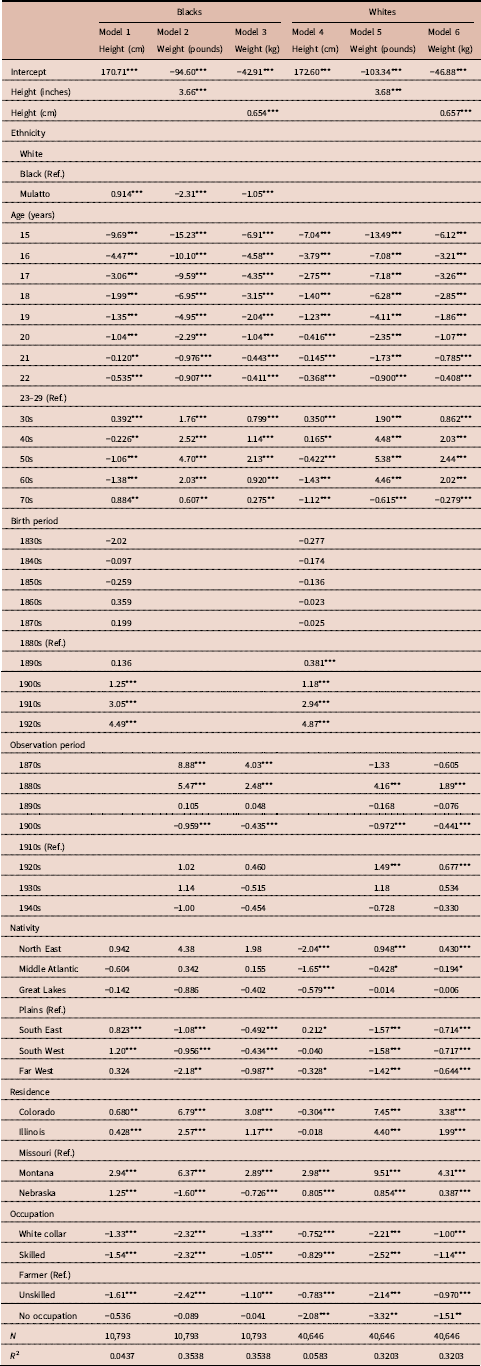
Stature (in centimetres) was included to test the inverse relationship between BMI and cumulative net nutrition (Carson, Reference Carson2009b, Reference Carson2012c). Complexion dummy variables were included to assess how BMI varied by ethnic status. Youth age dummy variables were included for ages 15–22, and adult age decade dummy variables were included for ages 30–70. Observation decade variables were included to assess how BMI and weight varied between 1870 and 1940. Birth decade dummy variables were included in the height regression to illustrate how height varied for birth between the 1830s and 1920s. United States nativity dummy variables were included for place of birth (‘nativity’) from the North East, Middle Atlantic, Great Lakes, South East, South West and Far West. International nativity variables were included for birth in Asia, Great Britain, Europe and Latin America. Plains residence dummy variables were included to measure regional access to nutrition. Occupation dummy variables were included to account for socioeconomic status and physical activity.
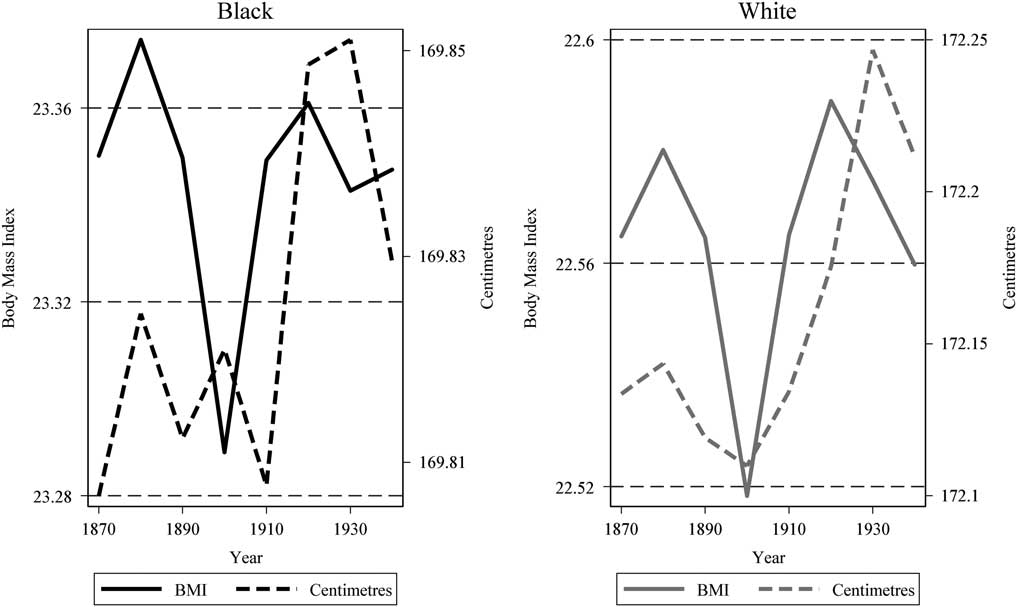
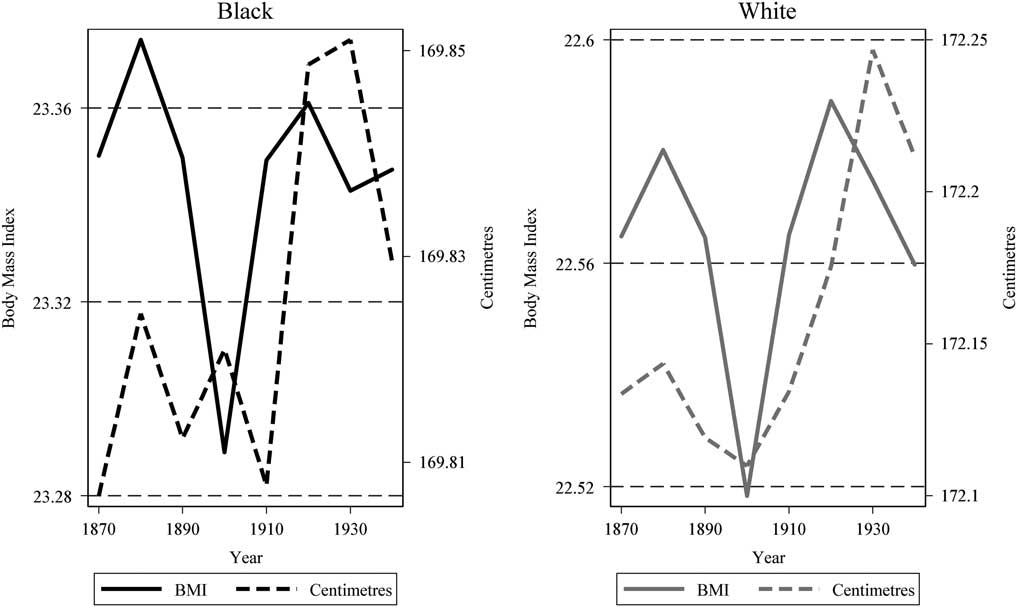
Three paths of inquiry have been considered when evaluating net nutrition on the Great Plains. First, in 1893, Frederick Jackson Turner proposed that the Great Plains served as a ‘safety valve’ – a place where migrants escaped the rigid economic and social strictures that prevented their upward economic mobility in the eastern states and Europe (Turner, Reference Turner1893; Senning et al. Reference Senning, Danenhower, Jennings and Buckner1914, p. 13). However, the Turner Hypothesis has faced recent criticism from Libecap and Hansen (Reference Libcap and Hansen2002, p. 88) and Hansen and Libecap (Reference Hansen and Libecap2004, p. 127), who suggested that settlers on the Plains were slow to change farm sizes and crop mixes in response to changes in weather patterns and information asymmetries. If this was the case, height, BMI and weight should have decreased with settlement (Tables 3 and 4, and Fig. 2), and if recent criticisms of the Turner Hypothesis are correct, current and cumulative net nutrition should have decreased for individuals on the Great Plains relative to their counterparts throughout the rest of the US. However, white BMI, height and weight increased or remained constant during the late 19th and early 20th centuries (Carson, Reference Carson2015a). Black BMIs decreased mildly; however, the decrease was largely due to taller statures and improved cumulative net nutrition, indicating that black cumulative net nutrition also improved with settlement. Moreover, prison records reflect conditions among the working class, and populations with lower income and wealth were more vulnerable to changes in material and net nutritional variation (Steckel, Reference Steckel1983a; Carson, Reference Carson2010; Carson & Hodges, Reference Carson and Hodges2014).
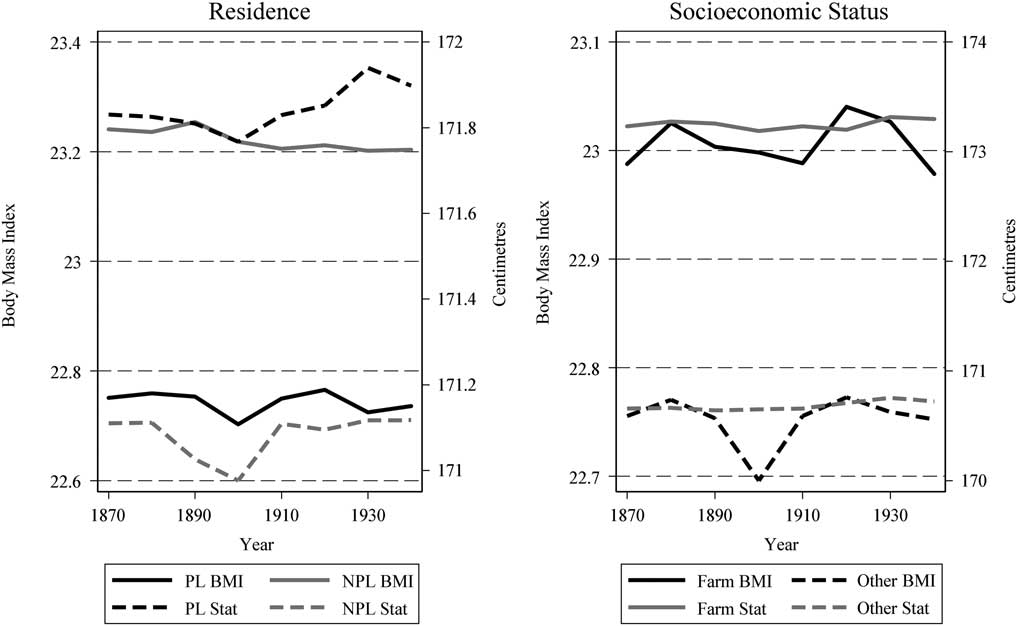
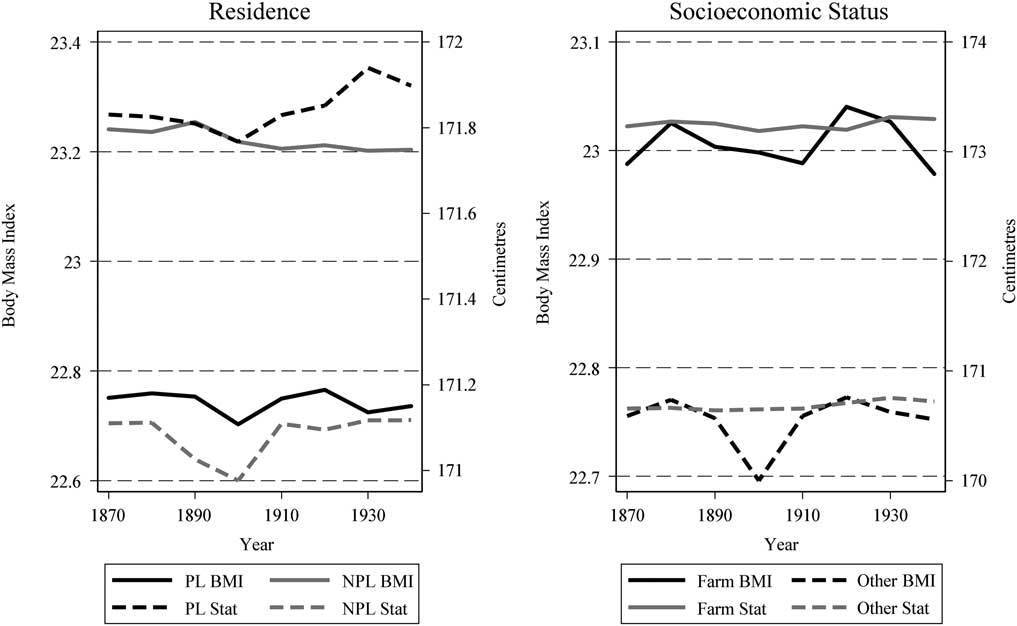
BMIs and heights by place of residence – Plains (PL) or non-Plains (NPL) – and socioeconomic status, 1870–1940. Source: regressions not reported here using data from Table 1. The Plains observations are for Great Plains observations presented in this paper. Non-Plains observations are for prisoners from non-Plains prisons. Farm: farmers born in the United States; Other: non-farmers born in the United States. Farmers and non-Farmers are for observations in Plains states in Table 1. Non-Farmers are listed as ‘Other’ in Table 1.
Least squares and multinomial regression of BMI by socio-demographic characteristics in the late 19th and early 20th centuries

Source: data in Table 1.
Models 1, 5 and 6 are estimated with least squares. Models 2–4 are a single multinomial model where the normal BMI is assigned as the base outcome.
***α=0.01; **α=0.05; *α=0.10. Robust standard errors clustered on age.
Late 19th and early 20th century US-born heights and weights by socio-demographic characteristics in the late 19th and early 20th centuries

Source: data in Table 1.
***α=0.01; **α=0.05; *α=0.10. Robust standard errors clustered on age.
To further assess how net nutrition varied by residence and socioeconomic status on the Great Plains, the sample was partitioned by residence at the time of measurement and occupations. Figure 2’s residence panel presents the Great Plains’ average BMI and height in centimetres compared with residents in non-Plains states. If recent criticisms of the Turner Hypothesis are correct, the Plains’ average BMIs and statures should have decreased over time. While the Plains’ BMIs decreased mildly during the 1890s, the decrease was short-lived and smaller than the 1890 BMI decrease relative to residents in non-Plains states (Carson, Reference Carson2016). Moreover, Plains’ average stature increased after 1890 while residents in non-Plains states experienced a considerable stature decrease, indicating that the Plains’ cumulative and current net nutrition increased relative to that of other regions.
Second, Great Plains’ net nutrition was related to socioeconomic status, and the majority of late 19th century workers were in agriculture, if only for transportation and to maintain the household (Rosenbloom, Reference Rosenbloom2002, p. 88; Dimitri et al., Reference Dimitri, Effland and Conklin2005). Agricultural occupations are an additional measure to test the Turner Hypothesis because if recent challenges are correct, Great Plains’ agricultural workers made systematic errors and were slow to adjust farm sizes and crop mixes in response to changing environmental conditions. If agricultural and material conditions on the Plains deteriorated, farmers’ net nutrition should have decreased more on the Plains over time relative to that of workers in other occupations (Carson, Reference Carson2012a). Net nutrition by socioeconomic status illustrates that farmer BMIs decreased less between 1880 and 1900 than the BMI decrease for workers in other occupations, and both were stagnant between the 1870s and 1940s (Fig. 3). Moreover, farmers were over 2 cm taller than workers in other occupations and had between 0.300 and 0.370 higher BMI values compared with workers in other occupations. To compare how Great Plains farmers’ BMIs compared with those of farmers elsewhere within the US, Carson (Reference Carson2009b, Reference Carson2012c) showed that agricultural workers at the national level and in Texas had BMIs between 0.200 and 0.205 units higher than workers with no occupation, indicating that rather than a net nutritional disadvantage, Great Plains farmers’ BMI values were greater than those of other workers in the US and other workers within the Great Plains. Alternatively, white-collar and skilled workers had lower BMIs than agricultural workers and were more likely to be underweight (Tables 3 and 4). If net nutrition on the Great Plains decreased with settlement, farmers – those most vulnerable to agricultural variation – should have experienced net nutritional privation compared with workers in other occupations. However, Great Plains’ BMI, height and weight were greater than workers in other occupations and were comparable to, or exceeded, those of farmers in other regions of the US.
Third, Steckel (Reference Steckel1979, p. 374) demonstrated that whites were taller than African-Americans, and Bodenhorn (Reference Bodenhorn2002, pp. 23, 30 and 43) suggested that much of the stature difference was due to social preferences that disproportionately favoured individuals with fairer complexions. If social preferences were a primary explanation for better net nutrition, individuals on the Great Plains with fairer complexions should have had higher BMIs, taller statures and heavier weights than individuals with darker complexions. Carson (Reference Carson2008 and Reference Carson2009a) illustrated that individuals with fairer complexions may have been taller because of greater vitamin D. However, African-Americans had greater BMIs and heavier weights than whites (Table 4), indicating that social preferences favouring individuals with fairer complexions is independently an unlikely explanation for net nutritional variation (Eveleth & Tanner, Reference Eveleth and Tanner1966; Tanner, Reference Tanner1977; Carson, Reference Carson2008, Reference Carson2015b, Reference Carson2017). Moreover, this pattern, where late 19th and early 20th century US blacks had greater BMIs and heavier weights, was common both in areas where bound and free labour were the primary labour force, indicating the type of labour system does not account for BMI differences (Carson, Reference Carson2018b). Multiple explanations could account for why 19th century whites were taller than blacks. While blacks and whites may have the ability to reach comparable average statures when brought to maturity under ideal biological conditions, optimal environments may have differed between the two groups (Carson, Reference Carson2008, Reference Carson2009a). For BMI and weight, blacks have greater bone-mineral density and a higher percentage muscle content than fat, which are associated with higher BMIs and greater weights for individuals with fairer complexions (Schutte et al. Reference Schutte, Townsent, Hugg, Malina and Blomquist1984; Wagner & Heyward, Reference Wagner and Heyward2000; Aloia et al., Reference Aloia, Vaswani, Ma and Flaster1997; Burkhauser & Cawley, Reference Burkhauser and Cawley2008).
Other patterns were consistent with expectations. Net nutrition varied by nativity, and whites from the North East US had the highest BMIs, and individuals from Missouri the lowest (Tables 3 and 4). Reflecting poor European net nutrition and better access to net nutrition after arrival, Continental Europeans had greater BMIs than other nativities because Europeans were shorter and had less space to distribute weight but received improved net nutrition after their US arrival (Table 3; Koepke & Baten, Reference Koepke and Baten2005; Koepke, Reference Koepke2016; Dirks, Reference Dirks2016, pp. 99–130). Residence within the Great Plains is also noteworthy. Cuff (Reference Cuff2005, pp. 217–218) and Zehetmeyer (Reference Zehetmayer2011) showed that statures were inversely related to urbanization and economic development. Prince and Steckel (Reference Prince and Steckel2003, p. 369) found an inverted U-shaped height by latitude gradient for Native Americans, US-born whites and European immigrants and these spatial patterns to differences in diets, work effort and disease. For the majority of Great Plains populations, communities remained rural and population densities low. Besides Chicago and Saint Louis, the late 19th and early 20th century Great Plains were rural and only in certain enclaves did industrialization and urbanization take root (Chernow, Reference Chernow2017, p. 31). In sum, despite recent challenges, the biological explanation supports the Turner Hypothesis.
Decomposing black and white biological differences on the Great Plains
Evaluating BMI, height and weight regression models indicates how net nutrition varied by ethnic status and characteristics. It does not, however, illustrate how net nutrition varied by complexion across BMI, height and weight associated with returns to characteristics versus average characteristics. A Blinder–Oaxaca decomposition is a statistical technique that separates response variable differences into returns to characteristics and average characteristics (Blinder, Reference Blinder1973; Oaxaca, Reference Oaxaca1973). To illustrate how black and white net nutrition varied by structure and composition, let γ
h
and γ
l
represent BMI, height and weight values by ethnic group. Black BMI and weight are the base category for BMI and weight, and white stature is the height base category. θ
0h
and θ
0l
are the non-identifiable net nutrition sources in the intercept. θ
1h
and θ
1l
are high and low response variable returns to characteristics.
 $$\bar{X}_{h} $$
and
 $$\bar{X}_{l} $$
are high and low average characteristic matrices. The coefficient vectors and characteristic matrices are expressed in equations (4) and (5).
 $${\rm High}\,{\rm response}\,{\rm variable}\,\colon\,\gamma _{h} {\equals}\theta _{{0h}} {\plus}\theta _{{ih}} \bar{X}_{{1h}} $$
 $${\rm Low}\,{\rm response}\,{\rm variable}\,\colon\,\gamma _{l} {\equals}\theta _{{0l}} {\plus}\theta _{{il}} \bar{X}_{{1l}} $$
High and low response variable gaps are the difference between high and low response variables.
 $$\Delta \gamma {\equals}\gamma _{h} {\minus}\gamma _{l} {\equals}\theta _{{oh}} {\plus}\theta _{{1h}} \bar{X}_{h} {\minus}\theta _{{0l}} {\minus}\theta _{{1l}} \bar{X}_{l} $$
The counterfactual is obtained by adding and subtracting θ
ih
 $$\bar{X}_{l} $$
to the right hand side of equation (6) and collecting like terms.
 $$\Delta \gamma {\equals}\gamma _{h} {\minus}\gamma _{l} {\equals}(\theta _{{oh}} {\minus}\theta _{{0l}} ){\plus}(\theta _{{1h}} {\minus}\theta _{{1l}} )\bar{X}_{h} {\plus}\theta _{{1l}} (\bar{X}_{h} {\minus}\bar{X}_{l} )$$
Equation (7)’s first right hand side elements (θ
0h
−θ
l
) are the black and white BMI, height, and weight autonomous differences associated with non-identifiable characteristics in the intercept, such as diets and physical activity. The second right hand side element (θ
1h
−θ
l
)
 $$\bar{X}_{h} $$
is the structural difference associated with returns to characteristics such as age and occupation. The third right hand side element θ
l
(
 $$\bar{X}_{h} {\minus}\bar{X}_{l} $$
) is the black–white composition difference associated with average characteristics.
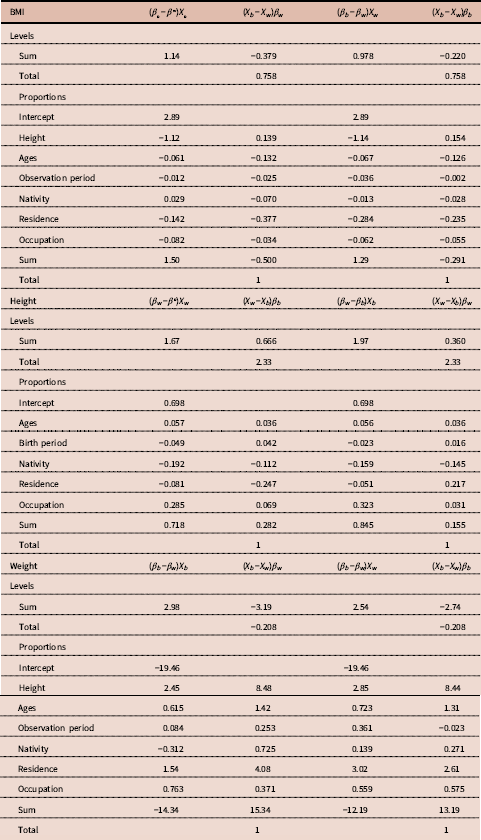
Using BMI, height and weight coefficients from Tables 3 and 4, Table 5 presents black and white net nutrition decompositions for the Great Plains. African-American BMIs were nearly one unit greater than those of whites. The large positive intercept illustrates that late 19th and early 20th century black BMIs were greater than those of whites independent of returns to and average characteristics. The black–white BMI differential varied by characteristics, and the greatest proportion of the white BMI return advantage was stature, indicating white returns to cumulative net nutrition were greater than those of blacks. Whites also had greater structural BMI returns associated with age, observation period, residence and socioeconomic status. Returns to average characteristics also favoured whites, which offset the autonomous biological effect, in part, but not completely.

For height, average characteristics explain much of the white–black stature gap. Like the black BMI advantage in the intercept, whites had a large, significant stature advantage relative to blacks (Carson, Reference Carson2008, Reference Carson2009a). Whites were also taller than blacks associated with returns to age and socioeconomic status; black structural stature returns were greater for birth period, nativity and residence. Black and white stature differences on the Great Plains were primarily due to returns rather than average characteristics. For weight, the negative autonomous intercept indicates that whites on the Great Plains had greater weights than blacks independent of observable characteristics, but the source of weight associated characteristics favoured blacks. Blacks had greater weight returns associated with height, age, observation period, residence and occupations. Whites had greater weight returns associated with nativity. Subsequently, white autonomous weights on the Great Plains were greater than those of blacks; however, blacks had greater returns with characteristics and average characteristics that offset the white weight returns advantage.
Conclusion
There is a lively debate regarding the role that the Great Plains and Western frontier had in late 19th and early 20th century US economic development. Long seen as an economic ‘safety valve’, the Turner Hypothesis has come under recent scrutiny and a new explanation is proposed where the West was not as prosperous as previously believed because settlers lacked human capital and did not accurately predict weather patterns (Libecap & Hansen, Reference Libcap and Hansen2002, pp. 88 and 92). If settlers on the Great Plains made systematic errors, lacked human capital and failed to predict climatic changes, net nutrition, income and migration should have decreased with Western settlement, and agricultural workers’ net nutrition should have been lower than that of workers elsewhere within the US. However, Great Plains’ net nutrition was constant or increased with westward settlement, and agricultural workers consistently had better net nutrition than workers in other occupations and compared favourably to workers throughout the United States. While it remains possible that quality of life, net nutrition and income took different paths along the Western frontier, income and migration from eastern states and Europe increased and remained robust. The widely observed pattern that individuals with darker complexions were shorter because of social preferences is also not well supported on the Great Plains. If whites received greater net nutrition because of social preferences, whites should have had greater BMIs and weights than blacks. However, African-Americans had greater BMIs and weights than whites in this economic and geographic region where bound-labour was not the primary labour source. The upshot is that the late 19th and early 20th century Great Plains was a thriving agricultural economy, where biological measurements were in healthy ranges, which reflected economic growth and labour market development, and African-Americans did relatively well in this developing economic region where bound-labour was not the primary labour force.
Acknowledgments
The author appreciates the comments provided by John Komlos, Lee Carson and Paul Hodges. Shahil Sharma, Chinuedu Akah, Meekam Okeke, Ryan Keifer, Tiffany Grant, Bryce Harper, Greg Davis and Kellye Manning provided research assistance.
Ethical Approval
The authors assert that all procedures contributing to this work comply with the ethical standards of the relevant national and institutional committees on human experimentation and with the Helsinki Declaration of 1975, as revised in 2008.
Conflicts of Interest
The author has no conflicts of interest to declare.
Funding
This research received no specific grant from any funding agency, commercial entity or not-for-profit organization.