1 Introduction
The birth of Web 2.0 supposed a breaking down of the barrier between the consumers and producers of information. In other words, the web changed from a static container of information into an active element in which any user, in a very simple manner, could publish any type of information. The information generated by users varies widely, from publications in blogs or other forums to simple commentaries on their state of mind in social networks. This facilitation of publication has led to the rise of several different websites specializing in the publication of users’ opinions. Some of the most well-known websites include Epinions,Footnote 1 RottenTomatoesFootnote 2 and Amazon,Footnote 3 where users express their opinions or criticisms on a wide range of topics. Opinions published on the Internet are not limited to certain specific sites, but rather can be found in a blog, forum or commercial website.
Potential consumers of a given product or service have access through the Internet to the experiences of other users, so that before acquiring the product or service they consult the opinions published in the different sites. According to a 2008 study, 81 per cent of Internet users have at least one time performed an online exploration or investigation of a product, and 20 per cent do so on a daily basis (Horrigan Reference Horrigan2008). In this study, we see that the opinions published on the Internet are not only read, but strongly influence the decisions of future consumers, as 80 per cent of users who have reviewed opinions on restaurants, hotels and other services state that these opinions significantly influenced their decisions. We can therefore conclude that opinions published on the Internet can have an important commercial impact.
Finding sources of information and monitoring their progress on the web is a very complex task due to the large number of different sources and the large volume of texts, each with their own opinions, becoming even more complicated when the opinions are not expressed explicitly. This large amount of information makes it very difficult for a human reader to find and select opinions on the Internet. For this reason, it is necessary to develop systems for automatic search, retrieval, classification and presentation of points of view. This new discipline, called opinion mining (OM) or sentiment analysis (SA), has arisen in order to solve this complex problem. SA is framed within the area of natural language processing (NLP), and can be defined as the computational treatment of opinions, feelings and subjectivity in texts (Pang and Lee Reference Pang and Lee2008).
The interest among the research community in the analysis of opinions began in 2002 with the publication of two reference studies which represent the two main approaches to tackling the problem of SA. These two strategies are the one based on the application of linguistic analysis and represented by the work of Turney (Reference Turney2002) and that on the use of machine learning techniques and epitomized by Pang, Lee and Vaithyanathan (Reference Pang, Lee and Vaithyanathan2002). Other authors prefer to refer to these two approaches as unsupervised learning and supervised learning. The current body of work attempts to exploit the advantages of both approaches and hybrid systems are proposed, these being represented by the work of Prabowo and Thelwall (Reference Prabowo and Thelwall2009). A wider study on SA can be found in Pang and Lee (Reference Pang and Lee2008), Liu (Reference Liu, Indurkhya and Damerau2010) and Tsytsarau and Palpanas (Reference Tsytsarau and Palpanas2012).
On the other hand, the most representative tools of Web 2.0 are the social networks, which allow millions of users a simple way to publish any information and share it with their network of contacts or ‘friends’. These social networks have also evolved, and some have become a continuous flow of information. A clear example is the microblogging platform Twitter.Footnote 4 Twitter publishes all kinds of information, disseminating views on many different topics: politics, business, economics and so on. Twitter users regularly publish their views on a particular news item, a recently purchased product or service, and ultimately on everything that happens around them. This has aroused the interest of the NLP research community, which has begun to study the texts posted on Twitter.
In this paper, we present a review of the relevant research developed over OM on the microblogging platform Twitter. First, we present a description of Twitter. Then we comment on issues related to the relevant sociological aspects of microblogging. Section 3 analyses the main topics investigated in the field of OM. Section 4 focuses on future trends that have emerged in the last year. Finally, in Section 5 we present the conclusion of the survey and three summary tables of the main works in SA in Twitter.
2 Twitter overview
It could be said that a microblog is a platform in which users share short messages, links to other websites, images or videos. Normally a message on a microblog is written by one person and read by a number ranging from zero to hundreds of thousands of people, which in this context are called followers. Normally each user updates their microblog personally, unless the blogs represent company profiles or political parties, in which case they are often updated by teams of community managers. Microblog users typically perform periodic updates, the most active performing multiple updates every hour, giving followers a timeline of information of interest. As with blogs, microblogs can deal with many different topics, some very personal and with a very small group of fans, and others where really interesting information is given to a large group of followers. On the contrary, we have the profiles of artists and celebrities, whose valuation is more concerned with popularity than with the information provided through its microblogging service account.
At the time of writing this summary, the main platforms that provide microblogging services are Facebook,Footnote 5 Tumblr,Footnote 6 Orkut,Footnote 7 Google+,Footnote 8 FourSquareFootnote 9 and Twitter.Footnote 10
The first publication in the Twitter microblogging service took place on 16 July 2006, and since then its growth in popularity has been such that it is even being considered as an object of study in various fields of science. To give the reader an idea of the importance of this platform, Twitter is the eighth most popular website in the world and eighth in the United States, with an average of nearly eleven million hits a day. These data can be found with a greater level of detail in the Twitter section of the Alexa website.Footnote 11 The spectacular growth in the popularity of Twitter can be seen in Figure 1, which shows that initially the number of messages per day was relatively small, and that by January 2010 the number of messages or tweets per day amounted to 50 million. This statistic was published in February 2010 in the company blog. Five months later, in June 2010, the chief operating officer of Twitter, Dick Costolo, saw the figure of 50 million as already outdated, declaring at the Conversational Media Summit of 2010 that 65 million tweets a day were being published. Just one year later, in June 2011, the official Twitter blog put the daily tweets figure at 200 million.Footnote 12 Another statistic on this social network, published on September 2011 in the official blog, is related to the number of active users who publish at least once a month, these amounting to 100 million.Footnote 13
Evolution of the number of tweets published daily.

Now, as we have seen the spectacular numbers posted by Twitter, it is time to examine the characteristics of this microblogging service. As with other microblogging services, users regularly update their status, but in this case the message is limited to a length of only 140 characters. These peculiar messages of limited size are called tweets, and in these users try to be as original as possible, or provide very relevant information to obtain a larger number of followers. The content of the tweets is varied, from very personal information that, at first, one might think is only of importance to its author, to others where there are links to pictures, videos, or websites that the author has considered interesting. In Twitter, users do not only write messages but also sometimes generate conversations among themselves; these typically arise when one user is mentioned in another's tweet. When another username appears in a tweet preceded by an @ (@ username) this is called a mention. These references are visible to all followers of the author of the tweet, but Twitter offers the possibility that the tweet can only be read by the followers the author and the user mentioned have in common, it only being necessary to start the tweet with this reference to the user.
Twitter was born with the idea that users could write small messages about their daily lives, hence the question that appeared to each user at logon ‘What are you doing?’. However, over time users have converted Twitter into a powerful tool for disseminating information. The company Twitter realized this and wanted to take advantage of the added value of disseminating information by trying to steer Twitter towards that function. For this reason, the initial question was changed to ‘What's happening?’ in order to encourage users to comment on all that was happening around them. One feature that has contributed greatly to the conversion of Twitter to a tool for disseminating information is the retweet (RT). Through this function, when a user finds a tweet interesting they retweet it and so make it visible to all their followers.
Due to the enormous amount of information flowing through Twitter, some mechanism was needed to label information- or group-related tweets, leading to the emergence of hashtags. Graphically, a hashtag is the name of a topic preceded by the # character (#topic_name), and if you click on one of them you can access all the tweets tagged with the same hashtag. These tags are generated by users spontaneously when they consider an issue sufficiently important. Those subjects that for a certain period of time have a very high number of updates, Twitter catalogues them as trending topics (TT).
The real success of Twitter is not in the huge number of registered users, or the millions of tweets that are posted daily, but in the interest generated in the business and political world. Corporations and political parties know that their customers and supporters are on Twitter, and speak well or ill of them in the social network. Because of this, the past year has seen a dramatic increase in the presence of these entities in Twitter. For example, in Spain in the year 2011 several elections have been held, leading the candidates of all political parties to approach Twitter to reach as many voters as possible. This indicates that Twitter now represents a large body of information that should not be underestimated and which must be studied in depth to accommodate the various NLP techniques for long texts to the short Twitter texts. This in turn opens up a wide range of possibilities for opinions analysis, information retrieval, data mining and so on.
2.1 Sociological aspects of Twitter
The research interest in microblogs, and specifically in Twitter, has experienced an evolution similar to that of the web, blogs and the Web 2.0 as a whole, i.e. increasing in line with the impact on society they have generated. The first academic studies on Twitter have been closer to the field of sociology than computer science. Articles by Java et al. (Reference Java, Song, Finin and Tseng2007) and Krishnamurthy, Gill and Arlitt (Reference Krishnamurthy, Gill and Arlitt2008) were among the first to perform a sociological study of Twitter. Both articles show that the number of updates and the number of followers of each user follow a power-law distribution. They also highlight the fact that much of the information flowing through Twitter is generated by a small group of users, and that there are therefore a large number of users who are mere consumers of information. In addition, there are some recent works that deal with linguistic style in Twitter that postulate the importance of how things are said as opposed to what is said (Danescu-Niculescu-Mizil et al. Reference Danescu-Niculescu-Mizil, Gamon and Dumais2011).
The analysis of the social network of Twitter is of great interest due to the connections that can be established between sociology and computer analysis. The work of Kivran-Swaine, Govindan and Naaman (Reference Kivran-Swaine, Govindan and Naaman2011) shows that social concepts like tie strength measurement, homophily or status (among others) are strongly related to the breaking of ties in Twitter (that is, to the action of ‘unfollowing’ someone). These findings can help the way we process the content of tweets according to the temporal evolution of the social graph.
The work by Romero, Meeder and Kleinberg (Reference Romero, Meeder and Kleinberg2011) also follows the same line. They found several ways in which a hashtag can propagate across the social networks and this propagation agrees with the sociological concept of complex contagion. They conclude that the propagation of hashtags can be studied according to the ‘exposure’ of users to these hashtags and the nature of the hashtags itself. For example, they found that the propagation of political topics has much to do with multiple repeated exposures, compared to the adoption of conversational and idiomatic tags. This, again, agrees with sociological theories not developed for online social networks. This connection with social theories occurs sidewards as certain techniques applied in the analysis of social graphs are incorporated within NLP tasks like word-sense disambiguation (Jurgens Reference Jurgens2011).
2.2 The importance of word of mouth
‘Word-Of-Mouth’ (WOM) is a powerful and primitive tool for transmitting information between people. It is well known, and not necessary to demonstrate, the great influence of information communicated by word of mouth, which we consider credible even when coming from people who are not part of our inner circle. The Internet revolution has updated WOM, and today one can speak of ‘Electronic-Word-of-Mouth’ (EWOM) or ‘On-line-Word-of-Mouth’ (OWOM). One form of this new OWOM is none other than microblogging. If traditional WOM has great power of influence, OWOM has even more due to the rapid and wide diffusion of a view has across the networks, especially if it has been published on a microblogging platform like Twitter. On Twitter you can find opinions on any subject: on a new product launched by a company, a political decision, an advertising campaign, or the attitude of a particular artist. The business and political worlds are realizing the importance of knowing this information, and for them it is vital to have a tool that allows them to monitor reviews of their actions, obtain feedback from their customers, and use this information as a competitive asset. In 2009, Jansen et al. (Reference Jansen, Zhang, Sobel and Chowdury2009) discussed the importance for businesses of OWOM analysis. They studied whether microblogging, specifically Twitter, can be considered as OWOM, concluding that Twitter is a great source of information for businesses and that the proper use of this information provides an important competitive advantage.
Although people often rely on the information communicated through WOM, this is not sometimes fully true. The EWOM could have the same problem, so some authors have questioned the truthfulness of the information published in social media platforms like Twitter. Castillo, Mendoza and Poblete (Reference Castillo, Mendoza and Poblete2011) study whether it is possible to classify automatically the credibility of the information posted on Twitter. They divide the study in two phases: first, they classify tweets in ‘news’ and ‘subjective tweets’ and, then, classify the ‘news’ ones in true tweets and false tweets. Because they follow a supervised approach, they construct a labelled corpus with the help of Mechanical Turk.Footnote 14 They identify four groups of features that can represent the credibility level of a tweet: text-based, network-based, propagation-based and top-element-based. The paper indicates that the best features to assess the credibility of tweets are propagation-based and top-element-based, i.e. features related with fraction of retweets, the number of tweets, the presence of hashtags, URL and mentions. The authors concluded that it is possible to assess automatically the level of social media credibility. While Castillo (Reference Castillo, Mendoza and Poblete2011) carried out an automatic classification, Morris et al. (Reference Morris, Counts, Roseway, Hoff and Schwarz2012) performed a survey of the features that the users bear in mind when considering whether a Twitter post is credible. The authors explain that some properties like the grammar used, the user name, or whether the user usually writes about the same topic are very important for measuring the credibility of a tweet. The authors conclude that the users have difficulty determining the truthfulness of content and that their judgements were often based on heuristics (e.g. an item has been retweeted) and biased systematically (e.g. topically related usernames seen as more credible).
3 Research on Twitter
The spectacular success of Twitter has become the microblogging platform in a valuable set of data which is constantly changing. This constant flow of information has attracted the interest of the research community, especially the SA community. The main interest of the SA community is the development of techniques to extract knowledge from the text published by the users. In this case, the knowledge to obtain is the opinion expressed by the users about any topic: politics, religion, economics, business and so on. Not only the research community has realized the importance of the information posted on Twitter, politicians and companies want to know what the people write in real time about them, so they request monitoring tools to know the opinions, feelings and sentiments that their potential customers are publishing.
The main characteristic of the Twitter messages is their length, 140 characters, which determines the text that the users post in the platform. Some of the characteristics of the tweets are the following:
(1) The linguistic style of tweets is usually informal, with a lot of abbreviations, idioms, and the use of jargon is very common.
(2) The users do not care about the correct use of grammar, which increases the difficulty of carrying out a linguistic analysis.
(3) Because the maximum length of a tweet is 140 characters, the users usually refer to the same concept with a large variety of short and irregular forms. This problem is known as data sparsity, and it is a challenge for the sentiment-topic task.
(4) The lack of context is a very difficult problem that the SA systems have to deal with.
Since 2009 the SA research community has started to face the problem of the computational treatment of opinions, sentiments and subjectivity in the short texts of Twitter. Up to now, several papers have been published, but the task is not resolved yet. In the following sections, the most relevant works in the field of SA in Twitter are described and some applications of SA in Twitter like Political Opinion Mining will also be cited.
3.1 Polarity classification
In the literature related to the SA in long texts, a distinction is made between studies of texts where we assume that the text is an opinion and therefore solely need to calculate its polarity (polarity classification), and those in which before measuring polarity it is necessary to determine whether the text is subjective or objective (subjectivity classification). Concerning the study of polarity in Twitter, most experiments assume that tweets are subjective. One of the first studies on the classification of polarity in tweets was carried out by Go, Bhayani and Huang (Reference Go, Bhayani and Huang2009). They conducted a supervised classification study on tweets in English. If anything characterizes Twitter, it is the vast amount of information published and the wide variety of topics on which users write. This makes very difficult and expensive the construction and manual tagging of a corpus for the supervised classification of polarity. Thus, the authors use the emoticons that usually appear in tweets to differentiate between positive and negative tweets. The validity of this technique was demonstrated by Read (Reference Read2005). Through Twitter Search APIs, authors generated a corpus of positive tweets, with positive emoticons ‘:)’, and tweets with negative emoticons ‘:(’. The corpus is used to study which features and which classification algorithm are best for the classification of polarity on Twitter. The algorithms analysed are the same as used by Pang et al. (Reference Pang, Lee and Vaithyanathan2002), i.e. Support Vector Machine (SVM), Naïve Bayes and maximum entropy. The authors obtained good results with the three algorithms and the different features they tested. They drew some interesting conclusions, such as that the use of POS-TAGS does not provide valuable information for the classification of polarity on Twitter, that the simple use of unigrams to represent tweets provides very good results, comparable to those obtained in the classification of polarity on long texts and, finally, that the results obtained with unigrams can be slightly improved by the combination of unigrams and bigrams.
A turning point in awareness of the growing importance of Twitter in society was the death of Michael Jackson. According to Kim et al. (Reference Kim, Gilbert, Edwards and Graeff2009), following the announcement of the death of Jackson, between 9 pm and 10 pm on 25 June 2009 about 279,000 tweets were published, approximately 78 per second. This study, as well as providing curious data on the tweets published after Jackson's death, presents an analysis of the mood of the users who posted tweets about the death of the famous singer. The authors do not use a machine learning algorithm, but rather discriminate the expressions of sadness in tweets based on the score that the lexicon Affective Norms for English Words (ANEW)Footnote 15 assigned to each term appearing in the tweets. The lexicon ANEW provides a set of 1,034 English words, which are scored on a scale of 1–9 concerning three different moods: valence (pleasure/displeasure), arousal (excitement/calm) and dominance (strength/weakness). Readers wishing to learn more about ANEW can refer to Bradley and Lang (Reference Bradley and Lang1999).
Following Go et al. (Reference Go, Bhayani and Huang2009), Pak and Paroubek (Reference Pak, Paroubek, Chair, Choukri, Maegaard, Mariani, Odijk, Piperidis, Rosner and Tapias2010) studied the validity of Twitter for the SA. They generated a corpus of positive tweets with positive emoticons, negative tweets with negative emoticons, and neutral tweets that corresponded to the user accounts published by newspapers and magazines in North America. First, a study of the frequency distribution of words in the tweets was performed on the corpus of 300,000 tweets generated, as well as an analysis of the frequencies of the different syntactic categories to which the words of the tweets of each of the three classes belong. Finally, the authors applied a machine learning process to classify the polarity of the tweets. In this process, the performance of three algorithms was assessed: SVM, Naïve Bayes and Conditional Random Fields (CRF). The authors concluded that the best configuration for the analysis of opinions on Twitter is to use the Naïve Bayes algorithm, and use n-grams and Post-tags as characteristics of the tweets.
Thelwall, Buckley and Paltoglou (Reference Thelwall, Buckley and Paltoglou2011) analyse the possible relation between events and changes in the intensity of opinions expressed in social networks. Thus, the authors ask: are the moments of greatest interest in a particular subject associated with changes in the intensity of opinions expressed on them? To demonstrate this, they ask the following question: Are the events referenced on Twitter associated with an increased intensity of the opinions posted on Twitter about them? Experiments performed by the authors to address this question started by using the Spinn3rFootnote 16 company's web service to download 34,770,790 tweets in English, continuing with the selection of the thirty most important events that occurred during the twenty-nine days to which the tweets belonged. After selecting the items, the next step was to determine the intensity of opinion, both negative and positive, of the tweets. They used an algorithm developed by the authors themselves and introduced in 2010 (Thelwall et al. Reference Thelwall, Buckley, Paltoglou, Cai and Kappas2010). The SentiStrengthFootnote 17 algorithm is designed for the analysis of short messages and is trained to work with abbreviations and jargon specific to the data source. Although designed for the analysis of texts published on MySpace, the authors are convinced it will perform well with the messages posted on Twitter. SentiStrength assigns each message a score of positivity and negativity on a scale of 1–5 (1: no positive/negative; 5: very positive/negative). For example, the message ‘Luv u miss u’ is assigned a positivity of 3 and a negativity of -2. Some outstanding features of this algorithm are its ability to correct spelling errors, its understanding of the jargon often used on Twitter, the use of linguistic rules for the treatment of negation, the valuation of modifiers like ‘very’, and finally the fact that in its calculation of the intensity of opinions it also takes into account the emoticons published in messages. In conclusion, the authors note that there is evidence that the importance of the events commented on Twitter is related to the increase in the intensity of negative reviews. They also state that it does not seem likely that important issues can be identified by the intensity of opinions, but rather by the volume of tweets posted on them. Finally, they point out that most Twitter users, rather than expressing their opinion on a particular event often use Twitter simply from a humorous point of view.
A very interesting study is performed by Ley Zhang et al. (Reference Zhang, Ghosh, Dekhil, Hsu and Liu2011), in which a hybrid method for the classification of polarity is applied to Twitter. As is well described by the authors, in SA there exist two paradigms, one based on the use of lexical resources such as lexicons and another based on the use of machine learning techniques. Those based on lexical resources often have the problem of obtaining low recall values because they depend on the presence of the words comprising the lexicon in the message to determine the orientation of opinion. Machine learning-based methods meanwhile depend on the availability of labelled data sets. As regards SA on Twitter, the first strategy has the problem of the varied and changing nature of the language used on Twitter, and the second the difficulty of obtaining a large corpus of labelled tweets. To overcome these problems, the authors propose a hybrid system for the analysis of sentence-level opinions on Twitter. For their experiments, they used a corpus of English tweets on five separate entities (Obama, Harry Potter, Tangled, iPad and Packers), to which was applied a pre-processing consisting of removal of retweets, translation of abbreviations into original terms and deleting of links, a tokenization process, and morphosyntactic labelling (POS). Once the corpus was cleaned, a lexicon-based method for classifying tweets according to their polarity was applied. The authors selected a set of subjective words from all those available in English and added hashtags with a subjective meaning. Note that special rules apply for the treatment of comparative judgements, the treatment of negation, and the treatment of expressions that can change the orientation of a phrase. To solve the problem of recall often inherent in these methods, the authors attempted to identify a greater number of words indicative of subjective content. Thus, they applied the χ2 test, with the idea that if a term is more likely to appear in a positive or negative judgement, it is more likely to be a subjective content identifier. In this way, and automatically, they were able to increase the number of labelled tweets. The next step was to apply a machine learning method for the classification of new tweets, in this case using the SVM algorithm.
Although there are some controversial studies about the use of emoticons as a valid corpus of Twitter, recently Davidov, Tsur and Rappoport (Reference Davidov, Tsur and Rappoport2010a) used 50 hashtags and 15 emoticons as sentiment labels to train a supervised sentiment classifier using the K Nearest Neighbors (KNN) algorithm. The experiments are validated by human judges and the results obtained are very promising. On the contrary, much of the works on Twitter use raw word representation (n-gram) as a feature to build a model for sentiment detection. However, the inclusion of some meta-information (for example POS tags) and the use of syntactic features of the tweets (for example hashtags, retweets and links) can improve the result obtained (Barbosa and Feng Reference Barbosa and Feng2010). Based on this previous work, Jiang et al. (Reference Jiang, Yu, Zhou, Liu and Zhao2011) study the target-dependent sentiment classification of tweets by using SVM and General Inquirer. They classify the sentiments of the tweets as positive, negative or neutral according to a given query. Thus, the query serves as the target of the sentiments. In addition, they also apply a context-aware approach to incorporate the context of tweets into the classification. In Agarwal et al.(Reference Agarwal, Xie, Vovsha, Rambow and Passonneau2011), a study was performed on the different features to be taken into account in SA on Twitter. The study is conducted on a reduced corpus of tweets labelled manually. The experiment tests different methods of polarity classification and starts with a base case consisting of the simple use of unigram, then a tree-based model, specifically partial tree kernels, a third model consisting of the use of various linguistic features and, finally, a combination of the different models proposed. A common feature used both in the tree-based model and in the third feature-based model is the polarity of the words appearing in each tweet. To calculate this polarity, the authors use the DAL dictionary (Whissell Reference Whissell1989). Also noteworthy is the extensive set of features they use and the study they perform on which one gives more information. After extensive experimentation, they concluded that both the tree-based and the feature-based models enhance the base-case results, and that the features most relevant to SA on Twitter are those that define the polarity of a term numerically. The last conclusion the authors reach contradicts the research carried out so far, since most authors tend to indicate that the characteristics specific to Twitter imply the use of other techniques or a special adaptation of the techniques of OM on long texts. There is, however, a strong indication in this case that SA on Twitter is no different from the analysis on long texts.
Up to now all the studies described which follow a strategy based on machine learning have used traditional methods, which is to say algorithms normally used for ‘static’ text classification. In contrast, Bifet and Frank (Reference Bifet and Frank2010) opt for the use of data flow algorithms for polarity classification in Twitter. In addition, they propose the use of the Kappa evaluation measure (Cohen Reference Cohen1960) to evaluate large amounts of unbalanced data. In their experimentation, they used a framework for data flow analysis: massive online analysis (MOA) (Bifet et al. Reference Bifet, Holmes, Kirkby and Pfahringer2010). The data used were the corpus generated by Go et al. (Reference Go, Bhayani and Huang2009) and Petrović, Osborne and Lavrenko (Reference Petrović, Osborne and Lavrenko2010), from which, after a process of tokenization, the stop words from the list of WEKA (Waikato Environment for Knowledge Analysis) were eliminated and then represented by binary vectors, where the presence of each unigram was indicated. The algorithms tested in the experimentation were Multinomial Naïve Bayes, stochastic gradient descent (SGD) and Hoeffding tree. The authors conclude that for polarity classification in Twitter the algorithm which returns the best results is SGD. The results obtained with the corpus of Go et al. for Naïve Bayes are comparable with those of Go et al.(Reference Go, Bhayani and Huang2009).
Hernández and Sallis (Reference Hernández, Sallis, Martin and Kim2011) propose an unsupervised method of reducing features for SA. Their method is based on the latent Dirichlet allocation (LDA) methodology, which is summarized in the article. The method is evaluated with a corpus of 10,000 tweets in English on the iPad tablet, which were downloaded during the months of March and April 2011. After cleaning the corpus, the tweets are represented following the vector space model and using the TF-IDF metric to weight the terms. Once all the tweets are represented, the authors apply their proposal for the reduction of features. They do not carry out a polarity classification process to compare the performance of the complete data set and the reduced data set. They concluded that the reduced model is better because its entropy value is less (better) than that of the complete model.
Aisopos et al. (Reference Aisopos, Papadakis, Tserpes and Varvarigou2012) note some difficulties faced by SA on Twitter: the sparsity of the data, the use of non-standard vocabulary, the low grammar quality of the messages and multilingual nature of the texts published on Twitter. To overcome these problems, the authors study different models to represent the tweets. The models are divided into two groups, those that are based on the content of each tweet and those which use the context of the tweet. The content model that obtains the best results consists of representing each tweet as a graph of character n-grams. Due to this use of character n-grams, the solution becomes independent of the language, and the syntactic and grammar errors rendered irrelevant, so some of the problems highlighted are overcome. The context model is in our view a bit simple, because the authors based their model on the behaviour of the users whose tweets are in the corpus used for the experiment, e.g. they claim that the users that usually post neutral tweets publish more than those that post positive or negative tweets. The supervised classification found evidence of good performance of the content model and not so good behaviour of the context model.
One of the problems of SA in Twitter stressed in Aisopos et al. (Reference Aisopos, Papadakis, Tserpes and Varvarigou2012) was the sparsity of the texts due to the large variety of short and irregular forms found in tweets because of the 140-character limit. Saif, He and Alani (Reference Saif, He and Alani2012) assessed two methods for solving the sparsity problem. The first method consists of mapping some words to semantic concepts, e.g. Mac, Ipod, Iphone and Ipad match with Apple Product, and then applying an interpolation method. The other proposal is based on the joint sentiment/topic model (JST) (Lin and He Reference Lin and He2009) that instead of mapping semantic concepts, clusters sentiment concepts. The two different models for representing the tweets are used to train the Naïve Bayes algorithm. The corpus used for the experiment is generated by Go et al. (Reference Go, Bhayani and Huang2009). The first evaluation concludes that the method based on semantic interpolation is the best, but then, with the aim of comparing their results with other works, Saif et al. tested their system with the test set of the corpus. In this case, the JST model performed better than the model proposed by Saif et al. Moreover, the JST model reached better results than those obtained with the same corpus in Go et al.(Reference Go, Bhayani and Huang2009) and Speriosu et al. (Reference Speriosu, Sudan, Upadhyay and Baldridge2011).
3.2 Temporal prediction of events on Twitter
One the main topics of interest in Twitter research is the prediction of events based on temporal series. For example, Bollen, Pepe and Mao (Reference Bollen, Pepe and Mao2011) attempted to demonstrate the correlation that exists in the temporal evolution of the mood of a society with the occurrence of certain political or economic social events. They first characterized the tweets as a vector of six dimensions of mood, using an extended version of the profile of mood states (POMS) lexicon (McNair et al. Reference McNair, Lorr and Droppleman1971) presented by them in Pepe and Bollen (Reference Pepe and Bollen2008). Unlike Go et al. (Reference Go, Bhayani and Huang2009), they do not use emoticons to determine whether a tweet is expressing an opinion or emotion, but only work with those that contain some expressions like ‘I’m . . .’ or ‘I feel . . .’. Finally, the tweets are used to construct a time series for every mood POMS defined to study its correlation with certain events that occurred between August and December 2008. The authors concluded that there is a correlation between political, economic and social events with the mood of a society, or rather, with the mood of Twitter users. From a more technical point of view, they make clear their preference for unsupervised learning methods for OM on Twitter.
Asur and Huberman (Reference Asur and Huberman2010) attempt to demonstrate the usefulness of what is published on the Web 2.0 and especially on Twitter, regarding the prediction of future events, as in the case of the box office earnings of a film. First, they attempted to predict the revenue of a film from its first weekend in the theatres from the ratio of tweets posted on the film in the week before its release. This led them to coin the term tweet-rate, defined as the ‘number of tweets per hour that refer to a particular film’. The experiment showed a strong correlation between the tweet-rate and takings in the first weekend. This encouraged the authors to develop a method of linear regression for the prediction of the revenue, to which new elements were added such as seven variables corresponding to each tweet-rate for each day of the week, and seeing that this improved the results they added to the model the number of cinemas which would show the film for the first time, achieving a high correlation with the latter combination. With the aim of further improving the outcome of the prediction, they added to their linear regression model the ratio of positive and negative tweets. To calculate this ratio, they first needed to determine the polarity of the tweets of each film, following to this end a supervised learning strategy. An essential requisite for supervised learning is to have a set of labelled data, and for the construction of this data set the authors used the service Mechanical Turk. For the generation of the classification model, they used the DynamicLMClassifier algorithm from the LingPipe NLP framework.Footnote 18 The inclusion of this variable, which depends on the determination of the polarity of the tweets, further improved the model. The authors concluded with the generalization of their model for predicting business results not only for films but for any product or service.
In Bollen, Mao and Zeng (Reference Bollen, Mao and Zeng2011), Twitter is used as a source of information for predicting changes in securities markets. The authors work with 9,853,498 tweets collected between 28 February and 19 December 2009. Of all the tweets downloaded, as in Bollen et al. (Reference Bollen, Pepe and Mao2011), only those that contained expressions like ‘I am feeling’ or ‘I dont feel’ were used, and to prevent spam all the tweets containing URLs were removed. To evaluate the polarity of the opinions expressed in the tweets, a strategy based on unsupervised learning was followed, using the two lexicons OpinionFinderFootnote 19 and GPOMS. OpinionFinder is a list of subjectivity clues that is part of the OpinionFinder Software, and GPOMS is an extension of the POMS lexicon developed by the authors. The result of applying these tools to all the tweets was seven series, one generated by OpinionFinder and six by GPOMS. To compare these series with the evolution of changes in U.S. stock markets, the data of the Dow Jones Industrial Average (DJIA) statistics were downloaded daily. To demonstrate that the opinions represented by GPOMS and OpinionFinder can predict future values of the DJIA, the authors used a Granger causality analysis, while to show that the accuracy of the DJIA prediction models can be improved with the inclusion of information related to the opinions published on Twitter, they used the neural network SOFNN. In conclusion, the authors suggest that the time series obtained with OpinionFinder does not predict correctly the values of the DJIA, while some GPOMS emotional states such as calm are able to predict changes in the DJIA several days in advance. As for the validity of the information on opinions for improving DJIA prediction models, SOFNN indicates that they are valuable and really do enhance the results.
3.3 Political opinion mining in Twitter
The use of Twitter as a source of data for making predictions is not limited to the commercial world, but it has also been applied to predicting election results. One of the first works published on this line was O'Connor et al. (Reference O'Connor, Balasubramanyan, Routledge and Smith2010), where the authors attempt to demonstrate that Twitter can be used as a source of information for surveys. They compare the evolution of opinions expressed in tweets on three distinct themes that occurred during the years 2008 and 2009 with two metrics commonly used in traditional surveys. In determining the polarity of the tweets, they follow a strategy based on unsupervised learning, using the OpinionFinder linguistic resource. For the analysis of the evolution of the opinions, they developed the concept of the daily opinion score, which is simply the ratio between positive and negative tweets. With this score, they constructed a time series and compared it with the traditional metrics of opinion polls. They conclude that there is a correspondence between what is published on Twitter and traditional opinion polls, stating that in future the automatic analysis of opinions in the Web 2.0 will replace opinion polls. They also point out that the work they have carried out is relatively simple and that to further increase the correspondence with opinion polls, it would be necessary to apply more advanced NLP techniques, as well as techniques for solving the specific problems generated by the texts published on Twitter.
With the same intentions, Tumasjan et al. (Reference Tumasjan, Sprenger, Sandner and Welpe2010) analyse whether it is possible to use Twitter to measure the political opinion. To carry out the study, the authors pose three questions:
(1) Is Twitter a social network in which politics are discussed?
(2) Can political opinions be extracted from Twitter?
(3) Can Twitter be used as a tool for predicting election results?
In an attempt to answer these questions, the authors examined the German elections of 2008. Regarding the first question, they conclude that there exists a high percentage of political tweets and that these have a high diffusion because many are retweets. The only negative aspect perceived by the authors is that this political content is dominated by a small group of users. To determine whether subjective political information can be extracted from Twitter, a profile was generated for each candidate and political party consisting of several emotional dimensions. For the construction of these profiles, the text analysis software LIWC2007Footnote 20 was used. This software calculates the degree to which a text is comprised of words belonging to a predefined set of psychological categories. For each psychological category, LIWC2007 calculates the relative frequency of words related to the category in question in the text being analysed. With the collected tweets, the authors were able to create these profiles, showing different shades of opinion and even differences between the campaigns of political parties and candidates, and concluded that these political tweets do contain subjective information. Regarding the third question, the experimentation is very simple but the results are surprising, and this is what has made this work so widely referenced. This experimentation consists of assigning to each political party as a voting percentage the relative frequency of references to the party in the corpus of tweets generated. With this assumption, as simple as considering each reference a vote, the results obtained differed by only 1.65 per cent from the outcome of the actual elections. With these data, the study concludes that Twitter can clearly be considered as a valid indicator of the state of political opinion, and that it can complement traditional methods of conducting opinion polls.
The above article aroused some enthusiasm for the easy and apparent success of the experiments, and some doubts about the strong conclusions that Twitter will be able to replace political polls in the future. One of the papers that challenged Tumasjan et al. (Reference Tumasjan, Sprenger, Sandner and Welpe2010) is Jungherr, Jürgens and Schoen (Reference Jungherr, Jürgens and Schoen2012), which repeats the same experiment but with more political parties. The authors criticized the fact that in Tumasjan et al. (Reference Tumasjan, Sprenger, Sandner and Welpe2010) there are few clues about the temporal range in which they downloaded the tweets, and the absence of the date of the poll which they compared with the results of the experiments. Jungherr et al. declared that with that little information, it is difficult for the research community to repeat the experimentation. Moreover, Jungherr et al. refute the idea that only the number of direct or indirect mentions in Twitter would be an indicator of a political party's results in an election. They prove their criticisms adding in the study the Pirate Party, which obtained 34.8 per cent, while this party only achieved 2.1 per cent of the votes in the last German elections. Tumasjan et al. (Reference Tumasjan, Sprenger, Sandner and Welpe2012) replied to Jungherr et al. by defending the selection of political parties for the experiments, using the same arguments as Jungherr et al., and asked why Jungherr et al. had not analysed the Twitter mentions of all the German political parties presented in the last elections.
The above discussion shows that in the NLP community, there exist some differences on the conviction that the application of SA techniques to Twitter messages, or simply processing those messages, can be used as a prediction tool or in the political domain as a replacement of the traditional polls. Some of these differences are described by Garcia-Avello (Reference Gayo-Avello2012), who describes some papers related to the prediction of economic or political events. The author highlights all the flaws of those papers and some recommendations for following research on political opinion in Twitter. Of all the recommendations, we would like to stress two. The first is the definition of ‘what is a vote?’, because any of the published papers in this field define ‘what is a vote’, and from our point of view this should be the previous step before the definition of a methodology or a system whose main function is the prediction of electoral results. The second recommendation is about how the authors apply SA techniques, because in most papers these techniques are not the main part of the systems proposed. We consider this to be very important because, should a negative mention of a political party in Twitter be considered as a positive vote? We think not.
In the same research line, Bermingham and Smeaton Reference Bermingham and Smeaton2011 (Reference Bermingham and Smeaton2011) use the Irish general election 2011 as a case study for investigating the potential to model political sentiment through mining of social media. They apply several machine learning algorithms and evaluate the error with respect to both polls and the election results themselves. As a final conclusion, they postulate that it is unclear whether the use of Twitter is a valid method for monitoring public sentiment about political issues.
The last UK elections were also a source for a SA study. Maynard and Funk (Reference Maynard, Funk, García-Castro, Fensel and Antoniou2012) show a methodology for measuring political opinion. The technique consists of representing each opinionated tweet as a triplet <Person, Opinion, Political Party>, e.g., <Bob Smith, pro, Labour>, whose meaning is that Bob Smith is a Labour supporter. To build this representation, the system must identify the opinion holder, the object of the opinion and the polarity of the opinion. The authors used the entity recognition system ANNIE (A Nearly-New IE system) (Maynard et al. Reference Maynard, Tablan, Cunningham, Ursu, Saggion, Bontcheva and Wilks2002) to detect possible proper names that could represent the opinion holder, and to identify the political party. For the subjective and polarity classification, they follow an unsupervised methodology based on a lexicon approach, taking into account the negative words that could modify the orientation of the trigger opinion words. With the schema described, the authors can study the progress of the political opinion of an author, which is a step beyond the static SA techniques that are usually applied. As the authors highlight in the conclusion section, political opinion is more changeable than an opinion about a commercial product, so it is useful to study the evolution of the opinion to determine the possible vote of the author. In other words, this study of the opinion progress is a way to build a context, which is one of the challenges for SA in Twitter.
3.4 Other research on Twitter
As the popularity of microblogging sites has increased, the number of publications related to Twitter in the field of computer science, and especially NLP, has not stopped growing. Due to the peculiarities of the platform, Twitter poses a number of challenges to NLP researchers. One very important challenge is related to information retrieval, in which there are two approaches: the first one aims at finding the answers to questions that Twitter users tend to post on their profiles, much like a question-answering portal; and the second approach is more related to information retrieval and presentation of the results of the user query. Some authors are now addressing this issue of information retrieval, as in the case of Abel, Celik and Siehndel (Reference Abel, Celik and Siehndel2011) who propose different strategies for information retrieval on Twitter, based primarily on the enrichment of the tweets with semantic information related to the history of each user's tweets and links to other websites mentioned in some tweets.
On the other hand, when a user creates an account on Twitter, the first question that arises is ‘Who do I follow?’, that is to say, which accounts should I follow in order to meet my information needs? This problem is noted in the work of Efron (Reference Efron2011), who proposes adapting to Twitter expert search techniques to assist in the search for relevant accounts to follow based on users’ interests. In addition to adapting information retrieval techniques to Twitter, it is also very important to maximize the characteristics of the platform. As already mentioned, many tweets are frequently labelled with a hashtag, which can be used to find the most relevant information for the user, to expand queries, or for the presentation of search results. This search using the hashtags is another type of expert search, but instead of retrieving the most relevant users, the most relevant hashtags are returned. Another important metadata that can be used are the mentions. Mentions are indicative of the possible initiation of a conversation between two or more users, a fact that can be used to perform user profiles and comparison of users, create graphs of relationships between users, or discover similar users. These supporting data could be useful for an information retrieval system or for SA.
One element which with the passage of time is becoming more important in microblogs, especially Twitter, is the concept of authority or influence. One application of this concept in information retrieval is the well-known PageRank algorithm used by Google, which is based on the idea that the relevance of a website depends on the importance of the relevant websites linked to it. Efron (Reference Efron2011) recommends the use of this concept for the retrieval of information on Twitter, especially when presenting query results to users. An example of this type of Twitter metrics is TunkRank, proposed by Tunkelang (Reference Tunkelang2012). However, TunkRank is only one method of many which exist within what has come to be called ‘PeopleRank’. In Gayo-Avello (Reference Gayo-Avello2010), the reader will find an analysis and comparison of several algorithms of this type. This concept should be taken into account in SA on Twitter, as the opinions of a user of influence will have a much wider scope than those of another whose tweets are read by a very small circle of followers.
Another open issue is the creation of resources and tools. For example, Petrović et al.(Reference Petrović, Osborne and Lavrenko2010) present a corpus of 97 million tweets in English downloaded between 11 November 2009 and 1 February 2010. The different elements which characterize the corpus are described in the article. Their intention was to make the corpus available to the scientific community, but because of alleged problems they had with the Twitter company, the corpus is no longer available, and the web address given http://demeter.inf.ed.ac.uk/ is no longer accessible.
All the Twitter corpus used for the different experimentations has been built by querying Twitter with keywords. This method has the risk of harvesting only the tweets which contain the keywords, and not those related tweets that could be more relevant. To solve this problem and enhance the recall of tweets, Cotelo, Cruz and Troyano (Reference Cotelo, Cruz and Troyano2012) proposed a method which updates dynamically the list of search keywords. The method exploits the graph structure of Twitter and considers each tweet as a node. The different nodes are joined with three kinds of edges depending on whether the relation between the tweets is a mention, a hashtag or the concurrence of several hashtags. This structure allows the authors to apply the PageRank algorithm, which selects relevant elements that a simple frequency analysis does not discover. The produce of the manuscript is a Twitter corpusFootnote 21 in the political domain for SA research.
3.5 Conferences and workshops
Due to the continuous growth of the research interest in SA in Twitter, some conferences have begun to devote time to promoting the research on this task. Until now, the most representative tasks or workshops in conferences about SA in Twitter have been the following:
(1) Microblog track at TRECFootnote 22: Competition conducted within the TREC conference, which had the main goal of developing methods for information retrieval in microblogs platforms.
(2) RepLab 2012 at CLEFFootnote 23: Competition carried out within the CLEF conference, where the participants had to develop a system for measuring the reputation of commercial brands.
(3) TASS 2012 at SEPLNFootnote 24: Satellite event of the SEPLN 2012 Conference to foster the research in the field of SA in social media, specifically focused on the Spanish language. The main objective is to promote the application of existing state-of-the-art algorithms and techniques and the design of new ones for the implementation of complex systems able to perform an SA based on short text opinions extracted from social media messages specifically Twitter.
4 Latest trends
The academic world is becoming increasingly aware of the interest in the utility of automatically processing users opinions published on microblogging platforms, but in order for this information to be useful for an end user it must be properly represented and easily understandable. This is the aim of Claster, Dinh and Cooper (Reference Claster, Dinh and Cooper2010), who propose a visualization method of the opinion that users have about a product, in this case related to tourism in Cancun. Their experimentation is divided into two phases, starting with a supervised classification of the polarity of tweets on Cancun with the Naïve Bayes algorithm, and later applying the self-organizing map (SOM) display method. For this second part of the experiment, the authors developed a list of words which express opinions related to tourism, these words being used in conjunction with the vector space model generated to represent the tweets. For the generation of the vector space model, a stemmer and stopper process was first applied to the body of tweets, and finally as a method of weighting the tokens the TF-IDF method was used. The result of this process was a hybrid method for monitoring published opinions on the tourist resort of Cancun.
Marcus et al. (Reference Marcus, Bernstein, Badar, Karger, Madden and Miller2011a) presented TwitInfo,Footnote 25 a prototype system for monitoring events on Twitter, in which are shown through a timeline the major peaks of publication of tweets about a particular topic, the most relevant tweets, and the polarity of the opinions they express. For the construction of the prototype, the authors used an API developed by themselves called TweeQLFootnote 26 (Marcus et al. Reference Marcus, Bernstein, Badar, Karger, Madden and Miller2011b). TweeQL is an API similar to the standard language of the SQL database for the downloading and automatic processing of tweets. As for the classification of polarity, TwitInfo uses the Naïve Bayes classifier and follows the strategy of Go et al. (Reference Go, Bhayani and Huang2009).
It is noteworthy that in the year 2011, a large number of articles related to the application of techniques of information retrieval and SA on Twitter were published. These articles no longer aim to test whether the classification techniques of polarity on long texts apply to messages posted on Twitter, but rather go one step further, and are accompanied by very complete experimentation. There are studies in which hybrid methods are applied to the classification of polarity, studies on different possible features to use for SA on Twitter, domain adaptation, the utilization of mining algorithms using continuous text flow, the use of Kappa (Cohen Reference Cohen1960) as a measure of evaluation, presentation of feature reduction methods, and studies on the identification of sarcasm on Twitter.
Sarcasm is a linguistic peculiarity defined as ‘[t]he activity of saying or writing the opposite of what you mean, or of speaking in a way intended to make someone else feel stupid or show them that you are angry’ (Macmillan English Dictionary, 2007). Sarcasm has been studied extensively from a linguistic and psychological point of view (Gibbs Reference Gibbs1986; Kreuz and Glucksberg Reference Kreuz and Glucksberg1989), but in the field of text mining and more specifically SA, fewer studies have been performed, mainly due to its complexity. In Pang and Lee (Reference Pang and Lee2008) a summary of the treatment of sarcasm in SA can be found.
As for sarcasm in Twitter, studies have been conducted on the treatment of sarcasm on this platform. In Davidov et al. (Reference Davidov, Tsur and Rappoport2010b) the SASI algorithm (Tsur et al. Reference Tsur, Davidov and Rappoport2010) is used to detect sarcasm in a Twitter data set. González-Ibáñez, Muresan and Wacholder (Reference González-Ibáñez, Muresan and Wacholder2011) follow a line similar to the previous one, but here the authors analyse the behaviour of algorithms normally used in SA, such as SVM and logistic regression. In this case, a corpus of Twitter is built from downloaded tweets with the hashtag #sarcasm. Following a pre-processing to remove noise introduced by hashtag used as described in Davidov et al. (Reference Davidov, Tsur and Rappoport2010b), the authors study the influence of various lexical features and punctuation in detecting sarcasm. The authors conclude that direct mentions and positive and negative emoticons are the elements which appear most in sarcastic messages.
Finally, a very recent work (Reyes et al. Reference Reyes, Rosso and Buscaldi2012) builds a model based on textual features in order to deal with figurative language. Specifically, the experiments are focused on recognizing humour and irony in tweets and they show the difficulties found with this kind of information and the usefulness of considering figurative language to improve SA accuracy.
5 Conclusion
The above discussion highlights the most relevant works in the field of SA in Twitter. The research in Twitter has progressed very fast, still unresolved problems such as the following remain:
(1) Data sparsity: Although some works have faced the problem of data sparsity, there is still much to do to resolve the problem of using different terms to refer to the same entity, to process bad grammar constructions, and to understand all the jargons that the users tend to use.
(2) Multilingual: As in SA in long texts, the main part of the research in SA in Twitter is only for English texts, so the research in other languages should be enhanced because the information is not in English alone.
(3) The SA in Twitter may have many applications, but these should be defined correctly. For example, in the political domain there are several papers, but none of them defines the problem or details what a vote is as highlighted in Gayo-Avello (Reference Gayo-Avello2012).
To conclude, SA is a rapidly expanding area in which research is being carried out in many different domains and on various problems associated with the task. Moreover, from our point of view, the great interest this discipline currently arouses is the potential applications of the technology in areas such as government or business intelligence and recommender systems. Thus, it is clearly necessary to develop SA systems that can extract the intrinsic knowledge disseminated through the social network of Twitter.
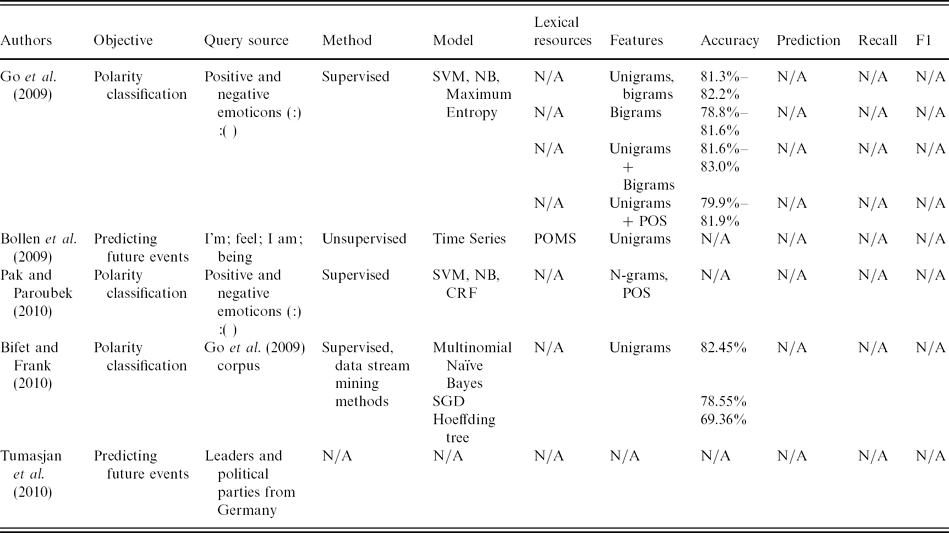
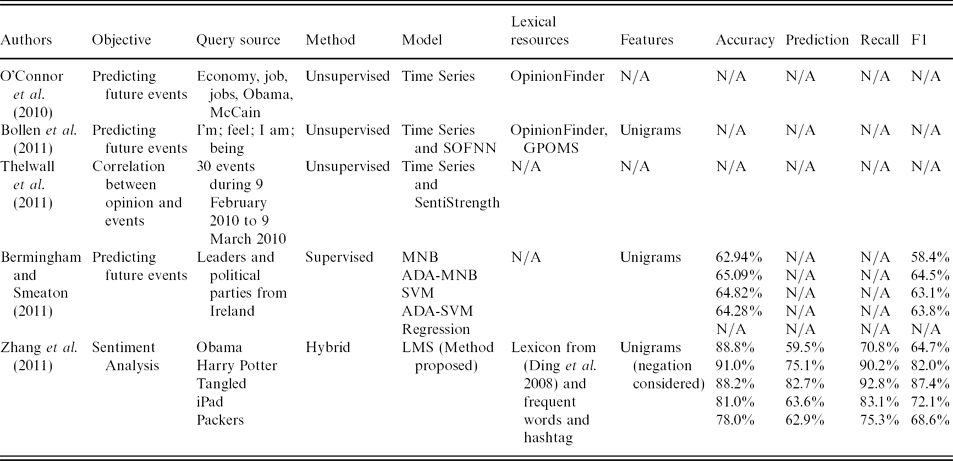
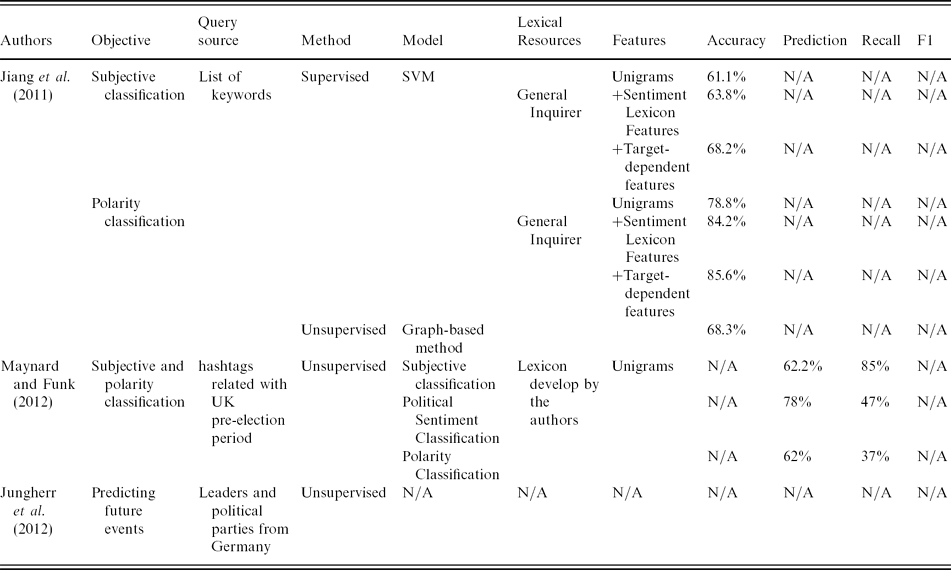
To sum up, Tables 1–3 show a summary of the most relevant studies cited in this survey, which allows the researcher to understand the research carried out about SA in Twitter. The columns are described as follows:
(1) Authors: The authors of the manuscript.
(2) Objective: Refers to the objective of the system or the methodology proposed. Some of them are polarity classification, event prediction and so on.
(3) Query source: The query used to build the Twitter corpus.
(4) Method: Could be supervised, unsupervised or hybrid.
(5) Model: The algorithms used by the authors.
(6) Lexical resource: Refers to the external semantic resources used like: WordNet, SentiWordnet, bag of words and so on.
(7) Features: The tweet metadata or textual features considered in order to accomplish the experiments.
(8) Accuracy: The accuracy measurement when it appears in the paper.
(9) Precision: The precision measurement when it appears in the paper.
(10) Recall: The recall measurement when it appears in the paper.
(11) F1: The F-score measurement when it appears in the paper.
Existing work in SA in Twitter
Existing work in SA in Twitter
Existing work in SA in Twitter
The N/A (not applicable) value means that this aspect is not applicable to the particular paper, either because it is not dealt with, not used or it made no sense to be applied.
Acknowledgments
This work has been partially supported by a grant from the Fondo Europeo de Desarrollo Regional (FEDER), TEXT-COOL 2.0 project (TIN2009-13391-C04-02) from the Spanish Government. Also, this paper is partially funded by the European Commission under the Seventh (FP7-2007-2013) Framework Programme for Research and Technological Development through the FIRST project (FP7-287607). This publication reflects the views only of the authors and the Commission cannot be held responsible for any use which may be made of the information contained therein.