Knowledge of politics is a prominent variable in the study of political behavior, but the field is increasingly beset by concerns that ordinary measures of knowledge are in fact mismeasures of knowledge (Mondak Reference Mondak1999; Krosnick et al. Reference Krosnick, Lupia, DeBell and Donakowski2008; Prior and Lupia Reference Prior and Lupia2008; Gibson and Caldeira Reference Gibson and Caldeira2009; Boudreau and Lupia Reference Boudreau and Lupia2011). Conventional knowledge measurement starts with questions that are thought to tap subjects’ levels of knowledge. These questions may be about institutions and processes (“If the president vetoes a bill, can Congress override his veto?”), public figures (“What job or office is currently held by Joe Biden?”), foreign affairs (“Is the United States a member of the United Nations?”), or other aspects of politics. Common practice is to define one answer to each question as correct. Subjects who give that answer are given a “score” of 1. Other subjects are given a score of 0, whether they answer incorrectly or say “don’t know.” Summing a respondent’s scores across all questions gives his “knowledge score”: a non-negative integer indicating his level of knowledge.Footnote 1
Several specific concerns have been raised about this method of measurement. One is that it rests heavily on “trivia questions” about matters that are irrelevant to political choices (Lupia Reference Lupia2006). Another is that political knowledge is multidimensional—for example, one may know much about domestic politics but little of foreign affairs—and that it is therefore misleading to assign a single “knowledge score” to any survey respondent (Iyengar Reference Iyengar1986; but see Delli Carpini and Keeter Reference Delli Carpini and Keeter1996). Another objection, and the one that is focused on here, is that basing political knowledge measures solely on the number of correct answers, thus combining “don’t know” and incorrect answers together, will produce undesirable or inappropriate results, either because these two response categories suggest different levels of political information or because the meaning of “don’t know” responses differs systematically across respondents based on individual-level characteristics such as personality (e.g., Mondak Reference Mondak1999). A central contention of Mondak’s work on this subject is that “don’t know” responses should be taken to indicate more knowledge than incorrect answers. Others, such as Sturgis, Allum and Smith (Reference Sturgis, Allum and Smith2008) and Luskin and Bullock (Reference Luskin and Bullock2011), however, have suggested that this argument may be misguided.
Although much of the extant literature related to these topics focuses on whether survey writers should encourage or discourage “don’t know” responses when writing new surveys, this paper is centrally concerned with assessing the level of political knowledge suggested by correct, incorrect, and “don’t know” responses in existing survey data and whether this varies by respondent personality as has been suggested in the literature. For example, how should researchers think about “don’t know” responses in existing data such as those from the American National Election Studies (ANES) in which they are relatively common? Simply discarding any respondent who gave a “don’t know” answer to one or more questions seems undesirable in the abstract and in practice would often result in the loss of a huge percentage of observations. For example, in the 1988 ANES, nearly 90 percent of respondents said “don’t know” to at least one of the 13 survey’s political knowledge questions; however, if these “don’t know” responses are to be used in the construction of measures of political knowledge, researchers must know how much knowledge they indicate relative to correct and incorrect answers. To this end, I present a multinomial item response model of answers to political knowledge questions that allows for the estimation of respondents’ underlying levels of political knowledge as well as the direct comparison of the levels of knowledge implied by correct, incorrect, and “don’t know” responses. The model is estimated for several waves of the ANES, strongly indicating that “don’t know” responses actually reflect less political knowledge—not more—than incorrect responses.
A more specific concern about “don’t know” responses is that their meaning may vary across respondents. For example, one type of respondent may offer a “don’t know” response even if she is fairly confident, but not completely certain of her knowledge about a certain question, whereas a different respondent may only say “don’t know” if he is completely clueless. The most prominent of these claims in the literature has been that respondent personality plays a large role in determining the level of knowledge that should be inferred from a “don’t know” response (Mondak and Halperin Reference Mondak and Halperin2008; Mondak Reference Mondak2010). Clearly, personality factors, such as how extroverted or how agreeable a respondent is seem like plausible candidates for mediating the relationship between knowledge levels and the likelihood of saying “don’t know.”
The model used here provides a direct way to investigate such hypotheses. Specifically, I estimate the model using a newer national study that includes both factual questions about politics and a rich battery of personality items. This battery measures the “Big Five” personality traits, which are the most widely studied personality traits in psychology (Funder Reference Funder2001) and are increasingly used in political science (e.g., Gerber, Huber and Washington Reference Gerber, Huber and Washington2010; Mondak Reference Mondak2010). By separately estimating the model for high- and low-trait respondents on each of these five major personality traits, I find that the conclusions drawn from looking at respondents of all personality types together—that “don’t know” answers are indicative of less knowledge than incorrect answers—is highly robust to variations in personality: it holds for extroverts and introverts, the agreeable and the less agreeable, the highly conscientious and the less conscientious, and for other personality factors. Contrary to previous arguments in the literature, the meaning of these “don’t know” answers does not differ meaningfully by respondent personality.
This paper is organized as follows. I begin by describing conventional knowledge measurement and arguing that one of the main methods used to advance arguments about the meaning of “don’t know” responses is inappropriate. I proceed by developing an explicit model of responses to knowledge questions. I then estimate this model using data from several waves of the ANES and discuss the findings. Next, I estimate the same model on a large new data set, separating respondents by their level of each of the Big Five personality traits. I conclude by considering the implications of these findings and avenues for future research.
Concerns About Conventional Knowledge Measurement
Previous work has cast doubt on the wisdom of combining incorrect and “don’t know” responses when analyzing political knowledge items. Those who make such arguments have claimed that scoring incorrect and “don’t know” responses in the same way is misleading if the two types of response are related to non-knowledge variables in different ways (e.g., Mondak Reference Mondak1999). For example, the argument goes, it is misleading to assign the same score to incorrect and “don’t know” responses if education is positively correlated with incorrect answers but negatively correlated with “don’t know” responses. This sort of objection figures in several broadsides against conventional knowledge measurement, and Mondak (Reference Mondak1999, 66) calls the comparison of such correlations “the critical diagnostic test.”
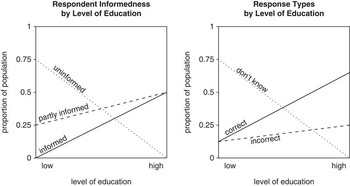
This type of test, however, can easily lead to improper conclusions. To see why, consider the task of estimating knowledge levels in a population that has three types of people: the uninformed, who know nothing; the informed, who know the answer to any question that might be put to them; and the partly informed, whose level of knowledge lies in between. Let the probabilities of knowing the correct answer to a given question be 0, 1, and 0.5 for the uninformed, informed, and partly informed, respectively. Assume that the uninformed always answer “don’t know,” the informed always answer correctly, and the partly informed answer correctly half the time and incorrectly half the time.Footnote 2 Assume as well that the relationship between education and knowledge is as shown in the left-hand panel of Figure 1. At the lowest level of education, three-fourths of the population is uninformed, one-fourth is partly informed, and no one is informed. At the highest level of education, no one is uninformed, half the population is partly informed, and half the population is fully informed. These assumptions are consistent with the finding that education and political information are positively correlated (Delli Carpini and Keeter Reference Delli Carpini and Keeter1993).
Conventional knowledge measures can be unbiased even if incorrect and “don’t know” responses are not equally correlated with a third variable Note: the figure depicts relationships between political information, education, and responses to knowledge questions in a hypothetical population. The left-hand panel shows the proportion of respondents who are informed, partly informed, or uninformed as a function of education. Under the assumptions described in the text, these relations between education and political information lead to the relations between education and response type—correct, incorrect, or don’t know—that are depicted in the right-hand panel. Importantly, the right-hand panel shows that “don’t know” responses decline with education, whereas incorrect responses increase with education. When such patterns are found in survey data, they are sometimes taken as evidence that knowledge measures are biased if they score incorrect and “don’t know” answers in the same way. As this example demonstrates, this conclusion is too strong.

The preceding assumptions produce the patterns that appear in the right-hand panel of Figure 1. As education increases, “don’t know” responses become less common, whereas incorrect answers become more common.Footnote 3 Some would take this as evidence that “don’t know” and incorrect responses must be scored differently but it is not. To see this, consider conventional knowledge scores for the population described in Figure 1. Uninformed respondents in this population answer “don’t know” and therefore receive a score of 0. Informed respondents answer correctly and therefore receive a score of 1. Partly informed respondents have an equal chance of answering correctly and receiving a score of 1 or answering incorrectly and receiving a score of 0, the average score of this group is therefore 0.5. We thus obtain unbiased estimates of respondents’ probabilities of knowing the answer to this question, which presumably would serve as a reasonable, if not necessarily ideal, estimate of each respondent’s underlying political knowledge level.Footnote 4 The estimates are unbiased even though conventional scoring, which treats incorrect and “don’t know” answers in the same way, is used. Moreover, these estimates are unbiased even though education is positively correlated with incorrect responses but negatively correlated with “don’t know” responses. This example thus demonstrates that such patterns do not necessarily imply a flaw in conventional methods of knowledge measurement.
Perhaps more importantly, this example illustrates the difficulty of evaluating the relative levels of knowledge implied by correct, incorrect, and “don’t know” responses to political knowledge questions by only looking at the relationships between respondent characteristics and their probabilities of answering in different ways. Of course, it remains possible that conventional measurement methods are biased, despite the potential for misleading conclusions that exists in these tests. The preceding example, then, should also emphasize the need for investigation through more direct means of the relationship between underlying levels of political knowledge and the probability of giving correct, incorrect, or “don’t know” responses. The following section addresses this through the development of a multinomial probit (MNP) item response model of political information.
Directly Modeling Political Knowledge Item Response
Item response models, also called latent traits or ideal point models, have become increasingly common in the political science literature. They have been used to measure such important concepts as the ideology of members of Congress (e.g., Poole and Rosenthal Reference Poole and Rosenthal1985; Heckman and Snyder Reference Heckman and Snyder1997; Clinton, Jackman and Rivers Reference Clinton, Jackman and Rivers2004), Supreme Court justices (Martin and Quinn Reference Martin and Quinn2002), and ordinary citizens (Bafumi and Shapiro Reference Bafumi and Shapiro2009; Jessee Reference Jessee2009; Shor Reference Shor2009; Jessee Reference Jessee2010) as well as the level of democracy across countries (Treier and Jackman Reference Treier and Jackman2008), the level of respect for human rights (Schnakenberg and Fariss Reference Schnakenberg and Fariss2014), and the biases of media outlets (Groseclose and Milyo Reference Groseclose and Milyo2005). These models provide a valuable tool for estimating the characteristics of variables that are not directly observable, but which affect observable data. Political knowledge is a prime example of this type of variable. There is no way to directly measure a person’s level of knowledge, but it would be expected that responses to survey questions asking respondents about political facts would be strongly affected by their knowledge levels.
Simplicity is the allure of the conventional approach to knowledge measurement. Few things are simpler than totaling the number of correct answers that a respondent gives to series of factual questions.Footnote 5 Moreover, although this approach is rarely justified by reference to a model, it can be. In particular, item response models conceptualize respondents’ answers to political knowledge survey items as being generated stochastically based on each individual’s underlying (latent) level of knowledge. Item response theory models such as the Rasch model (Rasch Reference Rasch1960a; Rasch 1960Reference Raschb) originated in educational measurement research, but in political science they are rarely used to study political knowledge (see Jackman Reference Jackman2000; Lawrence Reference Lawrence2009; Jessee Reference Jessee2009; Jessee Reference Jessee2010 for exceptions). Using them in this way, however, is closer to the purpose for which the models were originally designed.
In most political science applications of item response theory, the main quantities of interest are respondents’ individual levels of the latent attribute. The model presented here is much closer to the spirit of most educational testing analyses because the central goal is not to estimate the political knowledge level of each respondent, but instead to determine how much knowledge is indicated by each response type: correct, incorrect, and “don’t know.”
Most latent trait models in political science have utilized binary data. For example, congressional voting (“yea” or “nay”) or Supreme Court decisions (“reverse” or “affirm”) take only one of two values (but see Noel (Reference Noel2007) for an example of ideal point estimation with abstentions as a third vote category using a multinomial logistic (MNL) setup). The key issue here, however, is how to understand the level of political knowledge that is suggested by each of the three types of responses: correct, incorrect, and “don’t know.” Because there are more than two categories and because the goal is to determine (rather than to assume) the ordering of these categories in terms of how much knowledge each indicates, a multinomial model is used. These sorts of models were first analyzed by Bock (Reference Bock1972), who employed a MNL setup. Taking a somewhat similar approach, Anderson, Verkuilen and Peyton (Reference Anderson, Verkuilen and Peyton2010) use log-multiplicative association models, which are extensions of the MNL setup, to examine political knowledge levels.
Here, it is assumed that respondents’ latent propensities to give each response type are vectors of length equal to the number of response types p, which for us will be 3: correct, “don’t know,” and incorrect. The propensities, called u ij for each respondent i=1, … , n on each survey question j=1, … , m are assumed to have a multivariate normal distribution:
 $$u_{{ij}} =\left[ {\matrix{ {u_{{ij1}} } \cr {u_{{ij2}} } \cr \vdots \cr {u_{{ijp}} } \cr } } \right]\,\sim\,N\left( {\left[ {\matrix{ {\gamma _{{j1}} {\plus}\delta _{{j1}} x_{i} } \cr {\gamma _{{j2}} {\plus}\delta _{{j2}} x_{i} } \cr \vdots \cr {\gamma _{{jp}} {\plus}\delta _{{jp}} x_{i} } \cr } } \right],\Omega _{j} } \right),$$
where x i is respondent i’s level of political information, Ω j the positive definite covariance matrix. The distribution of the u ij s are assumed to be independent across questions and respondents given γ, δ, x, and Ω.
The only observed data consist of an n×m response matrix y, which contains each respondent’s answer type for each question, indexed by an integer from 1 to p. It is assumed that on each question, respondents select the response option for which u ij is largest. Formally, we can write
 $$y_{{ij}} =\mathop{\sum}\limits_{k=1}^p k{\times}I({\rm max}(u_{{ij}} )=u_{{ijk}} ),$$
where y ij is respondent i’s answer to question j.
As in the standard MNP model, however, the latent response propensities u, and hence the other parameters γ, δ, and Ω, are not identified. Adding any arbitrary constant to each element of u ij or multiplying each one by a positive constant will result in exactly the same likelihood for the data given corresponding transformations of γ, δ, and Ω. Because of this, it is common to work with “differenced” propensities (see Rossi, Allenby and McCulloch Reference Rossi, Allenby and McCulloch2005, section 4.2). Accordingly, the model is not written in terms of the response propensities u ij , but instead in terms of the difference between the propensity for a given “baseline” response category and the propensities for each of the other response categories. If we label the categories such that the baseline category is the last one p, we assume that w ij =u ij−p −u ijp , which yields
 $$w_{{ij}} =\left[ {\matrix{ {u_{{ij1}} {\minus}u_{{ijp}} } \cr {u_{{ij2}} {\minus}u_{{ijp}} } \cr \vdots \cr {u_{{ij\left( {p{\minus}1} \right)}} {\minus}u_{{ijp}} } \cr } } \right]\,\sim\,N\left( {\left[ {\matrix{ {\alpha _{{j1}} {\plus}\beta _{{j1}} x_{i} } \cr {\alpha _{{j2}} {\plus}\beta _{{j2}} x_{i} } \cr \vdots \cr {\alpha _{{j\left( {p{\minus}1} \right)}} {\plus}\beta _{{j\left( {p{\minus}1} \right)}} x_{i} } \cr } } \right],\Sigma _{j} } \right),$$
where α jk =γ jk −γ jp and β jk =δ jk −δ kp for each question j and each response type k=1, … , p−1. The observed responses are now determined by these differenced response propensities w according to
 $$\eqalignno{ y_{{ij}} = & \left[ {\mathop{\sum}\limits_{k=1}^{p{\minus}1} k{\times}I({\rm max}(w_{{ij}} )=w_{{ijk}} \,{\rm and}\,w_{{ijk}} \,\gt \,0)} \right] \cr & {\plus}p{\times}I(w_{{ijk}}\, \lt\, 0\,{\rm for}\,k=1,\:\,\ldots\,\:,\,p{\minus}1). $$
In other words, if all of the elements of w ij are <0, indicating that the response propensity for the baseline category p is larger than that for all other categories, then the baseline option is chosen. If any of the elements of w ij is positive, the alternative corresponding to the largest value of w ij is chosen.
In the standard MNP model with observed (fixed) predictors, a restriction on the variance–covariance matrix Σ is typically imposed such that the first diagonal element is 1. Absent this restriction, elements of w ij can simply be multiplied by any positive constant and the corresponding elements of Σ j adjusted accordingly to give the same likelihood for the data. In our situation, the predictor x is a latent quantity that is itself estimated along with the other parameters of the model. Therefore, further restriction is necessary in order to identify the model.
To see this, consider the simplified example of
 $$w=x_{1} \beta {\plus}x_{2} \lambda {\plus}{\varepsilon},$$
where w is an n×2 matrix, x 1 and x 2 the n×1 vectors that are independently drawn from a N(0,Ι) distribution, β and λ the 1×2 coefficient vectors, and ε the n×2 matrix drawn from a N(0,Ι) distribution independent of x 1 and x 2. This setup parallels the one used in Equation 3 above, but omits the intercept terms for convenience.Footnote 6 Given this model, we could define ξ=x 2 λ+ε and rewrite Equation 5 as
 $$w=x_{1} \beta {\plus}\xi ,$$
where
 $$\xi \,\sim\,N\left( {{\bf 0},\left[ {\matrix{ {\lambda _{1}^{2} {\plus}1} & {\lambda _{1} \lambda _{2} } \cr {\lambda _{1} \lambda _{2} } & {\lambda _{2}^{2} {\plus}1} \cr } } \right]} \right).$$
But this exercise could also be performed by letting ξ=x 1 β+ε, demonstrating the lack of identification of this model. Allowing the covariance matrices Σ j to be non-diagonal is analogous to allowing for a second latent dimension of political information. Moreover, because these covariance matrices are allowed to differ across questions, a potentially different second dimension would be estimated for each question j. It should be noted that the above example involves a situation in which the latent response propensity differences w are directly observed. In the present model, we only observe which element of w is largest for each respondent on a given question—an even less informative situation.
Allowing Σ j to be unrestricted, then, will result in an unidentified model. A natural identifying restriction is to fix Σ j to an identity matrix for each question j. In addition to identifying the model, it provides a useful partition of the variation in the latent response propensity differences w. Because Σ j =I, all of the systematic variation in w is assumed to be accounted for the latent knowledge levels x i . The only other component of these response propensity differences is independent random noise. In the standard MNP model, the error variance is identified (albeit often tenuously, see Keane Reference Keane1992) because the systematic portion of the latent propensities is restricted to be some linear combination of the observed predictors included in the model. Because the predictor used here is unobserved (estimated), the variation in the w due to knowledge levels and that due to the random errors are not separately identified.
Formally, fixing Σ j =I for a single question would define the latent political knowledge dimension x and allow Σ j for other questions to be estimated. This, however, would again be equivalent to estimating a two-dimensional model in the case of three response categories. Both because a single dimensional conceptualization of political knowledge is employed here and also because a model with two or more dimensions is only very weakly identified (recall that we do not actually observe the latent response propensity differences w, but only an indicator of which element is the largest for each respondent on each question), this approach is not used here. As discussed below, examination of the correlation between estimated response propensity errors can be used as a sort of check on this unidimensionality assumption. I therefore fix Σ j as a p−1×p−1 identity matrix for all questions j. To the extent that the latent errors appear to be uncorrelated, this suggests that the systematic variation in response propensities is well accounted for by the single dimension estimated for political knowledge, leaving only idiosyncratic independent noise in the observed responses.
The random errors in w, which are assumed to come from a bivariate normal distribution with mean 0 and variance I 2 under this restriction, were also examined for model runs in order to assess the reasonability of this assumption. These errors were quite consistent with the assumptions, showing little evidence of correlation between the correct and “don’t know” response options. This may be thought to suggest that the single political knowledge dimension estimated by the model accounts well for the variation in responses, leaving little other than random idiosyncratic (uncorrelated) errors.
A final consideration is the fact that the political knowledge levels x are not themselves identified. I follow the common strategy of estimating the model in this unidentified state and post-processing the results to impose the identification restriction across each iteration that the knowledge levels have a mean of 0 and a variance of 1 for the full sample and that higher values of x indicate higher levels of political knowledge.Footnote 7
I employ independent conditionally conjugate priors for the model’s unknown parameters:
 $$\left[ {\matrix{ {\alpha _{{jk}} } \cr {\beta _{{jk}} } \cr } } \right]\,\sim\,N({\bf b}_{0} ,{\bf B}_{0} ),$$
 $$x\,\sim\,N(\mu _{0} ,\sigma _{0}^{2} {\bf I}),$$
with the priors for α and β assumed to be independent across both questions j=1, …, m, and response options k=1, … , p−1. For all estimations below, I set b
0=0, B
0=100I, μ
0=0, and
 $$\sigma _{0}^{2} =1$$
.
Although the setup described above can be motivated as a utility model, it can also be thought of, as with the standard MNP, as simply a probability model for observational data. Just as a standard probit model can be used to analyze shipwreck deaths (even though passengers’ “utilities” for survival would almost certainly always be greater than those for drowning) or a standard MNP can be used to analyze a baseball batter’s chances of various outcomes in an at-bat (even though it seems unlikely that their “utility” for striking out or being thrown out at first would ever be higher than that for hitting a home run), the present model can be thought of one that simply analyzes the relationship between one’s political knowledge level and one’s probability of giving each type of response. The key difference here is that knowledge is estimated, rather than observed. In this way, the approach used here is closer to that of educational testing models where, although their decisions can be described in utilitarian terms, the actors being modeled would be expected to prefer to answer correctly rather than incorrectly. The model, then, is thought of as a probability model for the relationship between intelligence or knowledge and the likelihood of answering questions correctly or incorrectly (or in addition here, saying “don’t know”).
This setup models the relationship between respondents’ levels of political knowledge and their likelihood of giving each type of answer. These relationships, rather than those between other variables and response probabilities, speak directly to the level of knowledge suggested by correct, incorrect, and “don’t know” responses. Accordingly, the discrimination parameters in the model merit special attention. These parameters permit different items to tap political knowledge to different degrees. Moreover, because they vary across response type (correct, incorrect, or “don’t know”), they permit different responses to the same item to indicate different levels of knowledge.
Although the general model has been described above for the case of an arbitrary number (p) of alternatives, all of the analyses presented here involve three response categories representing correct, incorrect, and “don’t know” responses. Therefore, we have p equaling three and thus two categories for which we estimate discrimination and difficulty parameters. Because the baseline (which is the pth in the notation of Equations 1 through 4) response category is set to be the incorrect response for each question, the discrimination parameters for all other response categories will be estimated relative to this one. Therefore, positive values for discrimination parameters will imply that a given response category indicates higher levels of political knowledge than does an incorrect response for that question. Conversely, a negative discrimination parameter would imply that the response type implies less information than does an incorrect answer. Because the central question here is how much knowledge “don’t know” responses indicate, these discrimination parameter estimates will be the main focus.
The model is estimated using a Gibbs sampler, which draws from the posterior distribution over all the model’s unknown parameters.Footnote 8 The details of this procedure can be found in Appendix A.
Political Knowledge and the ANES
I begin by estimating the model with data from the 1988 ANES. I focus on the ANES because most studies of political knowledge have relied on it, and on the 1988 ANES in particular because it contains an unusually large set of knowledge items with a very high percent of respondents having non-missing values for all questions. Four of these items are closed-ended questions about recent trends (in defense spending, unemployment, inflation, and the deficit), two are closed-ended questions about party control of Congress, and seven are open-ended items that asked subjects to identify the offices held by prominent politicians (Yasser Arafat, Mikhail Gorbachev, Ted Kennedy, William Rehnquist, George Shultz, Margaret Thatcher, and Jim Wright). A small fraction of subjects were not asked some questions, typically because they were not available for the post-election interviews in which most questions were asked. Because these people represent a small proportion of the respondents, and because the vast majority of them had missing values for all or most questions, only respondents who have non-missing responses for all questions are analyzed here.Footnote 9 The text of all 13 questions is listed in Appendix section B.1.
The baseline response category for each question is chosen to be incorrect, which simplifies interpretation of the resulting estimates. This restriction implies that the discrimination parameter for correct responses for each question j, which for clarity can be called
 $$\beta _{j}^{C} $$
, indicates the increase in the propensity to give a correct answer relative to an incorrect answer that results from moving one unit (one sample standard deviation) higher on the political knowledge scale. Similarly, the discrimination parameters for “don’t know” responses, now called
 $$\beta _{j}^{{{\rm DK}}} $$
, indicates the increase in the propensity to give an answer of “don’t know” relative to an incorrect answer that results from a one unit increase in x. The intercepts α, often called “difficulty parameters,” indicate the relative propensities of giving correct or “don’t know” responses for people with political knowledge levels of 0 (the sample average).Footnote
10
The main focus of attention will be on the “don’t know” response discrimination parameters. Positive values of
 $$\beta _{j}^{{{\rm DK}}} $$
imply that “don’t know” responses for the corresponding question are indicative of more knowledge than are incorrect answers. Negative values of
 $$\beta _{j}^{{{\rm DK}}} $$
would mean that “don’t know” responses suggest lower levels of knowledge than incorrect answers. Although not of central interest here, estimates of the difficulty parameters
 $$\alpha _{j}^{I} $$
and
 $$\alpha _{j}^{{{\rm DK}}} $$
for each question, which are related to the relative baseline likelihoods of giving each response, are also presented.
Most obviously, we would expect that the response type that indicates the most knowledge is correct, which would imply that
 $$\beta _{j}^{C} $$
should be greater than both
 $$\beta _{j}^{I} $$
and
 $$\beta _{j}^{{{\rm DK}}} $$
. The common strategy of measuring knowledge as the percent of questions answered correctly, thus lumping incorrect and “don’t know” responses together, implicitly assumes that these two response types suggest the same level of knowledge. If this were the case, their discrimination parameters
 $$\beta _{j}^{I} $$
and
 $$\beta _{j}^{{{\rm DK}}} $$
should be equal. By contrast, if “don’t know” responses reflected “partial knowledge” as is sometimes suggested, then we should see
 $$\beta _{j}^{C} \gt \beta _{j}^{{{\rm DK}}} \gt \beta _{j}^{I} $$
. Finally, if we observe
 $$\beta _{j}^{C} \gt \beta _{j}^{I} \gt \beta _{j}^{{{\rm DK}}} $$
, this would suggest that don’t know responses actually reveal less political knowledge not only than do correct responses but also incorrect ones. The most important aspect of these results, then, should be the relative size of the discrimination parameters for incorrect and don’t know responses.
Figure 2 displays the discrimination and difficulty parameter estimates for the 13 knowledge questions in the 1988 ANES.Footnote
11
As expected, the discrimination parameters for correct responses
 $$\left( {\beta _{j}^{C} } \right)$$
are estimated to be positive in every case, indicating that correct answers are associated with higher levels of knowledge than are incorrect answers. The estimates for “don’t know” responses
 $$\left( {\beta _{j}^{{{\rm DK}}} } \right)$$
, by contrast, are negative in every case, suggesting that “don’t know” responses are associated with lower levels of political knowledge not only than correct answers but also incorrect ones. For some questions, such as those about Gorbachev and Thatcher, there is a strong negative relationship between political knowledge and the probability of saying “don’t know.” For other items, such as those about inflation and the deficit, the relationship is only weakly negative. But the most important variation in Figure 2 is not between items but between response types. Across all questions, the discrimination parameters for correct responses are estimated to be positive with exceedingly high probability, whereas those for “don’t know” responses are estimated to be negative with near certainty.Footnote
12
Question parameters for 1988 American National Election Studies (ANES) knowledge items Note: black dots represent discrimination parameters
 $$\beta _{j}^{C} $$
(left pane) and difficulty parameters
 $$\alpha _{j}^{C} $$
(right pane) for correct response options. Gray dots represent discrimination parameters
 $$\beta _{j}^{{{\rm DK}}} $$
(left pane) and difficulty parameters
 $$\alpha _{j}^{{{\rm DK}}} $$
(right pane) for “don’t know” response options. Vertical line segments indicate 95 percent highest posterior density regions (HPDs). A positive discrimination parameter indicates that a given type of response to a question is associated with more political knowledge than an incorrect response, whereas negative discrimination parameters indicate that a response type reflects less knowledge than an incorrect answer. Discrimination parameters for correct responses are all estimated to be positive, indicating that these responses imply more knowledge than would an incorrect response. Discrimination parameters for “don’t know” responses are all negative, implying that these responses are indicative of less knowledge than both correct and incorrect answers. Difficulty parameter values are not of direct interest for the question asked here but are presented in the interest of completeness.

I also repeat this analysis using the political knowledge items from the 1992 and 1996 ANES studies.Footnote 13 The text of these survey questions are given in Appendix sections B.2 and B.3. These surveys are used because they have a relatively large number of political knowledge items (though not as many as the 1988 ANES) and also because a very high percentage of respondents provided answers (correct, incorrect, or “don’t know”) to all of these questions. Figure 3 reports the results, which are quite similar to those from the 1988 study. For both the 1992 and 1996 ANES data, discrimination parameters for correct responses are consistently estimated to be positive, whereas those for “don’t know” responses are negative. This again implies that respondents who say they “don’t know” an answer, rather than those who offer an incorrect response, are typically the least informed.
Discrimination parameters for knowledge items in the 1992 and 1996 American National Election Studies (ANES) Note: black dots represent discrimination parameters
 $$\beta _{j}^{C} $$
(left pane) and difficulty parameters
 $$\alpha _{j}^{C} $$
(right pane) for correct response options. Gray dots represent discrimination parameters
 $$\beta _{j}^{{{\rm DK}}} $$
(left pane) and difficulty parameters
 $$\alpha _{j}^{{{\rm DK}}} $$
(right pane) for “don’t know” response options. Vertical line segments indicate 95 percent highest posterior density regions (HPDs). A positive discrimination parameter indicates that a given type of response to a question is associated with more political knowledge than an incorrect response, whereas negative discrimination parameters indicate that a response type reflects less knowledge than an incorrect answer. Discrimination parameters for correct responses are all estimated to be positive, indicating that these responses imply more knowledge than would an incorrect response. Discrimination parameters for “don’t know” responses are all negative, implying that these responses are indicative of less knowledge than both correct and incorrect answers. Difficulty parameter values are not of direct interest for the question asked here but are presented in the interest of completeness.

Across all three of the ANES studies analyzed here, which together include a total of 33 political knowledge items, all of the discrimination parameters for correct items were estimated to be positive and all of the discrimination parameters for “don’t know” responses were estimated to be negative. In fact, in only one case—the unemployment question on the 1992 ANES that nearly 80 percent of respondents answered correctly—did the 95 percent highest posterior density region (HPD) for any of these discrimination parameters overlap 0. Although the finding that correct responses suggest higher levels of political knowledge than incorrect ones is hardly surprising, the finding that “don’t know” responses are associated with lower levels of political knowledge than both correct and incorrect answers is not only at odds with conventional practice, which awards the same score to incorrect and “don’t know” responses, but is even more strongly at odds with claims that people who say “don’t know” in response to knowledge questions are typically more knowledgeable than those who give the wrong answers.Footnote 14
Does the Meaning of “Don’t Know” Vary by Respondent Personality?
As discussed above, a central contention of some previous works on the measurement of political knowledge has been that “don’t know” responses may indicate different levels of knowledge for different types of people. In particular, it has been claimed that personality plays a large role in this process (see e.g., Mondak and Halperin Reference Mondak and Halperin2008; Mondak Reference Mondak2010). For example, these arguments state that respondents who are more extroverted may provide responses to a question (guess) even when they have little or no idea of the correct answer, whereas introverts may say “don’t know,” unless they are virtually certain of their answer. It is argued that this process can bias the measurement of political knowledge.
To explore the role of personality in knowledge measurement, we focus on the Big Five, the model of personality that has commanded most attention from psychologists in the last three decades (Funder Reference Funder2001). The claim underpinning Big Five research is that personality can be partitioned into five distinct traits: openness to experience, conscientiousness, extroversion, agreeableness, and neuroticism. The Big Five is now the most widely used model of personality in the social sciences (Funder Reference Funder2001; Gosling, Rentfrow and Swann Reference Gosling, Rentfrow and Swann2003, 506), and other traits can be explained in significant part as combinations of Big Five traits (Ozer and Reise Reference Ozer and Reise1994).
Two of the Big Five traits—extroversion and agreeableness—seem most likely to distinguish people for whom “don’t know” responses suggest an unusually high degree of knowledge. Extroversion may make people talkative and thus likely to offer substantive responses to questions even when they have limited knowledge. By contrast, introverts—those who score low on measures of extroversion—may be likely to say “don’t know” under the same conditions (see Lovallo and Pishkin Reference Lovallo and Pishkin1980; Furnham and Medhurst Reference Furnham and Medhurst1995; Swann and Rentfrow Reference Swann and Rentfrow2001). Introverts may therefore be a distinct group of people for whom “don’t know” responses reflect an unusually high degree of knowledge. Agreeableness might have the same effect: agreeable subjects who intuit that the interviewer wants them to give a substantive answer might do so even when they have limited knowledge, whereas less agreeable respondents might say “don’t know” under the same conditions. In this case, less agreeable subjects would also be a distinct group of people for whom “don’t know” responses reflect an unusually high degree of knowledge.
To test these hypotheses, we need a data set that contains measures of both political knowledge and Big Five personality traits. The 2008 Cooperative Campaign Analysis Project (CCAP) meets this requirement. The CCAP is an internet survey of 18,250 registered voters; collectively, these voters closely match the population of registered voters in the United States in 2008 with respect to age, race, gender, education, metropolitan area, party ID, and self-reported ideology (see Ansolabehere and Rivers Reference Ansolabehere and Rivers2013 for more information). The full text of all questions along with further information about its design and sampling procedure is in Appendix section B.4.
The CCAP contains 14 factual questions about politics. All are closed-ended. For 11 of the questions, a prominent figure is named and subjects are asked whether he is a Senator, a “House Member,” or neither. (The figures are John Boehner, Susan Collins, John Dingell, Bill Gates, Ted Kennedy, Dennis Kucinich, Jon Kyl, Patrick Leahy, Nancy Pelosi, Condolezza Rice, and Henry Waxman.) Subjects are also asked to identify the correct description of Guantanamo Bay from a set of choices (e.g., “Fidel Castro is in a hospital there and is quite ill”), whether America imports more manufactured goods than it did a couple of years ago, and whether the dollar had become stronger or weaker in the past year.
The CCAP also includes the Ten-Item Personality Inventory (TIPI), a battery of items that tap Big Five personality traits. The items ask subjects how strongly they agree or disagree that different pairs of traits apply to them:
-
1. extroverted, enthusiastic
-
2. critical, quarrelsome
-
3. dependable, self-disciplined
-
4. anxious, easily upset
-
5. open to new experiences, complex
-
6. reserved, quiet
-
7. sympathetic, warm
-
8. disorganized, careless
-
9. calm, emotionally stable
-
10. conventional, uncreative
For each trait pair, subjects could choose from seven response options ranging from “disagree strongly” to “agree strongly.” Responses were coded and summed to create indicators of the extent to which subjects exhibited each Big Five trait.Footnote 15 Measures of personality that are based on the TIPI correspond closely to measures based on much larger batteries (Gosling, Rentfrow and Swann Reference Gosling, Rentfrow and Swann2003).
To examine the possibility that “don’t know” responses mean different things for respondents of different personality types, I estimate the MNP model of political knowledge separately for ten subgroups: the groups of subjects whose TIPI answers place them in the upper or lower eights of the distributions of each of the Big Five, including ties.Footnote 16 Looking only at the most extreme 25 percent of respondents on each of the five personality traits allows for the isolation of high- and low-trait groups on each factor, whereas, because of the survey’s large sample size, also keeping enough respondents per subgroup to obtain relatively precise estimates of the item parameters. The ten subgroups each contain between 1738 and 3638 respondents.Footnote 17 This strategy was chosen instead of others—for example, modeling the effects of personality with interaction terms—for two reasons. First, it is not clear how personality might alter the relationship between knowledge and respondent answers. The choice of a specific functional form for modeling these effects would therefore be somewhat arbitrary. By contrast, separately estimating the MNP political knowledge model for “high” and “low” levels of each personality trait does not require assumptions about the specific nature of possible personality effects. Moreover, comparisons between “high” and “low” personality subgroups are a straightforward way of detecting such effects. If we detect them, we can proceed to further investigations of their nature.Footnote 18
The black and gray dots in each panel of Figure 4 show estimated discrimination parameters for correct and “don’t know” responses, respectively.Footnote 19 Unsurprisingly, the estimates for correct responses are overwhelmingly positive for every personality subgroup, indicating that correct answers imply a significantly higher amount of political knowledge than do incorrect answers. The estimates for “don’t know” responses are overwhelmingly negative for each subgroup of these Big Five traits. This suggests that the main result of Figures 2 and 3—“don’t know” responses reflect even less knowledge than incorrect answers—holds not just on average across all types of respondents but for a wide range of personality types. In particular, it holds strongly for introverts and for those who score low on agreeableness—exactly the people for whom it seems most likely that the main result would not hold.
Discrimination parameters and personality traits in the 2008 Cooperative Campaign Analysis Project Note: each panel plots discrimination parameters for subjects scoring in the highest or lowest eighth (including ties) of a given Big Five trait. Black dots are discrimination parameter estimates for correct responses
 $$(\beta _{j}^{C} )$$
and gray dots are discrimination parameter estimates for “don’t know” responses
 $$(\beta _{j}^{{{\rm DK}}} )$$
. Vertical line segments indicate 95 percent highest posterior density regions (HPDs). HPDs for some estimates are hard to discern because they are small.

This result is weakest for the questions about Condolezza Rice, Guantanamo Bay, imports of manufactured goods, and the strength of the US dollar. These questions differed in several ways from others in the battery: they asked about different topics, had different response options, and appeared later in the survey. Any of these factors may account for the questions’ relatively high “don’t know” discrimination parameters; however, even for these items, “don’t know” discrimination parameter estimates are negative in all but three of the 140 cases (roughly 98 percent), with all of the HPDs for the positive estimates overlapping 0. In fact, all but nine of the “don’t know” discrimination parameters (roughly 94 percent) have 95 percent HPDs that are entirely below 0. Furthermore, all of the discrimination parameters for correct responses are estimated to be positive and only one has a 95 percent HPD that overlaps 0.
Figure 5 presents the estimated difficulty parameters for correct and “don’t know” responses by personality type. Although these parameters are not of central interest in determining the level of knowledge implied by each response type, it is clear that they are estimated to have very similar values across personality types for both correct and “don’t know” responses. The difficulty parameter estimates for the ANES data (presented in Figures 2 and 3) appear somewhat different than those for the CCAP. The likely explanation is that while the CCAP contained only closed-ended knowledge questions, the ANES data sets used here included both closed- and open-ended items. The discrimination parameter estimates vary strongly across the open-ended ANES questions, but show a relatively strong pattern—with the parameter for correct responses being larger than the corresponding “don’t know” parameter—across both the ANES and CCAP data sets.
Difficulty parameters and personality traits in the 2008 Cooperative Campaign Analysis Project Note: each panel plots discrimination parameters for subjects scoring in the highest or lowest eighth (including ties) of a given Big Five trait. Black dots are difficulty parameter estimates for correct responses
 $$(\alpha _{j}^{C} )$$
and gray dots are difficulty parameter estimates for “don’t know” responses
 $$(\alpha _{j}^{{{\rm DK}}} )$$
. Vertical line segments indicate 95 percent highest posterior density regions (HPDs). HPDs for some estimates are hard to discern because they are small.

The general trend of these personality-based analyses, therefore, remains clear: across items and personality types, knowing more about politics makes subjects more likely to answer incorrectly, less likely to answer “don’t know.” This again suggests that “don’t know” responses are indicative of the lowest amounts of political information possible—lower even than incorrect answers. Moreover, it demonstrates that personality, at least in terms of differences between respondents with high and low levels of each of the heavily studied Big Five personality types, does not meaningfully affect the amount of political information indicated by correct, incorrect, and “don’t know” responses.
How Different are Estimates of Political Knowledge Under Different Approaches?
The central question addressed here has been how much political knowledge is implied by correct, incorrect, and “don’t know” responses, in particular, whether or not “don’t know” responses should be thought to indicate partial knowledge—something between what is implied by incorrect and correct answers. The results presented above point to a clear answer to this question: “don’t know” responses do not indicate more knowledge than incorrect responses, in fact they indicate less. Although standard binary item response models typically either assume that “don’t know” responses are equivalent to incorrect ones or drop “don’t know” responses, treating them as missing, the MNP item response model used here allowed for the estimation of how “knowledgeable” each of these response types is.
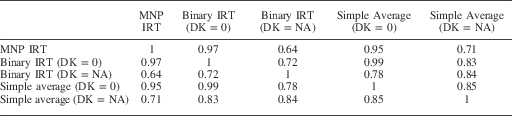
A subsequent question, then, is how similar political knowledge estimates would look under different approaches. To answer this question, I compare the political knowledge estimates (posterior means for x i s) for each respondent in the 1988 ANES using the MNP model as well as using a binary probit-link item response model and a simple average (the proportion of questions answered correctly by each respondent). For each of the later two approaches, I produce two sets of estimates: one treating “don’t know” responses as incorrect and another treating them as missing. Table 1 shows the correlations between these different estimates.
Correlations Between Knowledge Estimates for 1988 ANES

Note: entries are correlations between estimates of political knowledge estimates. Binary IRT models are estimated using the ideal function in the pscl R library (Jackman Reference Jackman2009), whereas simple average estimates are calculated by coding correct responses as 1, incorrect responses as 0, and “don’t know” responses as specified (either 0 or missing depending on the process used), and then averaging up each respondent’s score across all questions, dropping missing values.
ANES=American National Election Studies; MNP=multinomial probit; IRT=item response theory.
Estimates of political knowledge from the MNP model are most similar to the binary item response theory (IRT) model in which “don’t know” responses are treated as incorrect, with these two measures having a correlation of 0.97. This indicates that although “don’t know” responses indicate less political knowledge than do incorrect responses, a binary item response model looking at whether respondents provide correct answers or not (thus combining incorrect and “don’t know” responses) results in very similar estimates to the MNP model that considers each of the three response types separately. Furthermore, we see that taking a simple average (calculating the proportion of correct answers for each respondent), while treating DKs as incorrect, produces nearly as high a correlation (0.95) as estimating a binary IRT model with the same categorizations. This suggests that although there exists clear variation in the difficulty and discrimination across different questions (as shown in Figure 2), taking this into account does not have a strong effect on the estimated knowledge levels.
Political knowledge estimates treating “don’t know” responses as missing values show much lower correlations with the MNP estimates, whether based on IRT or simple averaging. These lower correlations should not be surprising given that the missing value approach discards information from all “don’t know” responses. Treating “don’t know” responses as “partially informed,” as has been advocated by some, would entail either assigning some number between 0 and 1 to these answers before calculating simple averages or perhaps positing a full statistical model in which “don’t know” responses are more informed than incorrect responses. In either case, the resulting estimates would have lower correlations with the MNP estimates produced here than those treating “don’t know” responses as incorrect. In fact, the correlations between the MNP and simple average estimates could be maximized by assigning a number <0 to “don’t know” responses in the averaging procedure (although the largest possible increase is quite small—about 0.01).
The fact that simpler methods can produce estimates similar to those of the more complex MNP model should not imply that there are no clear benefits to using this approach. For example, model-based estimates allow for the quantification of uncertainty, which may be important if knowledge estimates are to be used either as independent or dependent variables in subsequent analyses. Using a full statistical model also accommodates straightforward hypothesis testing both dealing with item characteristics and individual knowledge levels. Most importantly for the present study, item response modeling, specifically the multinomial setup, was used to learn about the meaning of the various response types, something that would have to be assumed, rather than tested, when using simple averages.
Discussion
Several recent works have charged that conventional studies understate levels of political knowledge in the mass public (Mondak Reference Mondak1999; Krosnick et al. Reference Krosnick, Lupia, DeBell and Donakowski2008; Gibson and Caldeira Reference Gibson and Caldeira2009). In particular, these works charge that some people who know the answers to political knowledge questions may say that they don’t know, implying that “don’t know” responses should be treated as suggesting some level of partial knowledge rather than a lack of knowledge. By treating “don’t know” and incorrect responses equivalently, these authors argue that conventional knowledge measurement methods may overlook “hidden knowledge” in the former type of response and thereby understate the public’s level of political knowledge. It has also been argued that the meaning of “don’t know” responses—in particular how much knowledge they indicate relative to correct or incorrect answers—may differ systematically based on respondents’ personality traits (Mondak Reference Mondak2010).
I bring a new statistical model to bear on these questions. Unlike other—typically implicit—models that have underpinned political knowledge measurement, this model does not rest on any a priori assumption about the level of knowledge represented by “don’t know” responses. I estimate this model with data from multiple ANES studies as well as the large-scale nationally representative 2008 CCAP survey and consistently find that “don’t know” responses indicate less knowledge, not more, than incorrect answers. This finding is also robust to differences in personality traits, suggesting that personality does not play a meaningful role in altering the meaning of “don’t know” responses. The findings presented here are in sharp disagreement with key conclusions reached by Mondak and others, but are largely compatible with those of Sturgis, Allum and Smith (Reference Sturgis, Allum and Smith2008).
In addition to the substantive findings presented here, the general modeling approach suggests a useful framework for the analysis of different response types on common survey items. For questions in which a specific ordering of response options is not obvious, researchers can use the approach outlined here to investigate, rather than assume, which options reflect higher or lower values of some unobserved latent trait. Potential applications could include estimating ideology based on questions with multiple responses or aiding in the construction of response options to include those consistent with a wide range of different latent trait values. This approach may be useful both to scholars seeking to design appropriate response options, perhaps based on pilot tests of different possibilities, or to those who wish to examine existing survey data whose response categories are already determined. These and other techniques could also be applied to investigate potential variation in the meaning of different response categories across various survey situations, including factors such as inattention or respondent fatigue or interview modes such as in person, telephone, or online.