Introduction
It is now widely accepted that there is spatial variation in the incidence of psychotic disorders between different countries, and within different regions of the same country (McGrath et al. Reference McGrath, Saha, Welham, El Saadi, MacCauley and Chant2004; Kirkbride et al. Reference Kirkbride, Errazuriz, Croudace, Morgan, Jackson, Boydell, Murray and Jones2012). Furthermore, there is evidence that neighbourhood-level factors, specifically social deprivation, social fragmentation, social capital and population density, could at least partially explain this spatial variation. Higher levels of social deprivation have been associated with a higher incidence of psychotic disorders in the UK, (Croudace et al. Reference Croudace, Kayne, Jones and Harrison2000; Boydell et al. Reference Boydell, Van, McKenzie and Murray2004; Kirkbride et al. Reference Kirkbride, Fearon, Morgan, Dazzan, Morgan, Murray and Jones2007a , Reference Kirkbride, Morgan, Fearon, Dazzan, Murray and Jones b ; Bhavsar et al. Reference Bhavsar, Boydell, Murray and Power2014), Canada (Anderson et al. Reference Anderson, Fuhrer, Abrahamowicz and Malla2012) and rural Ireland (Omer et al. Reference Omer, Kirkbride, Pringle, Russell, O'Callaghan and Waddington2014). Sariaslan et al. (Reference Sariaslan, Larsson, D'Onofrio, Langstrom, Fazel and Lichtenstein2015) conducted a cohort study in a population of 2.4 million from Sweden and found a higher rate of schizophrenia in the most deprived neighbourhoods (unadjusted odds ratio = 1.64). Another consistent finding is a higher incidence of psychotic disorders in areas of higher population density (Kelly et al. Reference Kelly, O'Callaghan, Waddington, Feeney, Browne, Scully, Clarke, Quinn, McTigue, Morgan, Kinsella and Larkin2010).
Other neighbourhood-level characteristics, such as social fragmentation and social capital, have received less attention but may further the understanding of the mechanism by which the wider social environment could be involved in the aetiology of psychotic disorders (Allardyce & Boydell, Reference Allardyce and Boydell2006). Social capital has been described as the ‘glue that holds societies together’ (McKenzie et al. Reference McKenzie, Whitley and Weich2002) and it can be divided into an active component, e.g. participation and a cognitive/perceptual component, such as trust in neighbours (De Silva et al. Reference De Silva, McKenzie, Harpham and Huttly2005). A lower incidence of schizophrenia has been found in neighbourhoods with higher social capital (Kirkbride et al. Reference Kirkbride, Morgan, Fearon, Dazzan, Murray and Jones2007b ). The term ‘social fragmentation’ was derived from the concept of ‘anomie’, which refers to the transience of the population in a community (Congdon, Reference Congdon1996) and it is associated with the mobility of the population, proportion of rented property and single people. Higher social fragmentation has been associated with a higher incidence of schizophrenia (van Os et al. Reference Van Os, Driessen, Gunther and Delespaul2000) and higher admission rates for individuals with a first episode of psychosis (FEP) (Allardyce et al. Reference Allardyce, Gilmour, Atkinson, Rapson, Bishop and McCreadie2005).
The majority of the research to date on the association between neighbourhood level factors and psychotic disorders has focused on the incidence rates of psychotic disorders. Another important aspect of psychotic disorders is the duration of untreated psychosis (DUP). This is an important factor as it is strongly associated with outcome, with a shorter DUP being associated with fewer psychotic symptoms, less depression, higher functioning and better quality of life at follow-up (Marshall et al. Reference Marshall, Lewis, Lockwood, Drake, Jones and Croudace2005). Furthermore, the DUP is potentially modifiable and a recent systematic review suggested that intensive public awareness campaigns could be the most promising method to reduce delays (Lloyd-Evans et al. Reference Lloyd-Evans, Crosby, Stockton, Pilling, Hobbs, Hinton and Johnson2011). Therefore, it would be valuable to know whether there is a spatial variation in the DUP and the characteristics of neighbourhoods that might influence the DUP. This might facilitate educational campaigns being more focused to areas of higher need. Surprisingly, despite the importance of this issue there has been only one study addressing this research question and it was found that the DUP did not vary across 33 neighbourhoods in Southeast London (Kirkbride et al. Reference Kirkbride, Lunn, Morgan, Lappin, Dazzan, Morgan, Fearon, Murray and Jones2010). However, the findings of this study may not be generalizable to other less densely populated regions or countries.
Previous studies having tended to examine the association between one or two neighbourhood factors and the association between the incidence of psychotic disorders. Therefore, the first aim of this study was to determine whether the incidence of FEP is associated with the level of social deprivation, social fragmentation, social capital and population density in the neighbourhood of residence at the time of presentation. Second, this study aimed to determine whether the DUP is associated with these neighbourhood-level characteristics.
Method
Setting
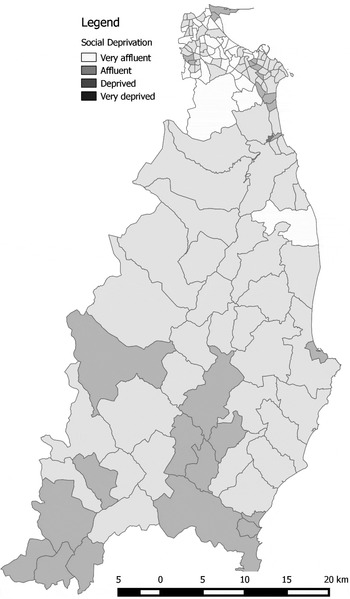
This study was based in an early intervention (EI) for psychosis service that encompasses three mental health services in South Dublin and Co. Wicklow and covers a total population of approximately 377 000. The total population aged between 15 and 65 years was 266 212 (130 311 males and 135 901 females) which represents the ‘at-risk population’. The catchment area encompasses 139 electoral divisions (Fig. 1). The mean population of the electoral divisions was 2716 (s.d. = 2241), the median was 2386 and the population of electoral divisions ranged from 187 to 13 925. A comparison of the population of the catchment area and the rest of the Republic of Ireland in regards to marital status, education levels, social class and country of birth is presented in online Supplementary Table S1 and was obtained from the 2006 Census of Ireland. One of the main differences in the catchment area was that there was a higher proportion of individuals aged 15 to 64 years in social classes I to III (professionals and managers) compared with the rest of Ireland (63.3% v. 48.1%). There was also a slightly higher proportion of migrants in the catchment area compared with the rest of Ireland (17.2% v. 14.4%).
Electoral divisions of the catchment area.

Participants
We included all individuals with a FEP who presented to this service between August 2006 and August 2011. This period of recruitment corresponded with the census cycle in Ireland which is completed every 5 years. The service receives referrals of all cases of suspected FEP of persons between the ages of 16 and 65 years and receives referrals from the local mental health service, general practitioners and emergency departments.
Inclusion and exclusion criteria
We included all individuals who were determined to have a FEP according to Diagnostic and Statistical Manual of Mental Disorders, fourth edition (DSM-IV) criteria, except those with a diagnosis of psychosis due to a general medical condition. Participants were also required to be resident in the catchment area at the time of presentation and for there to be sufficient information available on their place of residence. We defined a FEP as an individual who had no previous history of a psychotic episode and had not received antipsychotic medication for more than 30 days prior to the referral. We included individuals with co-morbid substance misuse, substance dependence or co-morbid personality disorder.
Instruments
The Structured Clinical Interview for DSM-IV (SCID) assessment was used to establish the diagnosis and the SCID has been shown to have good reliability and validity in the assessment of psychotic disorders (First et al. Reference First, Spitzer, Gibbon and Williams2002).
The DUP was established using the Beiser scale and was recorded in months and it was defined as the length of time between the onset of prominent psychotic symptoms and the date of first presentation for treatment (Beiser et al. Reference Beiser, Erickson, Fleming and Iacono1993). The Beiser scale was completed from interviews with families and participants.
Measures of neighbourhood characteristics
Social deprivation
Social deprivation was measured using the Pobal Haase–Pratschke deprivation index (HP index) in which three dimensions of affluence/disadvantage are used: demographic profile, social class composition and labour market situation (Haase & Pratschke, Reference Haase and Pratschke2012). Demographic profile was measured using five indicators: the proportion increase in population over the previous 5 years, the percentage of the population aged under 15 or over 64 years of age, the percentage with a primary school education only, the percentage with a third-level education, the percentage of households with children aged under 15 years and headed by a single parent and the mean number of persons per room. Social class composition was measured by five indicators: the percentage of the population with a primary school education only, the percentage with a third-level education, the percentage of households headed by professionals or managerial and technical employees, the percentage of households headed by semi-skilled or unskilled manual workers, including farmers with less than 30 acres and the mean number of persons per room. The labour market situation examines unemployment rates and it is measured by four indicators: the percentage of households headed by semi-skilled or unskilled manual workers, the percentage of households with children aged under 15 years and headed by a single parent, and the male and female unemployment rate. The HP index has been used to guide social policy in Ireland and has been used to identify social needs such as housing, education and areas in need of investment.
For all of the electoral divisions in Ireland (n = 3409), the mean of the relative HP index scores in 2006 was −1.34 with a standard deviation of 6.24. There were eight levels of social deprivation that ranged from very affluent to extreme disadvantage and each interval represented one standard deviation of the deprivation index scores. These eight levels were collapsed into four levels.
The level of unemployment in the area of residence is a component of the construct of social deprivation; however, it was investigated whether the level of unemployment in the neighbourhood of residence was associated with the incidence of psychotic disorders. The proportion of individuals unemployed in electoral divisions across the Republic of Ireland ranged from 0% to 93.4%, the 25th percentile corresponded to 3.79%, the median was 5.45% and the 75th percentile corresponded to 8.00%. Four levels of unemployment were determined according to the quartiles of unemployment in the electoral divisions across the Republic of Ireland.
Social fragmentation
The measure of social fragmentation was the same as that used by Allardyce et al. (Reference Allardyce, Gilmour, Atkinson, Rapson, Bishop and McCreadie2005), which was devised by Congdon et al. (Reference Congdon1996). The measure consists of four factors: the proportion of privately rented households, single-person households, unmarried persons and the population change from the previous census and this information was obtained the 2006 census of Ireland. Z scores were calculated for each of the factors from the number of standard deviations above or below the mean. Positive Z scores represented more socially fragmented areas and negative Z scores represented less social fragmented areas in three of the factors: private rented accommodation, single person households and unmarried persons. For the factor of population change, negative Z scores were converted to positive scores, as this factor represented any change in population between the two census periods. The social fragmentation index was devised for all electoral divisions in the Republic of Ireland and the Z scores ranged from −5.78 to 19.74 in the electoral divisions. The 25th percentile corresponded to −1.93, the median was −0.76 and the 75th percentile corresponded to 0.76. Four levels were devised according to the quartiles of social fragmentation across the electoral divisions of the Republic of Ireland.
Social capital
The proportion of individuals engaged in voluntary work in each electoral division was taken as a proxy measure of social capital. This method of using voluntary work as a proxy measure of social capital has been utilized in previous research (Brown et al. Reference Brown, Gary, Greene and Milburn1992). For this study information collected in the 2006 census on voluntary work in charitable organizations, religious or church activities, sporting organizations, political organizations and other voluntary work was utilized. The median proportion of the population who volunteered within each electoral division throughout Ireland (total n = 3409) was 19.21% and the 25th quartile was 16.16% and the 75th percentile was 22.34%. Four levels of social capital were devised according to the quartiles of the proportion of volunteers in each electoral division across the Republic of Ireland.
It was hypothesized that there would be a higher incidence of psychotic disorders in the neighbourhoods with the lowest social capital; therefore the neighbourhoods with the highest social capital (highest proportion of volunteering) was chosen to be the reference range. However, there were only two neighbourhoods with the highest social capital represented in the catchment area and therefore neighbourhoods with the highest and second highest level of social capital were chosen to be the reference range (as this provided a total of 14 neighbourhoods to act as the reference range).
Population density
Population density was determined from dividing the total population in the electoral division by the area of electoral division. The population density of the electoral divisions in the Republic of Ireland ranged from 0 to 18 792 persons per km2, the 25th quartile corresponded to 17.3 persons per km2, the median was 29.3 persons per km2 and the 75th percentile corresponded to 79.7 persons per km2. Four levels of population density were determined according to the quartiles of population density in the electoral divisions across the Republic of Ireland.
Geocoding
The residential address at the time of first contact was geocoded to their respective electoral division as the neighbourhood unit of analysis.
Statistical analysis
We used age-standardized incidence rates (SIRs) that allow for the effects of age distribution and to compare incidence in different geographical areas. We employed the direct method of age standardization and the general population aged between 15 and 65 years was selected as the standard population. Direct SIRs were calculated using the Epitools program within R (https://cran.r-project.org/web/packages/epitools/index.html). Incidence rate ratios (IRRs) were calculated by conducting Poisson regression using Stata version 14 (USA). The Kruskal–Wallis test, a non-parametric test, was used to determine if the median differed for categorical variables with more than two groups.
The mean number of counts (cases) in each electoral division was 2.1 (s.d. = 2.3) and the variance was 5.3 (calculated from standard deviation squared), indicating that the variance far exceeds the mean. There would be an expected number of counts of zero of 13.5% of electoral divisions; however, 33.8% (n = 47) of electoral divisions had counts of zero, indicating that the data are over-dispersed. Therefore, in order to account for this over-dispersion of zero counts, a zero-inflated Poisson regression model was performed using the zip command in Stata version 14 (USA).
Ethical approval
Ethical approval for the collection of data utilized in this study was provided by each of the catchment areas’ Ethics Committee.
Results
Participants
During the period of August 2006 to August 2011, 361 individuals were diagnosed with a FEP in the service. A total of 11.1% (n = 40) were found to be living outside of the catchment areas, 0.8% (n = 3) were of no fixed abode and there was insufficient information for 4.4% (n = 16) regarding their place of residence. In all, 10 individuals had a diagnosis of psychotic disorder due to a general medical condition and they were excluded from the analysis.
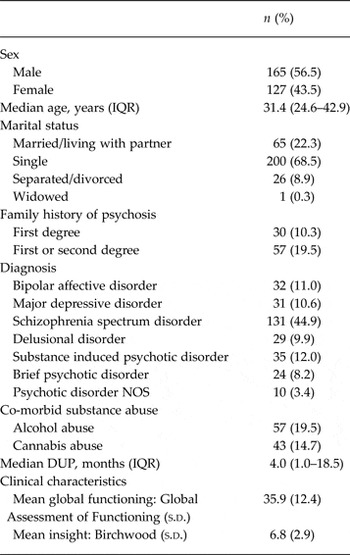
Therefore, there was a total of 292 cases of FEP confirmed to be resident in the catchment areas during the study period and, of these, 56.5% (n = 165) were male and 43.5% (n = 127) were female. A total of 44.9% (n = 131) had a diagnosis of schizophrenia or schizophreniform disorder and 11.0% (n = 32) had a diagnosis of bipolar affective disorder. The demographic and clinical characteristics of the participants are presented in Table 1. Over three-quarters (77.4%, n = 226) of the cohort consisted of individuals with a diagnosis of a non-affective psychotic disorder.
Demographic and clinical characteristics of participants

Data are given as number of participants (percentage) unless otherwise indicated.
IQR, interquartile range, NOS, not otherwise specified; DUP, duration of undiagnosed psychosis; s.d., standard deviation.
The total crude incidence rate of FEP was 21.94 cases per 100 000 person-years, the male incidence rate was 25.32 per 100 000 person-years and for females it was 18.69 per 100 000 person-years.
Neighbourhood-level factors and the incidence of FEP
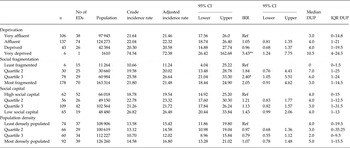
The incidence rates (crude and age standardized) of FEP and the age-standardized rate ratios according to the neighbourhood-level factors are presented in Table 2, and online Supplementary Tables S2 and S3 for the total cohort, males and females, respectively.
Incidence rates of first-episode psychosis, risk ratios and DUP according to neighbourhood-level factors

DUP, Duration of undiagnosed psychosis; ED, electoral division; CI, confidence interval; IRR, incidence rate ratio; IQR, interquartile range; Ref, reference.
* p < 0.05, ** p < 0.01.
Social deprivation
The SIR of FEP in the most deprived area was 72.4 [95% confidence interval (CI) 26.4–162.7] per 100 000 person-years compared with 21.5 (95% CI 17.6–26.0) per 100 000 person-years in the most affluent areas. This represents over a threefold increase in the incidence of FEP in the most deprived area (rate ratio = 3.4, 95% CI 1.6–7.5, p < 0.01). This finding was consistent when the cohort was stratified according to sex and diagnosis (non-affective or affective FEP). The incidence of FEP was not associated with the level of unemployment at the neighbourhood level (online Supplementary Table S8).
Social fragmentation
In the least socially fragmented neighbourhoods, the SIR was 11.24 (95% CI 4.04–25.22) per 100 000 person-years and in the most socially fragmented area it was 21.80 (95% CI 18.44–24.90) per 100 000 person-years. There was a higher incidence of FEP in the second most socially fragmented neighbourhoods (IRR = 2.40, 95% CI 1.05–5.51, p = 0.04) and there was a trend for a higher incidence in the most fragmented neighbourhoods (IRR = 2.05, 95% CI 0.91–4.62, p = 0.09). This association was only present for non-affective FEP and in the subgroup of females, for which it was only a trend association (quartile 3 IRR = 3.34, 95% CI 0.87–28.67, p = 0.06).
Social capital
In the neighbourhoods with the highest social capital, the SIR was 19.54 (95% CI 14.92–25.20) per 100 000 person-years and it was 26.48 (95% CI 20.44–33.84) per 100 000 person-years in the neighbourhoods with the lowest social capital. The finding of a higher rate of FEP in the neighbourhoods with lower social capital (IRR = 1.43, 95% CI 0.99–2.06, p = 0.05) neared statistical significance in the total cohort and was significant for females (IRR = 1.75, 95% CI 1.00–3.09, p = 0.04).
Population density
In the least densely populated area, the SIR was 15.42 (95% CI 11.86–19.80) per 100 000 person-years and 16.80 (95% CI 13.28–21.02) per 100 000 person-years in the most densely populated area. The rate did not differ according to the level of population density in the neighbourhood of residence (IRR = 1.07, 95% CI 0.78–1.48). This finding remained consistent when the cohort was stratified according to sex and diagnoses. When analysed as a continuous variable, population density was not associated with the incidence of FEP (IRR = 1.00, 95% CI 0.99–1.00, p = 0.37).
Zero inflated Poisson regression model with all neighbourhood factors
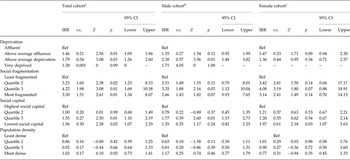
The results of the regression analysis examining the association between the neighbourhood-level factors (social deprivation, social fragmentation, social capital and population density) and the incidence of FEP when controlled for one another are presented in Table 3. A higher rate of FEP was observed in neighbourhoods of higher social deprivation when the level of social fragmentation, social capital and population density at the neighbourhood level were controlled for (IRR = 1.79, 95% CI 1.26–2.60, p = 0.01). There was a higher rate of FEP in the neighbourhoods with the highest levels of social capital (IRR = 1.56, 95% CI 1.10–2.19, p = 0.02), when the other neighbourhood factors were controlled for. Additionally, there was a higher rate of FEP in the more socially fragmented neighbourhoods (IRR = 3.30, 95% CI 1.51–2.61, p = 0.01).
Results of the multivariate analysis (zero inflated Poisson regression) of neighbourhood-level factors and the incidence of all first-episode psychosis when controlled for the other neighbourhood-level factors

IRR, Incidence rate ratio; s.e., standard error; CI, confidence interval; Ref, reference.
a Vuong test p < 0.001, log likelihood = −224.27.
b Vuong test p < 0.001, log likelihood = −157.9.
c Vuong test p = 0.003, log likelihood = −153.3.
Neighbourhood-level factors and DUP
DUP
The DUP was determined for 94.9% (n = 277) of the participants for whom a residential address was known. The DUP was highly skewed with a median DUP of 4.0 months; the 25th percentile corresponded to 1 month and the 75th percentile corresponded to 18.5 months. The mean DUP was 19.0 (s.d. = 40.3) months.
Social deprivation
The median DUP in the most deprived neighbourhood was 10.5 [interquartile range (IQR) 4–24.5] months and it was 3.0 (IQR 0–14.8) months in the most affluent neighbourhoods; however, this difference was not statistically significant (Kruskal–Wallis χ2 = 2.67, degrees of freedom = 3, p = 0.45).
Social fragmentation
The DUP was 0 (IQR 0–1.5) months in the least fragmented neighbourhood, 7 (IQR 1–25) months in the second least fragmented neighbourhoods (quartile 2), 6 (IQR 1–24) months in the second most fragmented neighbourhoods (quartile 3) and 3.0 (IQR 1–14.5) months in the most fragmented neighbourhood. The difference between the least fragmented neighbourhoods and the most fragmented neighbourhoods was statistically significant (Mann–Whitney U = 230.5, p = 0.02).
Social capital
The median DUP was 4.0 (IQR 0–15) months in the neighbourhoods with the highest social capital and it was 4.0 (IQR 1–13) months in the neighbourhoods with the lowest social capital. This difference was not statistically significant.
Population density
The median DUP in the least populated neighbourhoods was 4.0 (IQR 0–19.5) months and it was 5.0 (1–15.5) months in the most densely populated neighbourhoods. This difference was not statistically significant.
Post-hoc analysis – neighbourhoods with more than one factor hypothesized to be associated with an increased incidence
Post-hoc analysis was performed to determine whether a combination of two different neighbourhood factors would be associated with a higher incidence of FEP and is presented in online Supplementary Table S9. Neighbourhoods that had two of the factors hypothesized to be associated with a higher incidence of FEP (specifically high social deprivation, low social capital, high fragmentation and high population density) were compared against the remainder of the catchment area and IRRs were calculated. A combination of neighbourhood factors was found not to be associated with an increased incidence of FEP, for example, neighbourhoods of high social deprivation and low social capital did not have an increased incidence (IRR = 1.02, 95% CI 0.48–1.90).
Discussion
Summary of findings
The main findings of this study were that the incidence of FEP was higher in the more deprived neighbourhoods and more socially fragmented neighbourhoods. There was also a trend for a higher incidence of FEP in neighbourhoods with lower social capital. The incidence of FEP did not vary according to the population density in the neighbourhood of residence. A longer DUP was found in the more socially fragmented neighbourhoods.
Social deprivation and the incidence of FEP
The finding of more than a threefold increase in the incidence of psychotic disorders in the most deprived neighbourhoods is consistent with the previous literature on this topic and it has important implications in the further understanding of the aetiology of psychotic disorders. This study had a cross-sectional study design and therefore the ‘cause or consequence’ relationship between social deprivation and psychosis cannot be distinguished. However, previous studies have demonstrated that individuals who subsequently develop a psychotic disorder were more likely to have been born in a deprived area (Werner et al. Reference Werner, Malaspina and Rabinowitz2007). Additionally, a recent study from the UK had the counterintuitive finding that psychosis ‘proneness’ was associated with lower levels of social deprivation; however, this was when two other factors, proportion of single parent households and ethnic diversity, were controlled for (Kirkbride et al. Reference Kirkbride, Stochl, Zimbron, Crane, Metastasio, Aguilar, Webster, Theegala, Kabacs, Jones and Perez2015). In a separate study, it has been found that the level of deprivation in the area of residence was not associated with an increased risk of transition to psychosis in a population at clinical high risk for psychosis (O'Donoghue et al. Reference O'Donoghue, Nelson, Yuen, Lane, Wood, Thompson, Lin, McGorry and Yung2015). These findings suggest that the environmental factors of deprivation could exert their influence early in the trajectory in the development of a psychotic disorder. Therefore, the next stage should be to try to identify the particular aetiological factor or factors in the more deprived neighbourhoods that may contribute towards an increased risk of psychosis; for example, it may be related to a higher rate of infections and illness (Betts et al. Reference Betts, Williams, Najman, Scott and Alati2014), poor diet (Hahn et al. Reference Hahn, Galletly, Foley, MacKinnon, Watts, Castle, Waterreus and Morgan2014), overcrowding (Mortensen, Reference Mortensen2000), or increased exposure to illicit substances (Di Forti et al. Reference Di Forti, Morgan, Dazzan, Pariante, Mondelli, Marques, Handley, Luzi, Russo, Paparelli, Butt, Stilo, Wiffen, Powell and Murray2009). Additionally, inequality has also been found to be a factor associated with the incidence of psychotic disorders, in particular in deprived areas (Boydell et al. Reference Boydell, Van, McKenzie and Murray2004). Therefore it may not be the absolute deprivation that is the risk factor for developing psychosis but rather the relative deprivation or inequality.
Additionally, the association between the level of social deprivation and incidence of psychotic disorders has significant implications for service provision. There are now more than 200 EI for psychosis services worldwide (Jackson & McGorry, Reference Jackson and McGorry2009), yet there has been little discussion on the specific areas in which these services should be located and how limited resources should be allocated. It has been argued that delivery of EI for psychosis service should be based on realistic models of the predicted incidence of psychosis in different communities (Kirkbride et al. Reference Kirkbride, Jackson, Perez, Fowler, Winton, Coid, Murray and Jones2013; Kirkbride & Jones, Reference Kirkbride and Jones2014). As a result of this, a tool known as PsyMaptic (Psychiatric Mapping Translated into Innovation for Care) was developed and this can predict the incidence of FEP based on geographical information (Kirkbride et al. Reference Kirkbride, Jackson, Perez, Fowler, Winton, Coid, Murray and Jones2013). This has particular relevance to countries in which roll-out of EI services is planned. The appropriate allocation of resources to these new services could be calculated based upon the characteristics of the catchment area.
Social capital and social fragmentation and the incidence of FEP
The finding of a higher incidence of psychotic disorders in neighbourhoods with lower social capital is important and could also have important clinical implications. However, first it needs to be determined whether individuals developing a psychotic disorder either drift into neighbourhoods of lower social capital or whether there are aetiological factors in neighbourhoods with low social capital that contribute towards the onset of a psychotic disorder. As previously discussed, this ‘cause or effect’ question cannot be solved with the cross-sectional study design and would require a more complicated study design. It is likely that the level of social capital in a neighbourhood can change and it would be interesting to observe whether the incidence of psychotic disorders changes in accordance with the level of social capital. Regardless of the ‘cause or effect’ of the social capital, it highlights the importance of the wider social environment in psychotic disorders and demonstrates the importance of social cohesion in the community.
While social capital is the construct that represents the cohesiveness and trust within a community, crime could be considered to be at the opposite end of this spectrum. A study in the UK found that the incidence of psychosis was higher in areas with higher rates of crime and it was hypothesized that this may be due to increased stress, social defeat or the experience of threats (Bhavsar et al. Reference Bhavsar, Boydell, Murray and Power2014). While it was an advantage of our study that we examined a number of neighbourhood factors, it would have been informative to examine crime rates in each of the electoral divisions, as this could have been a confounding factor in the association between the incidence of psychosis and both social deprivation and social capital. Unfortunately, the rates of crime were not available at the level of the electoral division in this study's catchment area.
An interesting finding of this study is that the neighbourhood level of social fragmentation was only associated with the incidence of FEP in females. This is a replication of the findings of the study undertaken in rural Ireland, in which the incidence of FEP was examined in rural Ireland (Omer et al. Reference Omer, Kirkbride, Pringle, Russell, O'Callaghan and Waddington2014). This is an area that certainly warrants further investigation and, ideally, individual-level factors could be identified that explain this increased risk within the wider social environment. Both of the findings in relation to social capital and social fragmentation indicate that the cohesiveness of a community is an important factor in the development of psychotic disorders for the individuals living within these communities.
Neighbourhood characteristics and DUP
The least socially fragmented neighbourhoods had very short DUPs with a median of 0 months; however, a linear relationship was not observed, as the second least fragmented neighbourhoods (i.e. quartile 2) had a median DUP of 7 months. However, this suggests that there is an association between the social stability of a neighbourhood and a reduction in the delays to treatment. This has face validity, considering that it is often friends and family who are involved in help-seeking (Anderson et al. Reference Anderson, Fuhrer and Malla2010), and the less mobile and transient the population, the more likely a strong and stable social network can be established. A systematic review by Lloyd-Evans et al. (Reference Lloyd-Evans, Crosby, Stockton, Pilling, Hobbs, Hinton and Johnson2011) on the interventions aimed at reducing the DUP found that the evidence is most promising for large, intensive public awareness campaigns (Lloyd-Evans et al. Reference Lloyd-Evans, Crosby, Stockton, Pilling, Hobbs, Hinton and Johnson2011). Therefore, it may be that these campaigns could be targeted at the more socially fragmented neighbourhoods. There was a trend for a longer DUP for individuals living in the more deprived neighbourhoods and in areas of lower population density. While these findings were not statistically significant, due to the importance of reducing delays to treatment in psychotic disorders, these findings warrant further investigation.
Strengths and limitations
The strengths of this study are that it included a representative cohort of individuals with a FEP and included both affective and non-affective FEP from a geographically defined catchment area. Public and professional educational campaigns were undertaken by the EI service in order to avoid missing cases and there was a high referral rate of ‘non-cases’ which is indicative of the low threshold for professionals to refer to the service (O'Donoghue et al. Reference O'Donoghue, Lyne, Renwick, Madigan, Kinsella, Clarke, Turner and O'Callaghan2012). However, a leakage study was not conducted. Furthermore, the catchment area had a mix of deprived and affluent areas and also urban and rural areas. The results must be considered within the limitations of the study and which also included using a single proxy measure of social capital; it would have been preferable to directly measure social capital, such as by the method of using a validated instrument to assess social cohesion and trust in a representative sample from each neighbourhood (Kirkbride et al. Reference Kirkbride, Boydell, Ploubidis, Morgan, Dazzan, McKenzie, Murray and Jones2008).
Supplementary material
For supplementary material accompanying this paper visit http://dx.doi.org/10.1017/S003329171500286X
Acknowledgements
We are very grateful to Felicity Fanning, Elizabeth Owen, Stephen McWilliams, Deirdre Jackson, Sharon Foley, Caragh Behan, Nicholas Ramperti and Mansoor Anwar for collecting data for this study.
Declaration of Interest
None.