1.0 INTRODUCTION
The first two Metop satellites (A and B) were launched in October 2006 and September 2012, respectively, by Soyuz/Fregat launchers from the Baykonur Cosmodrome in Kazakhstan.
The same type of launcher was selected for the third one, Metop-C, but the launch operations were carried out from the Kourou Space Centre in French Guyana in November 2018.
All the satellites of the Metop family (shown in Fig. 1) are operated into a Sun-synchronous repeat orbit with the following characteristics:
– Local time of the descending node (LTDN) of 9:30, with ±2 minutes of tolerance
– Repetition cycle of 412 orbits in 29 days, within 5km from the nominal ground-track
– Eccentricity kept close to the frozen value, with deviation below 0.0002
The Metop satellite.

After its launch, Metop-B has been positioned on the same ground-track as Metop-A, to ensure identical views from the two satellites, and at the same time as separated as possible in orbital phase, to maximise the daily coverage with the optical instruments.
As on a repeat cycle of 29 days only 28 locations, separated by integer numbers of 1/29 of an orbit, fulfil the first condition, a nominal separation in phase of 14/29 of an orbit was implemented (as shown in Fig. 2).
Dual-satellite Metop nominal configuration.

After 10 years of operations on Metop-A inclination maintenance was suspended in 2016, to save enough fuel for end-of-life operations (as described in(Reference Righetti and Dyer1,Reference Sancho, Paulino, de Juana Gamo and Righetti2) ), in line with the ISO 24113 Space Debris Mitigation guidelines; as a consequence its LTDN started drifting toward early morning local times and, as the ground-track was still maintained (little fuel is needed), the separation in phase with Metop-B started reducing significantly (as depicted in Fig. 3).
Metop-A relative phase evolution with LTDN drift.

Therefore, at the time when Metop-C had to be launched, the in-orbit configuration of the other two Metop satellites was not anymore the nominal one and was, moreover, still evolving in time; that had to be taken into account when consolidating the strategy for first launching, then commissioning and finally exploiting the new satellite.
2.0 METOP-C LAUNCH TIME (AND DATE) SELECTION
As mentioned above, the launcher selected for Metop-C is a Soyuz/Fregat launcher. Its trajectory is invariant in the Earth-fixed reference frame. Therefore, the in-orbit position (PSO) at separation is always the same, regardless from the date and the time of the launch itself (PSO = 216deg, time between launch and separation: 3618 seconds).
Consequently, the achieved LTDN is only function of the launch time, regardless of the launch date; that permits to select the launch time to achieve an optimal initial LTDN which, together with an adequate bias in the initial inclination, permits to implement a first long fuel-neutral (12 to 18 months) LTDN cycle within the ±2-minute window. For the first two Metop satellites the inclination at launch was biased with respect to the nominal value by 35 millidegrees and its LTDN by –70 seconds; Fig. 4 illustrates the Metop-B case, for which no inclination correction was needed during launch and early operation phase (LEOP). It can be observed that more than one year of LTDN cycle is directly implemented by the launcher, without need of any inclination correction.
Observed Metop-B deviation in inclination (milli-degrees, red line), altitude (meters, green line) and LTDN (seconds, blue line) after launch.

The requirement to maintain the LTDN deviation within ±2 minutes from 9:30 (so in the window [9:28, 9:32]) comes from the need of Sun signal into the calibration port of the GOME instrument (as explained in(Reference Damiano, Lang, Sancho and Righetti3)); however, close to the autumnal equinox, it can be observed that, due to the Sun displacement from the mean value induced by the time equation, a violation of the lower boundary can be tolerated.
On Metop-B a 30 seconds violation around the autumnal equinox 2018 was therefore implemented, to permit postposition of the routine inclination corrections to a more efficient date (more details can be found in(Reference Damiano, Lang and Righetti4)), with no impact at all on the GOME calibration.
For Metop-C, this Metop-B experience was used to optimise even further the initial launcher conditions. These are selected in order to:
– minimise the probability of having to perform an inclination correction in LEOP; that is required if the LTDN evolution leads to a violation of the acceptable margins in the first 45 days after launch, not to affect negatively the initial operations on the scientific instruments).
– maximise the probability of achieving a long (more than 1 year) LTDN cycle without requiring any inclination correction during the entire period.
The launch date was close enough to the autumnal equinox, which made it possible to extend the target LTDN window to [9:27:30, 9:32]. That lead to a selection of an initial LTDN with –90 seconds offset (instead of –70 seconds), and to a launch time of 01:47:27 UTC.
As an example the expected short-term LTDN evolution for a very large inclination error of 95 millidegrees and of –70 millidegrees, coupled with an equivalent (in terms of number of sigma of the nominal launcher performances) error in initial LTDN (its initial value is also corrected to consider the effect of the phase drift needed to achieve the target position) is presented in Fig. 5. No violation of the extended LTDN window is observed in the first 45 days, whereas that is not true for the nominal window.
Expected Metop-C inclination (milli-degrees, red line/square markers) and LTDN (seconds, blue line/round markers) deviation after launch for large positive (above) and negative (below) injection error cases.

Considering that the contractual 1 sigma performance in inclination of the launcher is 40 millidegrees, but the expected one is around 30 millidegrees, the probability of having to execute an inclination correction in LEOP is minimal; only positive corrections are expected, which are then in the optimal direction to implement a long LTDN cycle.
Even if no inclination correction is performed during LEOP, it is necessary to make sure that the LTDN can afterwards be kept safely within the operational margins. In particular, in case of large negative inclination error the LTDN error has to be brought back within the nominal window (so over 9:28) before mid-February, when the most critical geometrical configuration for the GOME calibration are observed. A correction of 80 millidegrees is required 45 days after the launch, which is still achievable with two burns (Fig. 6).
Expected Metop-C inclination (milli-degrees, red line) and LTDN (seconds, blue line) deviation after launch for large negative injection error and correction at extended window limit.

The case very large positive inclination error is also of interest; to avoid violation of the nominal LTDN window 45 days after the launch a huge correction of −110 millidegrees would be needed. Three burns are necessary to implement such a correction, which represents a remarkable operational complexity (Fig. 7).
Expected Metop-C inclination (milli-degrees, red line) and LTDN (seconds, blue line) deviation after launch for large positive injection error and correction at nominal window limit.

The option to advance in that case the execution of one of the burns into the LEOP phase was therefore agreed with ESOC, the operator responsible for the implementation of the LEOP (many thanks for that); these cases are only observed for very large inclination errors (above 75 millidegrees), which are in any case quite unlikely.
Figure 8 presents the expected short term LTDN evolution for a moderate inclination error of 13 millidegrees and of –13 millidegrees.
Expected Metop-C inclination (milli-degrees, red line) and LTDN (seconds, blue line) deviation after launch for moderate positive (above) and negative (below) injection error cases.

It can be observed that a long LTDN cycle (of one year for a negative inclination error, considering the extended LTDN window; for nearly the double for a positive one) is implemented; that means that in around 30% of the cases (assuming 30 millidegrees of launcher dispersion) no inclination correction is needed at all in the first year of mission (on the first two Metop launches, the observed dispersion was well below these values).
It is, therefore, evident that the selected initial conditions fulfil the optimisation criteria described at the beginning of the paragraph.
Another consequence of the fact that the in-orbit position (PSO) at separation is always the same, regardless from the date and the time of the launch itself is that the relative position with respect to the other two flying Metop satellites changes every day. As the launch altitude selected for Metop-C is 16km below the nominal value, which leads to an important relative orbital drift, on certain dates the Metop-C satellite overtakes one of the two other operational Metop satellites during the initial, critical LEOP phase. If that latter satellite experiences an autonomous entry in contingency mode during that period, interferences in radio frequency (RF) are observed.
That would result in an unacceptable risk for both satellites and these dates are to be excluded from the candidates for launch. It is also possible to identify several dates (November 7 is one of them) where interferences may happen during the first two days of LEOP; these dates are acceptable for launch, but special care is needed to mitigate the resulting interferences. Further details on how these dates are identified and on the special operations implemented to cope with them can be found in a dedicated paper (see(Reference Sancho, de Juana Gamo and Righetti5)).
3.0 METOP-C COMMISSIONING LOCATION SELECTION
The commissioning location of Metop-B was specified to be on the same ground-track of Metop-A (to permit a one to one comparison of the images taken from very similar positions in the sky, even if on different dates) and with a separation in orbit as large as possible.
As already explained, only 28 orbital locations, defined as Legs, permit to overfly the same ground-track of Metop-A; Metop-B was therefore commissioned on Leg-14 wrt Metop-A (which is then on Leg-15 wrt Metop-B, as shown in Fig. 9, where all Legs are also identified).
Metop-B commissioning location with respect to Metop-A.

The same was foreseen for Metop-C; however, as Metop-A is still in good shape, and its contribution still appreciated, it was decided to keep it in operations well over the expected lifetime (as explained in(Reference Righetti and Dyer1)).
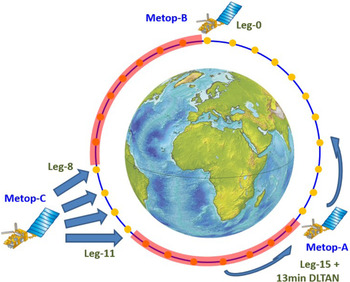
That makes impossible to consider for Metop-C the Metop-B strategy, as the target location is not free; it is important to keep in mind that, while during LEOP and initial Satellite in Orbit Validation activities it is acceptable to have a dedicated ground station for the operations of Metop-C, the same ground station shall be used to operate the three satellites during commissioning. On other hand, due to the drift in LTDN observed on Metop-A (more than 13 minutes at the launch date of Metop-C), its on-orbit position changed enough to leave sufficient place to position Metop-C between Metop-A and B, as shown in Fig. 10.
Metop-C possible commissioning locations.

As it can be observed, enough separation has to be present to ensure that consecutive passes can be taken with the same antenna; the following was considered when computing that minimum separation for Metop-B and Metop-C.
– Up-to 8 minutes are needed after LOS (loss of signal) of one satellite to be ready to acquire the next satellite at AOS (acquisition of signal).
– U pass can last up to up-to 15.5 minutes (with AOS and LOS at 0 degrees elevation).
– Each satellite can move wrt its nominal location up to 2 minutes (LTDN control window).
Therefore, a minimum separation of 27.5 minutes is needed; that implies that the seven Legs before and after Metop-B (one Leg corresponds to around 3.5 minutes) cannot be considered.
For Metop-A less margins are needed on what concerns the LTDN window, as its separation wrt Metop-C after launch is well known and increases in time; that, together with the displacement of nearly four Legs due to the LTDN drift (and correlated drift in phase as the ground track is maintained), permits to release four possible Legs as commissioning location: 8, 9, 10 and 11.
It is worth noticing that, considering the above-mentioned values for maximum pass duration and maximum time required between consecutive passes (LOS to AOS), it would have not been possible to find any compatible location if LTDN control on Metop-A was maintained.
Among the possible Legs identified above, the number 8 was excluded as the available margin of 0.5 minutes was considered unsatisfactory to ensure robustness against second order effects, such as the displacement of each satellite in the ground-track and the change in time between ascending node (ANX) and AOS due to the difference in time of crossing of the ascending node (due to the Earth rotation). Among the remaining three possible Legs, the main criterion for the selection of the optimal one was the operational robustness of the acquisition strategy and consequently of the LEOP operations.
As explained in (Reference Sancho, de Juana Gamo and Righetti5), the displacement to be implemented between the separation location and the commissioning location changes for any launch date (in the 29 days of the repeat cycle). Moreover, acquisition of the commissioning location shall be ensured within 7 and 18 days after launch, due to constraints in the initial instruments’ operations (switch-on during the first week, de-contamination not later than two weeks afterwards).
Therefore, being the drift rate of the satellite directly proportional to the difference in altitude with the nominal operational altitude, it may be necessary to adjust the satellite altitude during LEOP to implement the desired drift rate. It can be observed however that if the satellite is very close to the target location when the first LEOP manoeuvre is implemented (normally 2.5 days after launch), it may be very nearly impossible to implement a safe acquisition.
In the example presented in Fig. 11 the satellite is released at an altitude 16km below the nominal operational one; the relative drift rate is then so high (large red arrow) that the first target (Leg N) would be reached in a very short time. To acquire this target in 6 days it is necessary reduce the drift rate significantly, through a very large altitude change (light blue arrow) aiming to achieve a target altitude very close to the nominal operational one.
Metop-C acquisition on first target.

As the error in the achieved altitude is proportional to the implemented altitude change, it is also very large (upper Error fork), of a size similar to the difference between the nominal and the target altitude. Consequently, the achieved altitude could end up being very close to the nominal one and, then, the resulting drift rate extremely small (short red arrows), which would lead to an unacceptably large acquisition time.
On other hand, if the following target is selected (Leg N + 1), the required correction is smaller (dark blue arrow) and consequently the correlated error in the achieved altitude (lower Error fork); the impact in the achieved (larger) post manoeuvre drift rate, and consequently in the time needed to reach the target, is therefore relatively small.
A similar scenario can be envisaged if the satellite, at the time of first manoeuvre, is located between Leg N and Leg N + 1. In that case acquisition of the Leg N-1 with drift reversal is the most robust option.
The only target that permits to implement that robust acquisition strategy is therefore Leg-10, being Leg-9 and Leg-11 available in case of excessive proximity to Leg-10.
4.0 METOP-C OPERATIONAL LOCATION SELECTION
The natural location for Metop-C operations would be in opposition with Metop-B (around half orbit apart), to ensure continuity of data on the dual mission; the original plan was to move Metop-C at the end of the commissioning, in spring 2019, on Metop-A initial nominal location (on Leg-15) as soon as Metop-A LTDN drift would have reached around 24.5 minutes (corresponding to seven Legs of phase drift) and implement then the so called Trident configuration, depicted in Fig. 12.
Metop-A/B/C nominal Trident configuration.

At this point Metop-A would be kept on fixed relative phase wrt the other two Metop satellites at around Leg-22; it will be impossible, however, to continue with ground-track control, as the further drift of the LTDN would cause a displacement toward east of the ground-track.
However, to operate three satellites so close is not a trivial task, above all for the ground-station constraints mentioned on the previous paragraph. Even assuming an accurate phase control for Metop-A (thus reducing significantly the 2 minutes of margins allocated to its LTDN control to ~0.5 minutes), a minimum separation of 26 minutes would be needed, to which around another minute is added to take into account the changes in relative time between ANX and AOS caused by the ground-track drift, as shown in Fig. 13.
Impact of ground-track (GT) drift on ANX to AOS time.

This means that a total of 27 minutes of nominal separation would be needed, 2.5 more than the 24.5 minutes available.
Several solutions were envisaged to overcome that problem:
a) Optimisation of the operations between LOS of a satellite and AOS of the next one, to reduce that time from the above mentioned 8 minutes.
b) Reduction of the pass duration itself, re-defining the AOS and LOS events not at 0-deg elevation but at 5 degrees or even more (LOS can be declared as soon the scientific dump is completed, normally 4 minutes after maximum elevation).
c) Implementation of coordinated operations between LTDN maintenance on Metop-B and C, and phase maintenance on Metop-A.
d) Positioning of Metop-C not on Leg-15, but on Leg-14, still maximising the separation from Metop-B, even if not on Metop-A original location.
An analysis of the ground-station operation put in evidence that several procedures executed after LOS were also repeated before the following AOS, to enhance robustness. However, a statistical analysis showed that the second execution was very rarely used and could therefore be removed, reducing the total needed time by around 2 minutes.
The option of postponing to 5 degrees the AOS event was discarded, as it would have implied an increased risk on the satellite acquisition operations, as the earlier the lock on-board is acquired, the higher is the probability of successful transition to auto-track before the start of the scientific dump. Also, the anticipation of the LOS event was discarded, as several S-band tables needed for satellite monitoring, are dumped after the end of the scientific dump.
The implementation of coordinated LTDN operation were found to be operationally not recommendable, due to the difference in thrusting performances between Metop-C and Metop-B; that would not have permitted to implement for Metop-C an optimal strategy (minimising the inclination corrections), with unacceptable impact on the mission lifetime.
The proposal of considering Leg-14 as target for the Trident configuration was accepted; that, together with a displacement of the Metop-A phase control location between Leg-21 and Leg-22, permits to gain more than 1.5 minutes of margin. That makes feasible, with margins, this configuration, which is shown in Fig. 14.
Metop-A/B/C alternative Trident configuration.

However, that does not imply that the Trident will be implemented at the end as, from an operational point of view, the option of keeping Metop-A, B and C more or less equidistant in phase (so with Metop-C kept on Leg-10 and Metop-A controlled in phase between Leg-19 and Leg-20) is clearly the most robust.
Besides, that option, called Tristar (described in Fig. 15) does not require to move Metop-C at the end of the commissioning, with a not negligible saving in operational load and also in fuel, above all if the re-positioning of Metop-C needs to be executed fast to reduce the duration of the unavailability for the scientific mission.
Metop-A/B/C Tristar configuration.

It is also important to notice that, in terms of Earth observation, the two configurations are not identical; considering only the two controlled satellites—Metop-B and Metop-C—it can be observed that the Trident configuration ensures no gap for the nadir pointing optical instruments (GOME, even with one satellite in full swath, the other in high resolution swath), while large gaps are observed for the right/left side pointing instruments (ASCAT), being the left side of a satellite exactly on top of the right side of the other satellite (as shown if Fig. 16).
Coverage figure for Metop-B/C Trident configuration (GOME, left; ASCAT, right); Metop-B swath in grey (high resolution for GOME) and Metop-C swath in pink.

For the Tristar configuration, small gaps are observed on the nadir pointing instruments (due to the excessive proximity of the two ground-tracks), while the gaps on the right/left side pointing instruments are reduced, as there is no more overlap between right and left side of the two satellites (as shown if Fig. 17).
Coverage figure for Metop-B/C Tristar configuration (GOME, left; ASCAT, right); Metop-B swath in grey (high resolution for GOME) and Metop-C swath in pink.

Metop-A contribution is not considered in that analysis as, being its ground-track uncontrolled (drifting toward east), it changes depending on the point in time considered, contributing or not to the coverage depending on the relative position of its ground-track with respect to the one of the two other satellites. The real benefit of Metop-A, regardless of the configuration selected for Metop-C and Metop-B, is that it will fly on an earlier orbit (in terms of LTDN) with respect to the other two satellites.
The decision of which configuration to implement will be taken at the end of the commissioning, also taking into account the observed performances of the Tristar configuration during that period.
5.0 METOP-C INITIAL OPERATIONS
Metop-C was successfully launched on the November 7 from the Kourou Space Centre by a Soyuz launcher; the achieved orbit was excellent, above all in terms of error in inclination (few millidegrees) and LTDN (few seconds).
That permits, as expected, to implement a 1.5-year LTDN cycle without requiring any correction manoeuvre in LEOP; Fig. 18 (left) depicts the resulting predicted long term LTDN evolution.
Metop-C inclination (in red, millideg) and LTDN (in green, sec) evolution (left); actual ground-track evolution with respect to target at ANX (in red, km) at 30deg latitude (in green, km) and at 60deg latitude (in blue, km) (right).

Also the error in altitude was moderate (a couple of Km), permitting to reach without any problem Leg-10 around one week after the end of the LEOP, without requiring any correction during LEOP; Fig. 18 (right) presents the resulting ground-track evolution, including the effect of the manoeuvres executed by EUMETSAT first to slow down the drift and then acquire the operational orbit on the November 19.
In November 2019, after completion of the commissioning, the decision was yet taken to re-locate Metop-C to the alternative Trident configuration described in Fig. 14; the drift was started immediately afterwards, and acquisition of the target position is expected in February 2020; more detail on these operations will be provided in future publications.
6.0 CONCLUSIONS
The paper presents the analysis performed by EUMETSAT in support of the preparation of the Metop-C mission. Several parameters, required for the execution of the initial operations, were provided as outcome, namely:
The launch time maximising the probability of not having to perform any inclination correction during the first year of operation.
The launch dates ensuring avoidance of the risk of interference during critical LEOP phases between Metop-C and one of the already flying Metop satellites.
The best commissioning location, permitting to implement a robust acquisition strategy, taking into account the constraints imposed by the ground-stations.
The excellent results of the Metop-C initial operations, executed in November, demonstrated the validity of the performed analysis.
Furthermore, input was provided in support to the selection of the operational location for Metop-C maximising the scientific return.
ACKNOWLEDGEMENTS
The authors would like to thank the ESOC Metop-C LEOP team for the excellent work performed, essential to successfully complete the Metop constellation.