

Introduction
The practice of co-management of marine and coastal resources is becoming increasingly widespread (Wilson and others Reference Wilson, Ahmed, Siar and Kanagaratnam2006; Evans and others Reference Evans, Cherrett and Pemsl2011; Gutierrez and others Reference Gutiérrez, Hilborn and Defeo2011). There is no single universally accepted definition of co-management; rather, the term refers to a range of arrangements with different degrees of power sharing about a set of resources or an area (Armitage and others Reference Armitage, Berkes and Doubleday2007). Individual cases of co-management evolve in some instances from humble beginnings to mature partnerships involving joint management. One commonality among all forms of co-management is that they involve two or more different organisations working together. The group of organisations and individuals involved in a co-management system is referred to here as a co-management network. The Arctic case discussed here illustrates the evolution of co-management through increased sharing of power and responsibility between the government and local resource users (Berkes Reference Berkes2009).
Despite an accumulation of cases, it has been difficult to describe the conditions that lead to successful co-management systems. Ostrom's design principles for sustainable community-based natural resource management and collective action provide one set of key variables for the creation of successful co-management systems (Ostrom Reference Ostrom1990; Cox and others Reference Cox, Arnold and Villamayor–Tomás2010). The time dimension appears important; that is, the length of time that a co-management arrangement is operating has explanatory power (Napier and others Reference Napier, Branch and Harris2005). However, other analyses suggest that success or failure of a co-management system is independent of the length of its operational time frame (Gutierrez and others Reference Gutiérrez, Hilborn and Defeo2011).
The history and the trajectory of the arrangement itself seem to have a strong bearing on success; co-management that starts with a strongly adversarial situation has little chance of success (Chuenpagdee and Jentoft Reference Chuenpagdee and Jentoft2007). Hence, there is need to track the details of development of cases to provide context for assessing co-management arrangements. We know that if the parties establish a cooperative relationship that leads to building of mutual respect and trust, then there is a higher chance that successful problem-solving ability will develop (Olsson and others Reference Olsson, Folke and Berkes2004). Problem solving is perhaps the essence of co-management, as it denotes a working relationship between the parties, with the ability to transcend differences (Carlsson and Berkes Reference Carlsson and Berkes2005), combine the relative strengths of each (Cash and Moser Reference Cash and Moser2000), and perhaps even generate new knowledge applicable to the situation in hand (Berkes Reference Berkes2009).
There is increasing evidence that such problem solving involves learning networks facilitated by the co-management arrangement, and learning-by-doing that enables the problem-solvers to apply their skills to increasingly more challenging issues (Olsson and others Reference Olsson, Folke, Galaz, Hahn and Schultz2007; Armitage and others Reference Armitage, Berkes and Doubleday2007; Berkes Reference Berkes2009). Such social learning, in turn, is receiving greater attention in adaptation research (Armitage and others Reference Armitage, Berkes, Dale, Kocho-Schellenberg and Patton2011), especially in such areas as the Arctic in which people are coming under huge challenges related to global environmental change, including climate change (Armitage and Plummer Reference Armitage and Plummer2010; Hovelsrud and Smit Reference Hovelsrud and Smit2010).
The development of co-management and of social learning, potentially leading to adaptation to change, is the context in which we are interested in co-management arrangements in the Canadian western Arctic. Co-management is mandated under the terms of a native land claims agreement, the Inuvialuit Final Agreement (IFA) of 1984 (Ayles and others Reference Ayles, Bell, Hoyt, Armitage, Berkes and Doubleday2007). The particular problem-solving case chosen for the study is the entrapment of beluga whales (Delphinapterus leucas) during freeze-up in Husky Lakes on the Beaufort Sea coast, near the community of Tuktoyaktuk (known as Tuk).
The beluga entrapment issue was chosen because it provides a suitable case with which the development of co-management may be studied. The beluga case illustrates important differences in terms of communication and participatory decision-making prior to and after the establishment of the relevant co-management arrangements. Entrapments occurred before, immediately after, and long after the signing of the IFA. Thus, studying the structure and functioning of the network during these entrapments can provide ‘snap shots’ of key points in the development of the network, and lead to insights regarding the question of whether the time frame of co-management is important or not in determining the success of co-management arrangements as indicated by stakeholder perception and efficacy of management (Napier and others Reference Napier, Branch and Harris2005; Gutierrez and others Reference Gutiérrez, Hilborn and Defeo2011).
Hence, the objective of the paper is to analyse changes over time in the management network involved in dealing with the Husky Lakes beluga entrapment issue, using Social Network Analysis (SNA). This requires understanding interaction and communication between holders of Inuvialuit knowledge and government scientists/managers involved in co-management. Following some background discussion about the Canadian western Arctic and the co-management arrangement, we explain the study methods and approach, and provide the historical and political context of the beluga case and the participants involved. We then document the evolution of co-management through an analysis of the beluga case and the elaboration of the management network over time.
The people, the area, and co-management under land claims agreements
The Inuvialuit (western Inuit) people are the descendants of a mix of Mackenzie delta people, the Inupiat (Alaska Inuit), and the Copper Eskimo of Victoria Island. The hamlet of Tuktoyaktuk has a largely Inuvialuit population and is one of the six communities in the region covered by the IFA. The pervasive daily use of the Inuvialuktun language in Tuktoyaktuk reflects the retention of certain aspects of cultural heritage among the residents of the community. The annual cycle of harvesting activity has changed through time due to changes in settlement patterns and use of technology, in a context of cultural continuity. The harvesting cycle as before includes many species of terrestrial and marine mammals, fish, and birds. Beluga whales continue to be harvested for subsistence (Berkes and Armitage Reference Berkes and Armitage2010).
Communities in the western Arctic have been experiencing rapid environmental changes. There is less sea-ice, both in cover and thickness, affecting species distributions and movements, as well as creating safety problems for hunters moving over sea-ice (Laidler and others Reference Laidler, Ford, Gough, Ikummaq, Gagnon, Kowal, Qrunnut and Irngaut2009; Berkes and Armitage Reference Berkes and Armitage2010). Oil and gas development that had peaked in the 1970s and declined later, restarted in the 1990s, affecting culture, language and economy. The combined effect of these various changes has left the Inuvialuit people vulnerable to further changes and has even resulted in food security problems (Ford and Berrang-Ford Reference Ford and Berrang–Ford2009; Hovelsrud and others Reference Hovelsrud and Smit2010).
The IFA, signed after a long period of negotiation, was the first of the native land claims agreements in the Northwest Territories of Canada which served to finalise the legal status of all land and resource use and ownership issues. Under the agreement (Doubleday Reference Doubleday and Pinkerton1989; Ayles and others Reference Ayles, Bell, Hoyt, Armitage, Berkes and Doubleday2007), the process of co-management of marine resources directly involves the following organisations:
-
* The Tuktoyaktuk Hunters and Trappers Committee (HTC). This local organisation comprises four elected community members and a chairman, which serve to represent Inuvialuit knowledge as it pertains to management decisions, and play a role in monitoring and implementation of management strategies.
-
* The Department of Fisheries and Oceans Canada (DFO). Several different levels of the DFO are involved in the co-management system on an issue-by-issue basis, contingent on legislation under the Fisheries Act.
-
* The Fisheries Joint Management Committee (FJMC). This organisation was formed under the IFA and serves as a bridge that facilitates communication between the local and federal organisations.
-
* The Inuvialuit Game Council (IGC). The IGC is involved indirectly and most often in an administrative capacity.
The IFA was signed in 1984 but co-management did not really begin in earnest until the late 1980s. The linkages between these various organisations were outlined in the IFA, but were not in effect until they were elaborated on and refined by key individuals among the Inuvialuit people and government scientists and managers, as described below. The FJMC facilitated the provision of information, resources, decision-making power, and a sense of pride (Ayles and others Reference Ayles, Bell, Hoyt, Armitage, Berkes and Doubleday2007).
Since 1984, the organisations directly involved in co-management decisions have been the FJMC, DFO, Tuktoyaktuk HTC, and to a lesser extent the Inuvik HTC. They are the members of the management network, but it is important to consider the membership structure of each of them as well. Membership to the DFO is determined by employment in a specific office. The DFO is divided into six regions. The Northwest Territories is under the jurisdiction of the Central and Arctic regions. There is a matrix approach to management, under which department branches dealing with science and fisheries management of the Central and Arctic region have headquarters at the regional office in Winnipeg while specific geographical regions are administered by area or district offices. The branches of the DFO that are directly involved in co-management in Tuktoyaktuk are the Central and Arctic regional office, the DFO area office in Yellowknife and the Inuvik district office. ISR co-management authority for DFO resides in the Central and Arctic regional office. It is delivered by the staff of the area and district offices, supported by regional and national staff of DFO as needed.
Membership in the FJMC, the key co-management body, is determined by official appointment made by either the Government of Canada through the Minister of Fisheries and Oceans, or by the Inuvialuit through the IGC. The IGC is indirectly involved in the decision-making processes by appointing two of the FJMC members. The IGC itself comprises at least one member from each community HTC within the ISR. Each HTC elects a voting member and an alternate to represent its community on the IGC. Membership to the HTCs is determined by yearly election by community members. The pre-IFA HTAs were the result of Inuvialuit self-organization (Robert Bell, personal communication, 15 September 2009), and the methods of appointment to the HTCs is largely the same as it was for the pre-agreement HTAs. Membership to the Inuvialuit HTCs, as well as the process by which membership is determined, is controlled by the communities in a way that the Inuvialuit consider to be culturally appropriate.
Co-management in the Inuvialuit settlement region deals with a number of species in different parts of the territory. The case of beluga entrapment was recommended by a senior FJMC member as a case that would highlight the development of co-management practice. Every year, pods of beluga whales enter into Liverpool Bay which connects the Beaufort Sea to the Husky Lakes. As far back as the Inuvialuit can remember, groups of beluga have occasionally become trapped during freeze-up in savssats, crowded breathing holes in the ice (Porsild Reference Porsild1918). Inuvialuit have customarily taken advantage of the savssats for hunting. However, beginning in the 1960s the Canadian Government became involved in the management of these sporadic entrapments because of (southern) public concerns about animal welfare, and management strategies changed drastically to ‘save’ the trapped whales without proper consultation with Inuvialuit hunters.
Contextualizing the case
Prior to the signing of the IFA of 1984, community hunter and trapper associations (HTAs) were minimally funded through the Government of the Northwest Territories. They had only sporadic communication with the DFO in such situations as research on Inuvialuit land where DFO sought consultation (Vic Gillman, personal communication, 20 August 2009). Prior to 1984 the DFO did not have an office in Inuvik. The HTAs that existed within the Inuvialuit communities before the IFA, along with the pre-IFA Inuvialuit game council, were the result of self-organisation that relied heavily on Inuvialuit leader Billy Day (Robert Bell, personal communication, 15 September 2009). Election to the board of the HTA was open to any adult member of the community and depended upon one's level of practical experience and standing in the community (Dennis Raddi, personal communication, 5 August 2009).
The relationship between the Inuvialuit and the government has not always been harmonious, as the enforcement of government game regulations in the past often caused hardships to hunters. Following the signing of the agreement, relationships did not change overnight but improved gradually, as compared to what they were in the previous decades when the only management system in place was that of the Canadian Government, in which the Inuvialuit were arbitrarily involved in only a fraction of management issues (Ayles and others Reference Ayles, Bell, Hoyt, Armitage, Berkes and Doubleday2007).
Study methods
The project employed a collaborative research approach that included participants at every stage of the research including research design, field work, verification, and editing. Quantitative and qualitative methods were used, including informal conversations with FJMC, Tuktoyaktuk HTC, DFO (past and present from all organisations), and community members; participant observation; questionnaires; semi-directed interviews; document analysis; and the engagement of community research partners. During meetings with the FJMC, Tuktoyaktuk HTC, and the DFO, the names of members of the organisations involved in all of the entrapments were obtained. These names were often recorded in documentation, and other times current members of the organisations simply remembered names of people who were involved. Interviews were sought with every name that was obtained. Some of the past members were unavailable for various reasons.
The questionnaires were designed to determine all the communication linkages regarding an entrapment, therefore it was essential to administer it to as many of the members of the organisations in the co-management network as possible. The questionnaire asked participants to recall all the people with whom they interacted during the entrapment decision-making process. Participants were also asked to recall the official positions those people held within specific organisations, and the reporting relationships they had during the decision-making process and actual events. In addition to directing this line of questioning to the three primary member organisations, the participants were asked to recall any other people or institutions that were involved in any way (community members, government representative, media, etc.). The questionnaire also asked participants to note any differences that may have existed between official relationships and real ‘on-the-ground’ interactions during the decision-making and actual events.
The questionnaires were used in conjunction with document analysis and interview transcripts to perform SNA as a means of quantifying the relationships between actors (individuals and organizations). Analyzing the network in this way allowed for a relatively unbiased view of the network's structure and properties (Scott Reference Scott1991). All the members for a given event were put into a matrix, in which each member was given a cell in row 1 (A1, B1, C1, etc.), and that same list of members was also given a cell in column A (A1, A2, A3, etc.). Each year had its own matrix with all the members of the organisations included within it. After going through interview and questionnaire data, a ‘1’ would be placed in cell ‘B10’ if the network member listed in ‘B1’ and ‘A10’ reported having interacted during that event. 22 interviews were conducted with present and past members of the management network. An additional 15 interviews were conducted with community members who were not officially part of the management network, but were mentioned by members as having an influence on the events. So a total of 37 informants contributed to the analysis.
The use of SNA in understanding natural resource management network structures is still in the preliminary stages (Janssen and others Reference Janssen, Bodin, Anderies, Elmqvist, Ernstson, McAllister, Olsson and Ryan2006). In this study, SNA is used to provide an understanding of changes in the structure of the communication links within the co-management network responsible for dealing with beluga entrapments within the Husky Lakes area. This study uses a framework for social network analysis developed by Streeter and Gillespie (Reference Streeter, Gillespie, Gillespie and Glisson1993), which relies on the following three key elements; 1) defining the network component units; 2) defining the boundary, and; 3) determining connectedness. All the organisations that were involved comprise what will be referred to here as the management network.
Several metrics were used to analyse the network data. It has been argued that the most important metrics for describing the structure of social-ecological systems in a network fashion are linkage density, centrality, and connectedness, which is determined by linkage density and reachability. Reachability refers to the level of access between members of the network (Janssen and others Reference Janssen, Bodin, Anderies, Elmqvist, Ernstson, McAllister, Olsson and Ryan2006). Linkage density is the proportion of observed linkages divided by the total number of possible linkages. Centrality and centralisation are two ways of looking at how well a node is connected to other nodes, with centrality focusing on a node's number of linkages (local), and centralisation focusing on the connection of a node to the whole network (global), which is basically a measure of its access to and influence of the network (Scott Reference Scott1991). Highly centralised networks may be efficient in making relatively simple decisions, but in certain cases overly centralised networks may not be able to effectively coordinate actors in complicated resource management issues (Bodin and others Reference Bodin, Crona and Ernstson2006). Eigenvector centrality is the weighted sum of all directly and indirectly connected nodes of every path length and was used in this study because it more accurately takes into account the entire pattern of the network (Bonacich Reference Bonacich2007). Eigenvector centrality is a measure of an individual's centrality in the network, which corresponds to that person's ability to access network resources such as knowledge, information, or materials.
In this paper individuals are taken as the component unit for the diagrammatic representations of the network. In order to facilitate interpretation of the network diagrams, changes in the member organisations are also discussed. An important consideration in choosing individuals as the component units was that this would help elucidate the informal aspects of the network as well as the formal. Informal relationships can often be as important to consider as formal ones because the actual communication structure of a social network may depart significantly from the formal ‘on paper’ communication structure (Wasserman and Faust Reference Wasserman and Faust1994). Positional analysis (analysis of formal relationships) is used in conjunction with reputational or decisional analysis to allow informal trends in the network to be shown (Tichy and others Reference Tichy, Tushman and Fombrun1979). Decisional analysis requires interviews with network members in order to discover which other members they actually interact with while making specific decisions. This differs from network analysis that simply analyses the formal organisational structure of a network. In other words, the formal structure of communication and reporting relationships may not always be an accurate representation of a network.
A formal relationship may be implemented in different ways. For example, a reporting relationship of one organisation to another may involve communication only between the heads, or it may involve communication between many members from each. In this case, the former would be referred to as more hierarchical, and the former as more organic, meaning its organisation has elements of top down and bottom up communication (Tichy and others Reference Tichy, Tushman and Fombrun1979). The questionnaires administered for this study gathered information about formal reporting relationships as well as informal communication structures and knowledge flow in the network. The approximate frequency, intensity, and quality of the communication and knowledge flow between network members were also revealed.
Network boundaries serve to separate the network under analysis from larger networks in which it is embedded. In many cases this can be a sensitive issue, but in the case of groups with pre-determined memberships it is relatively simple (Streeter and Gillespie Reference Streeter, Gillespie, Gillespie and Glisson1993). The first step involved in defining the boundary is to identify the organisations that were officially involved in entrapment decision-making processes.
Documenting the evolution of co-management
Before the IFA, the management system in place was very much ‘top-down’. At this time there were no joint management processes in place, and the issue of beluga entrapment was treated as a science matter that did not require the input of local people. This was a major management issue from the Inuvialuit point of view. The Inuvik Research Laboratory established by the Department of Indian Affairs and Northern Development (Ayles and Snow Reference Ayles and Snow2002) was the organisation responsible for managing the beluga entrapment of 1966. The management network in the beluga entrapment of 1966 involved the laboratory and the Inuvik Lions Club, a non-indigenous service organisation. The Inuvik Research Laboratory did not prohibit or actively discourage hunting because it was the legal right of the Inuvialuit to harvest beluga at that time, according to the DFO (Hill Reference Hill1967). However, there was no documented record of consultation or communication between the IRL and the community HTAs (Hill Reference Hill1967).
Few research participants from Tuktoyaktuk recalled specific entrapments before 1989. Those who did recounted the same story about environmental activists trying to blow up the ice with dynamite to set the whales free, and then building a shelter and unsuccessfully attempting to feed the whales to keep them alive through the winter when the attempt to open a passage to Beaufort Sea did not work (Boogie Pokiak, Fred Wolki, Angus Cockney, personal communications, July-August 2009). All these participants said that the HTA had not been consulted, and that the government and the environmental activists treated the issue as their own.
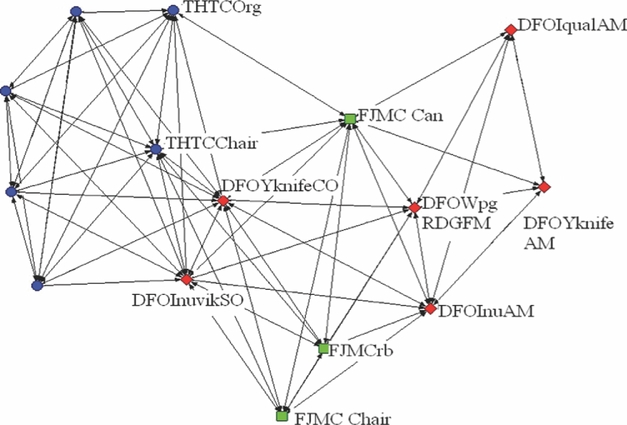
After 1984, various provisions of the agreement came into force gradually (Doubleday Reference Doubleday and Pinkerton1989). In 1986 the FJMC was established and the DFO had created an area office in Inuvik to deal with its new responsibilities as described by the IFA. The entrapment of 1989 involved these new organisations as well as the HTCs of Tuk and Inuvik (Fig. 1), but there were still remnants of top-down management, according to many Inuvialuit members. The primary communication link between DFO Inuvik and the FJMC was directly between the DFO area manager and the FJMC chairman, rather than through formal meetings of the two organisations. Although other members of the organisations did communicate, as shown in Fig. 1, decisions were made primarily through the communications between the DFO area manager and the FJMC chairman (Burton Ayles, personal communication, 15 September 2009). This DFO-led decision-making process resulted in the idea of a community harvest. Although the formal system had been changed, the FJMC had only been in existence for three years and had not yet had time to integrate the network to the extent in which all participating organisations were involved at all stages of the decision-making process. Essentially at this time the framework for co-management had been set, but the details of the co-management process had yet to materialise.
Sociogram of all individuals comprising the management network from 1989 with organisation positions as nodes. The four unlabelled nodes on the left represent the four members of the Tuk HTC board.

At the time of the 1989 entrapment, the FJMC was still going through the process of determining what its responsibilities were and what decisions it should be involved in (Robert Bell, personal communication, 15 September 2009). Communication with the HTCs was also not as easy at that time and was usually only possible at scheduled meetings. Although there was not full involvement of all co-management partners, there was considerably more communication in the process of refining and implementing the decision to harvest. Vic Gillman, the DFO area manager of Inuvik at the time, explained: ‘If the HTC had not agreed to do the harvest, the DFO would have then taken steps to determine what would be an appropriate course of action’ (Vic Gillman, personal communication, 20 August 2009). The organisational structure of the management networks changed considerably from 1989 to 2006. The most significant change was that the Inuvialuit, through their involvement in the co-management system, were meaningfully involved in the decision-making process. The HTC do not have a desired pre-determined singular course of action with regard to the entrapments, but rather a flexible and adaptable decision-making process as the key to management.
In 2006, the network of organisations involved in first responding to the entrapment and deciding what to do included DFO offices, the FJMC, and community HTCs. Instead of taking an a priori management decision, the DFO involved the HTC as equal partners from the beginning in deciding what should be done with the trapped whales. This approach allowed for greater flexibility in choosing management strategies that reflected knowledge and opinions from all the organisations involved. According to Ayles and others (Reference Ayles, Bell, Hoyt, Armitage, Berkes and Doubleday2007), this integration of the management network led to the emergence of adaptive co-management, in which equal involvement of all member organisations in the entire lifecycle of every management project was ensured through a standardised procedure. The adaptive cycle of co-management involves an iterative process in which an issue such as entrapment is managed with a co-created formalised decision-making matrix, the performance of which is evaluated at regular intervals and modified accordingly, allowing for learning-by-doing.
Changes within the organisations as well as changes in their relationships contributed to the increase in connectivity of the network. This increase has facilitated information exchange. In 1989 and 2006, certain key actors made more connections between organisations than did others. These key actors were mostly organisation chairmen and FJMC members. However, DFO personnel who were on the ground and actively involved in entrapments as sampling officers, marine mammal technicians, and conservation officers, were most often better connected in the network than were senior managers. The DFO members who were on site were in communication with the FJMC, the community and HTC members. Thus, they were responsible for much of the feedback that went to the higher levels of DFO. Long-standing relationships between these personnel and a particular community appear to be a valuable part of the evolution of co-management. The FJMC recognised Jack Orr (DFO marine mammal sampling technician) by giving him their co-management award in 2004 for this very reason. However, many scientists and technicians were not involved in the co-management process in the long term because of mobility. The members of the Tuk HTC from 1989 did not recall seeing the DFO technicians who were at the 1989 entrapment again after the harvesting that occurred that winter.
Fig. 1 represents communication that occurred after the initial DFO meeting. Although all of the people in positions listed in the figure did communicate regarding the entrapment at one point or another during the process, there was an initial DFO internal consultation that did not involve the HTC members, and only minimally involved the FJMC members.
It is clear from Fig. 1 that the HTC members (circles) are closely linked to one another as well as some DFO (diamonds) and FJMC (squares) members, but that certain senior DFO members are not in direct contact with the HTC members. The FJMC's involvement in this entrapment was not as thorough as it would later become. There is no mention of the entrapment in the FJMC's 1989–1990 annual report even though the issue is covered in full in the 2006–2007 annual report.
Between 1989 and 2006 there were some calls for change in structure of the DFO. Lane and Stephenson (Reference Lane and Stephenson1998) argued for a shift from the top-down, science-based DFO management strategy to a ‘fisheries management science’ that includes multiple actors at various levels of organisation in a cooperative manner in management processes. However, the differences in the structure of the 1989 and 2006 decision-making processes are probably the result of changes at the local level in the Inuvialuit settlement region and cannot be attributed solely to the shift in the DFO's approach to fisheries management in general.
Changes in the structure of the DFO offices did have a significant impact on the FJMC's access to higher levels of the DFO. Originally, the FJMC communicated to the DFO primarily through what was then the Inuvik area office. At that time, this was one of three area offices in the Arctic (eastern, central, and western) whose managers reported directly to the regional director (RD). However, due to budget cuts in the early 1990s and the establishment of Nunavut Territory as a new administrative unit, the structure of DFO was changed by combining the central and western Arctic Areas into one with headquarters in Yellowknife. The Inuvik office became a district office that reported to the Yellowknife area office.
Instead of being considered one of three offices in the north, Inuvik was now just part of the second. The manager in Inuvik had always come to the FJMC meetings as the DFO contact, but the person in Yellowknife decided they would not do that. They named a coordinator who was based in Inuvik that sometimes was acting as the manager of Inuvik and sometimes was not, ‘but it was definitely a downgrade in the level of contact that we had with the hierarchy that we (The FJMC) needed’ (Burton Ayles, personal communication, 15 September 2009).
Not all the changes in the structure of the network were due to official changes such as these. Under the IFA one directive of the FJMC is to review the role of the HTCs and determine their reporting requirements as well as their level of involvement in gathering information regarding subsistence harvest statistics (INAC Indian and Northern Affairs Canada 1984). This relationship has been refined jointly through the process of co-management, resulting in the higher level of communication and information exchange (Robert Bell, personal communication, 15 September 2009). The SNA data depict communication during specific times, but the general picture that emerged during the research was that quantity and quality of communication between the local and higher levels (HTC, FJMC, DFO) increased from 1989 to 2006. Communication and information exchange was critical during times of entrapment. In earlier entrapments, the Inuvialuit did not have as good an opportunity to share their knowledge and opinions regarding how the entrapments should be dealt with. After several years of developing communication and information exchange largely through informal relationship-building, management decisions such as entrapments now reflected a greater range of knowledge from co-management network members.
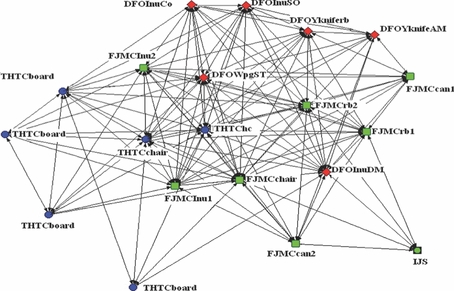
The 2006 management network (Fig. 2) shows increases in the number of nodes, ties, linkage density, and centralisation as measured by degree centrality, and a decrease in centralisation as measured by Bonacich centrality relative to the 1989 management network (Table 1). There is also a slight decrease in Eigenvector variance, which may reflect an increasing equality of influence among all network members. The increase in the number of individuals involved and the density of their linkages clearly shows a trend towards a higher degree of connectedness. In this case, the increase in degree centrality does not mean an increase in top-down governance, where more important management decisions are made only at the higher levels. The top five most influential persons in the 2006 network are the FJMC chairman, THTC hunt captain, DFO sampling technician, THTC chairman, and FJMC Inuvialuit member, who was a resident of Tuktoyaktuk. The increase in centralisation as measured by degree centrality is a result of the increase in the number of linkages between these five and other persons in the network at large (Table 2). Bonacich centrality measures the centrality of each point in a graph by adding the centralities of all adjacent (linked) points (Bonacich Reference Bonacich1972). This measure is considered more accurate than straight forward degree centrality, which only takes into account the number of adjacent points to a given node. That is, Bonacich centrality gives a better picture of the overall pattern of a complex network (Bonacich Reference Bonacich2007).
Comparison of network metrics from the 1989 and 2006 beluga entrapment cases

Top 5 best–connected participants in 1989 and 2006, measured by Bonacich Eigenvector centrality

Sociogram of individuals comprising the management network from 2006 with organisation positions as nodes.

A high variance in Eigenvector centralities among network members would then indicate that certain members have easier access to these network resources than others. This can be interpreted as transparency with regard to decision-making process. In summary, network analysis indicates that both the size of the network and the level of connectivity between individuals therein increased from 1989 to 2006. Members of lower level organisations had a higher degree of connectivity and centrality in the network, meaning that they had become more influential and more likely to share in the information and resources that were flowing through the network.
Discussion and conclusions
The evidence from the beluga case indicates that the time dimension of co-management is indeed important in that refinement of co-management arrangements and communication systems can take years to reach a point at which decisions are made to the satisfaction of all member organisations. In the Canadian western Arctic, resource management disputes have a long history, a part of the colonial history of the area in which central government authorities for many decades made decisions without consulting the local indigenous people who had always considered the land and resources to be theirs. The management of beluga entrapments during that earlier time period is typical of this top-down pattern that was apparently so entrenched that the signing of the IFA in 1984 did not seem to have had an immediate impact on how decisions were made. The agreement was critical in recognising local indigenous rights, but not in and of itself sufficient initially to bring about a functional co-management system that gave the Inuvialuit joint decision-making powers.
The co-management body under the agreement (FJMC) was not established until 1986, and it took several years before FJMC's responsibilities were delineated and the government and indigenous representatives developed working relationships (Ayles and others Reference Ayles, Bell, Hoyt, Armitage, Berkes and Doubleday2007). The relatively weak network that characterises the 1989 beluga entrapment case provides a benchmark on the question of how long it may take for co-management to mature. The early years of the co-management system show a lesser degree of communication and involvement of the HTC in the entrapment issue than in later years. In this case, the efficacy of management decisions is subjective and so is ultimately determined by the degree of satisfaction among all the member organisations in the outcomes of the decisions. Part of the explanation for the slow development of co-management (Chuenpagdee and Jentoft Reference Chuenpagdee and Jentoft2007) is linked to the difficulties of colonial relationships between government and indigenous parties.
However, the entry of the FJMC into the decision-making arena was an important milestone. As a bridging organisation (Hahn and others Reference Hahn, Olsson, Folke and Johansson2006; Berkes Reference Berkes2009), the FJMC coordinated the participants, brought them together around the table, facilitated communication, and built capacity, especially in bridging government science and Inuit traditional knowledge. The FJMC enabled the co-production of knowledge, through a collaborative process of bringing different sources of knowledge together to understand and address the problem of beluga entrapment (Armitage and others 2011). This key role of FJMC may be seen in Fig. 1 and the subsequent expansion of the network in Fig. 2.
These networks may be considered ‘learning networks’, studied also in other cases of co-management that have a social learning component (Olsson and others Reference Olsson, Folke and Berkes2004; Olsson and others Reference Olsson, Folke, Galaz, Hahn and Schultz2007). This case shows a definite increase in deliberation and information transmission among the members of the co-management network in terms of exchange of ideas, regardless of power relationships (Newig and others Reference Newig, Günther and Pahl–Wostl2010). The response of the network to the 2006 beluga entrapment event illustrates learning-by-doing in that problems that came up in earlier entrapments were dealt with by reworking the management decision-making process (Armitage and others Reference Armitage, Berkes and Doubleday2007). The development of such problem-solving capability is significant in the face of environmental change in the Arctic because of its community-empowering influence. Carlsson and Berkes (Reference Carlsson and Berkes2005) argued that co-management evolves through collaborative problem-solving. The resulting community empowerment helps build adaptive capacity to deal with other problems as well (Armitage and others Reference Armitage, Berkes, Dale, Kocho-Schellenberg and Patton2011), and enables the communication of the community's knowledge and expertise to the outside world (Bonny and Berkes Reference Bonny and Berkes2008). This empowerment function of co-management is not unique to the beluga case but may also be seen in other co-management examples in the Arctic and elsewhere (Olsson and others Reference Olsson, Folke and Berkes2004; Dale and Armitage Reference Dale and Armitage2011; Armitage and others Reference Armitage, Berkes, Dale, Kocho-Schellenberg and Patton2011).
By using SNA, we quantify one dimension of co-management (the elaboration of the communication network) and show graphically how increased communication in this case went hand in hand with a more equitable distribution of meaningful involvement in decision making. SNA helps document how co-management can actually develop over time. New legal arrangements take time to mature; working relationships and trust need to be built (Berkes Reference Berkes2009) and trial-and-error corrections need to be made through social learning (Armitage and Plummer Reference Armitage and Plummer2010). Our conclusions hinge on the documentation of communication networks; a detailed understanding of the case is important because denser networks need not necessarily lead to better communication (for example they could signify adversarial interactions). In this case, however, we know by interviewing the parties involved, that a denser network from 1989 to 2006 does in fact represent better communication and an improved capacity to solve problems to the satisfaction of co-management network members.
The case we have studied is a relatively small example in collaborative management. We make no claim that co-management can solve all problems, including those related to inequitable power relations between government managers and community representatives. It has been argued that new institutions under land claims agreements force indigenous groups to play the government's game (White Reference White2006). Nevertheless, it is also clear that the environmental and social problems of the contemporary Arctic cannot be solved by indigenous traditional institutions alone. All co-management arrangements are essentially compromises (Berkes Reference Berkes2009). However, as illustrated by the beluga entrapment case, co-management under the IFA has produced some results that are considered by both government and indigenous parties to be providing positive outcomes for both.
Acknowledgements
We are grateful to the organisations that participated in the study and people of Tuktoyaktuk for their hospitality to JEKS. We thank the Fisheries Joint Management Committee; Louie Porta, Sheila Nasogaluak, Max Kotokak, and Vic Gillman. Gilman, R. Bell, B. Ayles, D. Raddi, B. Pokiak, F. Wolki and A. Cockney provided specific information to fill gaps in the story of beluga entrapments. Burton Ayles, Derek Armitage and Thomas Henley provided advice, and Jacqueline Rittberg gave technical help. The study was part of a ArcticNet team project, ‘Adaptation in a changing Arctic’ (B. Smit, PI) under the International Polar Year (IPY). Support for the study was provided by ArcticNet and by a University of Manitoba graduate fellowship to JEKS. Berkes’ continuing work has been supported by the Canada Research Chairs programme (http://www.chairs.gc.ca).